ABSTRACT:Introduction:The global epidemiologic scenario indicates an increase in cardiovascular disease rates, with special emphasis on acute myocardial infarction (AMI), owing to its large magnitude and severity. In Brazil, coronary diseases now account for about 5% of hospital admission expenditures. Objective:To characterize the admissions in the Brazilian Uniied Health System of patients with AMI, by identifying clusters suggested by a traditional cluster analysis and by a multiple correspondence analysis (MCA). Methods: The records of the Hospital Information System/ Brazilian Uniied Health System with a primary diagnosis of AMI in the State of Rio de Janeiro, Brazil, 2002, were selected and subsequently related to the records of the Mortality Information System. Next, an MCA and a metric called the tolerance distance were used for cluster identiication. The variable of interest was “hospital expenditures”, classiied into two categories (above and below BRL 905). Results: “Higher costs” were associated with “use of the Intensive Care Unit (ICU)” and “moderate severity of the case” and “lower costs” with “low severity” and “nonuse of the ICU”. On the other hand, high severity cases, with no apparent association with “use of ICU” or other categories. Other associations identiied were “lower costs” and “no displacement of the patient,” “female,” “age between 56 and 75 years,” “death within 30 days,” and “death within 1 year”. Conclusions: The nonclustered characteristic of the most serious cases and the association between “deaths” and “lower costs” suggests that the technological resources available during hospitalization for AMI are not being properly used.
Keywords: Health services accessibility. Myocardial infarction. Delivery of health care. Hospital mortality. Risk factors. Multifactor dimensionality reduction.
Characterization of the variation of health
care taking into account the costs of hospital
admissions for acute myocardial infarction in
Brazilian Uniied Health System
Caracterização dos padrões de variação dos cuidados de saúde a partir dos gastos
com internações por infarto agudo do miocárdio no Sistema Único de Saúde
Felipe Machado HugueninI, Rejane Sobrino PinheiroII,
Renan Moritz Varnier Rodrigues AlmeidaI, Antonio Fernando Catelli InfantosiI
ORIGINAL ARTICLE / ARTIGO ORIGINAL
IGraduate Program in Biomedical Engineering, Alberto Luiz Coimbra Institute ‑ Graduate Shcool and Research in Engineering,
Universidade Federal do Rio de Janeiro – Rio de Janeiro (RJ), Brazil.
IIInstituto de Estudos em Saúde Coletiva, Universidade Federal do Rio de Janeiro – Rio de Janeiro (RJ), Brazil.
Corresponding author: Renan Moritz Varnier Rodrigues Almeida. Programa de Engenharia Biomédica, Universidade Federal do Rio de Janeiro. Caixa Postal 68510, Cidade Universitária, CEP: 21941‑972, Rio de Janeiro, RJ, Brasil. E‑mail: renan@peb.ufrj.br
INTRODUCTION
In recent decades, the global epidemiological scenario shows an increase in cardiovascu-lar disease, with special emphasis on acute myocardial infarction (AMI) owing to its cardiovascu-large magnitude and severity1. In 2011, about 20 million people were sufering from cardiovas-cular diseases worldwide, of which approximately 12 million were victims of fatal AMI1. Similarly to what has been happening worldwide, Brazil has showed changes in its population’s morbidity and mortality proile. The number of deaths from cardiovascular diseases has been growing, although accompanied by a progressive decrease in mortality rates2. However, cardiovascular diseases are currently the leading cause of death in Brazil3,4, being responsible for about 29% of deaths in 20095. This year, they represented the third leading cause of hospitalization in the Brazilian Uniied Health System (SUS), with more than 1 million hospitalizations and total spending of about 1.9 billion reais6. Values of this magnitude have a huge inancial impact on the health system. They constituted about 5% of expenditures with hospital admissions in the early 2000s7, and this percentage was reit-erated in the current decade8.
On the other hand, the ease of access to databases on the use of health services has promoted an increase in the number of studies on the allocation of health resources in Brazil. Thus, various statistical techniques have been proposed for the analysis of such data and to aid decision-making processes in health care. One of these techniques, multiple
RESUMO:Introdução:O cenário epidemiológico mundial revela um crescimento das doenças cardiovasculares, no qual se destaca o infarto agudo do miocárdio (IAM), devido à sua grande magnitude e severidade. No Brasil, doenças coronarianas representam já cerca de 5% dos gastos com internação hospitalar. Objetivo:Caracterizar as internações dos pacientes do Sistema Único de Saúde (SUS) por IAM por meio da identiicação de agrupamentos sugeridos por uma análise de agrupamentos tradicional e por uma análise de correspondência múltipla (ACM).
Métodos: Registros do Sistema de Internações Hospitalares (SIH/SUS) com diagnóstico principal de IAM, no Estado do Rio de Janeiro, 2002, foram selecionados e posteriormente relacionados aos do Sistema de Informações sobre Mortalidade (SIM/SUS). A seguir, uma ACM e uma métrica chamada distância de tolerância foram utilizadas para a identiicação de clusters, sendo a variável de interesse “gastos com internação” classiicada em duas categorias (acima e abaixo de R$ 905,00). Resultados: Foi possível associar “maiores gastos” com “utilização de Centro de Tratamento Intensivo (CTI)” e com “gravidade moderada do caso”, e “menores gastos” com “gravidade leve” e “não utilização de CTI”. Por outro lado, casos de alta gravidade apresentaram-se isolados, sem associação com CTI ou outras variáveis. Também foi detectada associação entre a categoria “menores gastos” e as categorias: “não deslocamento do paciente”, “sexo feminino”, “idade entre 56 e 75 anos”, “óbito até 30 dias” e “óbito até 1 ano”. Conclusão: o aspecto isolado dos casos de maior gravidade e a associação entre “óbitos” e “menores gastos” sugere que os recursos tecnológicos disponíveis durante a internação por IAM não estão sendo adequadamente empregados.
correspondence analysis (MCA), which basically consists in representing the relative posi-tion of variables in a Euclidean space, although of great potential, still has not been widely employed9. The MCA has the advantage of not requiring the assumptions of the gaussianity and linearity of the data, and, by enabling the visualization of categories of variables, also suggests associations based on the distance between these categories (the closer they are, the more likely they are associated)10,11. The MCA can be used not only as an exploratory technique but also to suggest associations between categories of variables12-14.
In this context, it is particularly important to identify variables that can better char-acterize or predict such high costs, and studies conducted in the country with patients hospitalized for AMI, based on medical records or secondary data, have used multi-variate methodologies15-17. However, we did not identify the use of the statistical tech-niques MCA and hierarchical cluster for this purpose. Therefore, this study aimed to characterize hospital admissions of patients in the Brazilian Unified Health System for AMI in municipalities in the state of Rio de Janeiro, by identifying clusters suggested by the MCA. In addition, in order to make it a more objective technique, allowing for the control of confounding factors and eliminating the possibility of presenting and dis-cussing false associations, we used a heuristic proximity index, the tolerance distance12.
MULTIPLE CORRESPONDENCE ANALYSIS AND TOLERANCE DISTANCE
For the application of this method, the data must be adjusted in the form of a rectangu-lar matrix in which rows (n) represent, e.g., patients, and columns (p) represent the catego-ries of the variables analyzed, thus creating an indicator matrix Z. Through the standard-ization of each element (zij) of this matrix by the corresponding row (ri) and column (cj) proiles, given by the marginal relative frequencies (masses) of rows and columns, a stan-dardized matrix G with gij elements is obtained, according to Equation 1.
(1)
In which:
(mass of rows);
(mass of columns).
(2)
above, U and V are matrices of singular vectors; the irst corresponding to the rows and the second to the columns. D is a diagonal and square matrix, composed of the singular values associated with each one of the rows or columns. Thus, the main coordinates of the rows and columns can be estimated from the product of the standard coordinates and their respective singular values.
Similarly to the known techniques of principal component analysis and factor analysis, the MCA works with the concept of explained variance, here called Inertia, according to Equation 3.
(3)
In which:
Q = number of active variables;
j = singular values related to the indicator matrix; = adjusted value.
The graphical representation of the coordinates of the categories is called the corre-spondence map, which is formed by the projection of the main line and/or column coor-dinates in the two or three dimensions (axes) of greater inertia (higher contribution to the variability of the data). The usual interpretation of this map is based on the spatial prox-imity between the categories of variables. However, this proxprox-imity depends on, among other factors, the inertia of the dimensions considered, the scale of the graph, and even on user experience. An alternative to the evaluation of the association between catego-ries is the use of a heuristic index, called tolerance distance12-14, expressed by Equation 4.
(4)
In which:
X and Y = main coordinates of the categories;
X = (x1, x2, … , xs), Y = (y1, y2, … , ys), in which s is the maximum dimension, obtained through a scree plot, and Λ is the diagonal matrix, which α
j elements are given by Equation 5.
Therefore, the tolerance distance is a weighted Euclidian distance, in which the weights are given by the ratio between the adjusted inertia and the inertia of the first dimension12-14. This distance provides an objective interpretation of the con-cept of proximity between categories, allowing inferences about the relationship between variables.
Another important concept in the MCA is the supplementary variable: when there is a need to establish associations between explanatory variables and one response variable; as in a regression, the response variable can be inserted in the correspondence analysis graph by means of a transition formula10,11. Thus, this variable does not inluence the calculations of the main coordinates nor of the variability.
METHODS
DATABASE
First, the Hospital Information System (SIH/SUS) was surveyed, and we selected hos-pitalizations with a primary diagnosis of AMI (International Classiication of Diseases 10th Revision: I21 or I22), from hospitals ailiated with the Brazilian Uniied Health System (SUS) in the state of Rio de Janeiro in 2002. Records of children under 18 years (only three incomplete records) were excluded. On the other hand, the records of a irst hospitaliza-tion for AMI in 2002 were kept, and a passive follow-up of patients was conducted in the Mortality Information System (SIM) in 2002 and 2003 by means of a probabilistic linkage of the records using the software RecLink18,19.
Thus, the study was population-based, with patients receiving care in the SUS network (cross-sectional design), of both sexes, aged between 18 and 100 years in the municipalities of Rio de Janeiro. The records of hospitalization by AMI in 2002 (SIH/SUS) were used for the analysis, along with information on mortality for the years 2002 and 2003 owing to the availability of the data compiled.
The variables “place of hospitalization” and “place of origin” were merged into a sin-gle variable, called “intermunicipal displacement” (two variables became one). Similarly, the variables “revascularization,” “angioplasty,” “transplants,” “orthotics and prosthetics,” “diagnoses and therapies,” “blood transfusion,” and “CT and MRI” were merged to form the variable “use of technology” (seven variables became one). After these procedures, only those variables with categories showing a variability percentage higher than 5% were main-tained, resulting in 10 variables.
STATISTICAL ANALYSIS
Euclidean space, so that the proximity between the categories of these variables relects their associations14.
In the application of MCA, the outcome (response) variable used was the expendi-ture with patients hospitalized for AMI (MCA output), because, as mentioned, coro-nary diseases, especially AMI, have a major financial impact on the health system7,20, and the others were considered as inputs, that is, possibly related to that expenditure. Initially, the “standardization of the indicator matrix” was performed. Next, those data were represented in a Euclidean space through a “correspondence map”. The maxi-mum dimension s was selected through a scree plot, a graph criterion often used in factor analysis12,14.
The tolerance distance was estimated from the ifth percentile (5%) of all the distances between pairs of categories. This distance was considered to be an association threshold, that is, two categories were considered to be linked when their distance was below that threshold12-14. To check whether the associations found were stable, we used the bootstrap simulation method (construction of sampling distributions through resampling, having as a methodological basis the same population sample that originated the data, as described by Costa et al.12. Thus, about half of the records was randomly selected (n = 2,200), repeat-ing the MCA and the calculation of the tolerance distance. This procedure was repeated 1,000 times, the number of common clusters was determined, and those that showed more than 75% of repeatability were considered stable12.
In order to compare the methodology used (MCA + tolerance distance) to a widely used statistical technique, a dendrogram (a graphical representation of clus-ters of variables) was also constructed from a hierarchical cluster analysis. In gen-eral, the horizontal axis of a dendrogram represents the categories of the variables analyzed and the vertical axis represents their similarity. The number of clusters in a hierarchical analysis can be determined by a metric that indicates the proximity of the clusters, called “fusion level”21. Next, the groups formed by each methodology were compared empirically.
For the statistical treatment of the database, we used the statistical software R, version 2.11.122, also using the ca package. This software is the result of an international collabo-ration, is distributed free of charge, is user-friendly, and allows for comprehensive statis-tical analysis. The study was approved by the Research Ethics Committee of the School of Nursing Anna Nery of Universidade Federal do Rio de Janeiro (EEAN/UFRJ).
RESULTS
Table 1. Absolute and relative frequencies of the variables used to characterize the variation of health-care standards from the costs on admissions for acute myocardial infarction. A total of 4,435
patients were admitted to hospitals in the Brazilian Uniied Health System, Rio de Janeiro, in 2002.
Variables/categories Absolute frequency Relative frequency (%)
Type of hospital (HOSP)
Contracted (0) 1,276 29
Self-owned (1) 3,159 71
Intermunicipal displacement (DESL)
No displacement (0) 3,781 85
With displacement (1) 654 15
Place of admission (REG)
Nonmetropolitan (0) 1,374 31
Metropolitan (1) 3,061 69
Age (ID) (years)
18–55 (0) 1,591 36
56–75 (1) 2,256 51
≥ 76 (2) 588 13
Sex (SEXO)
Females (0) 1,669 38
Males (1) 2,766 62
Use of technologies (TEC)
Low complexity (0) 3,025 68
Moderate complexity (1) 1,219 27
High complexity (2) 191 5
Time of admission (INT)
Up to 7 days (0) 2,393 54
8–30 days (1) 1,864 42
Over 30 days (2) 178 4
Use of Intensive Care Unit (CTI)
No (0) 3,145 71
Yes (1) 1,290 29
Death (OB)
No (0) 3,163 71
Within 30 days (1) 722 16
Within 1 year (2) 550 13
Costs (GAST)
Lower than BRL 905,00 (0) 3,212 72
The application of the MCA resulted in the correlation map shown in Figure 1, where dimension 1 explains approximately 61.8% of the variability in the data (the considered “inertia”), which is more related to the structure of hospital care. On the other hand, dimen-sion 2 explains approximately 27.1% of the variability and is more closely associated with processes applied to AMI patients. Thus, the total inertia of the MCA, taking into account only the irst two dimensions, is approximately 0.89.
Taking the outcome variable as reference, the correlation map suggests an asso-ciation between the “costs lower than BRL 905.00 (GAST0)” and “death within 30 days (OB1),” “use of low complexity technologies (TEC0),” “nonuse of Intensive Care Unit (CTI0),” “age equal or higher than 76 years (ID2),” and “female (SEXO0).” Moreover, regarding the “costs higher than BRL 905.00 (GAST1),” the map suggests an association with: “use of ICU (CTI1)” and “use of moderate complexity technol-ogies (TEC1)”.
The tolerance distance obtained (calculated up to the second dimension) was 0.024. Considering that tolerance distance and the nine groups in pairs that include the outcome variable, we obtained seven associations between categories of
-0.2 -0.1 0.0 0.1 0.2 0.3
-0.05 0.00 0.05 0.10 0.15 0.20
Dim1 (61.8%)
HOSP0
HOSP1 DESL0
DESL1 REG0
REG1 ID0
ID1
ID2 SEXO0
SEXO1
TEC0
TEC1 TEC2
INT0 INT1
INT2
CTI0
CTI1
OB0
OB1
OB2 GAST0
GAST1
Dim2 (27,1%)
HOSP: contracted hospital; HOSP: self-owned hospital; DESL0: no displacement; DESL1: with displacement; REG0:
nonmetropolitan region; REG1: metropolitan region; ID0: age 18–55 years; ID1: age 56–75 years; ID2: age ≥ 76 years;
GAST0: cost lowed than BRL 905.00; GAST1: cost higher than BRL 905.00; Ob0: no death; OB1: death within 30 days; OB2: death over 30 days; TEC0: use of low complexity technologies; TEC1: use of moderate complexity technologies; TEC2: use of high complexity technologies; CTI0: nonuse of Intensive Care Unit; CTI1: use of Intensive Care Unit; SEXO0: females; SEXO1: males; INT0: less than 7 days of hospitalization; INT1: between 7 and 30 days of hospitalization; INT2: over 30 days of hospitalization.
Figure 1. Correspondence map generated by a Multiple Correspondence Analysis based on variables used to characterize costs of admissions for acute myocardial infarction. A total of 4,435 patients
variables with “cost lower than BRL 905.00 (GAST0):” “no displacement (DESL0),” “Aged 76 years or older (ID2),” “females (SEXO0),” “use of low complexity tech-nologies (TEC0),” “death within 30 days (OB1),” “death within 1 year (OB2),” and “nonuse of ICU (CTI0)”. However, two other associations, with “cost higher than BRL 905.00 (GAST1)” were identified: “use of moderate complexity technologies (TEC1)” and “use of ICU (CTI1)”.
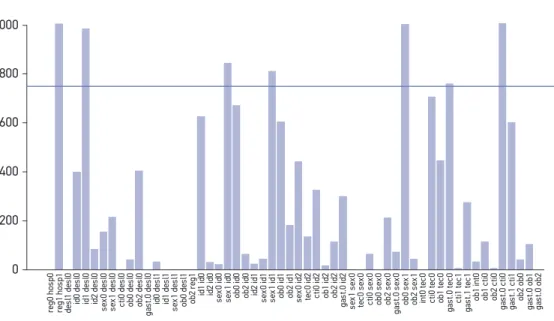
After validation by the bootstrap method, only seven associations could be considered stable, two of which included the outcome variable (Figure 2). In this igure, the bars rep-resent the number of occurrences found in the validation process while the continuous line indicates the limit set for stability (75%). Table 2 shows the categories associated with the outcome variable.
The cluster analysis (hierarchical cluster) enabled the construction of the dendrogram shown in Figure 3. Associated with “cost lower than BRL 905.00” are the following: “nonuse of ICU (CTI0),” “use of low complexity technologies (TEC0),” “up to 7 days of hospitaliza-tion (INT0),” “death within 30 days (OB1),” and “aged 76 years or older (ID2)”. Four asso-ciations with “cost higher than BRL 905.00” were suggested: “use of ICU (CTI1),” “use of moderately complex technologies (TEC1),” “more than 30 days of hospitalization (INT2),” and “use of highly complex technologies (TEC2).”
re g 0 h o s p 0 re g 1 h o s p 1 d es l1 d es l0 id 0 d es l0 id 1 d es l0 id 2 d es l0 s ex 0 d es l0 s ex 1 d es l0 ct i0 d es l0 o b 0 d es l0 o b 2 d es l0 g as t. 0 d es l0 id 0 d es l1 id 1 d es l1 s ex 1 d es l1 o b 0 d es l1 o b 2 re g 1 id 1 id 0 id 2 id 0 s ex 0 id 0 s ex 1 id 0 o b 0 id 0 o b 2 id 0 id 2 id 1 s ex 0 id 1 s ex 1 id 1 o b 0 id 1 o b 2 id 1 s ex 0 id 2 te c0 id 2 ct i0 id 2 o b 1 id 2 o b 2 id 2 g as t. 0 id 2 s ex 1 s ex 0 te c0 s ex 0 ct i0 s ex 0 o b 0 s ex 0 o b 2 s ex 0 g as t. 0 s ex 0 o b 0 s ex 1 o b 2 s ex 1 in t0 t ec 0 ct i0 t ec 0 o b 1 t ec 0 g as t. 0 t ec 0 ct i1 t ec 1 g as t. 1 t ec 1 o b 1 in t0 o b 1 c ti 0 o b 2 c ti 0 g as t. 0 c ti 0 g as t. 1 c ti 1 o b 2 o b 0 g as t. 0 o b 1 g as t. 0 o b 2 0 200 400 600 800 1.000
Figure 2. Bar graph showing the associations found by a multiple correspondence analysis based on
variables used to characterize the costs of admissions for acute myocardial infarction. A total of 4,435
patients were admitted to hospitals in the Brazilian Uniied Health System, Rio de Janeiro, in 2002.
Table 2. Associations for the outcome variable (hospital expenses with hospitalization) detected
by multiple correspondence analysis. A total of 4,435 patients were admitted to hospitals in the
Brazilian Uniied Health System, Rio de Janeiro, in 2002.
Costs Categories
Lower than BRL 905,00 (GAST0)
No displacement (DESL0)
Age equal or over 76 years (ID2)
Females (SEXO0)
Use of low complexity technologies (TEC0)*
Death within 30 days (OB1)
Death within 1 year (OB2)
Nonuse of Intensive Care Unit (CTI0)*
Higher than BRL 905,00 (GAST1) Use of moderate complexity technologies (TEC1)
Use of Intensive Care Unit (CTI1)
*Stable associations by bootstrap analysis.
Figure 3. Dendrogram developed from a cluster analysis with data used to characterize the costs of admissions for acute myocardial infarction. A total of 4,435 patients were admitted to hospitals
in the Brazilian Uniied Health System, Rio de Janeiro, in 2002.
TEC2 INT2
TEC1CTI1 GAST.1 INT1
HOSP1REG1 DESL1
ID0
SEXO1OB0DESL0ID1 SEXO0OB2
HOSP0
REG0ID2 OB1 INT0
TEC0 CTI0 GAST.0
0.0 0.2 0.4 0.6 0.8 1.0 1.2
hclust (*, "ward") Variable categories used
Similarity index
DISCUSSION
AMI is an acute event, which always requires emergency care followed by hospital admis-sion. Owing to its magnitude, impact on mortality, lethality, volume of admissions, and sensitivity to technological intervention, it has been especially pointed as an important dis-ease for the development of standards and indicators for the monitoring of medical care23. Data with follow-up between admission and death, such as those used in this study, are virtually nonexistent in the country. However, analysis of this type of data is crucial, owing to the unique insights that can be obtained from them. In this database, using MCA enabled the visual and simple analysis of a large number of variables, also indicating associations of variable categories. Thus, it was possible to establish the proile of admissions for AMI in the municipalities of the State of Rio de Janeiro, and underlying structures were detected, by reducing data dimensionality.
The correlation map generated from the MCA had a total inertia, considering the irst two dimensions, of 0.89, with the irst dimension explaining about 61.8% of the variability of the data and dimension 2, approximately 27.1%. Dimension 1 more directly represents the structure of hospital care, highlighting the variables “type of hospital” and “place of hospitalization”. On the other hand, dimension 2 is more related to the procedures adopted in the care to patients with AMI, pointing to the “use of technology.” Therefore, from the analyzed variables, which did not include detailed clinical information about the patient, it was found that those related to the structure of hospital care (type of hospital; area of ser-vice) were far from the centroid, with a high percentage of explanation of the variability of cases (in MCA, the greater the distance from one category to the centroid, the higher its explanatory power)11.
The MCA, together with the tolerance distance, suggested 56 associations, of which 9 refer to the outcome variable: 7 were associated with “cost lower than BRL 905.00” (“no displacement,” “age ≥ 76 years,” “female,” “use of low complexity technologies,” “death within 30 days,” “death within 1 year,” and “nonuse of ICU”); and 2 were related to “cost higher than BRL 905.00” (“use of moderate complexity technologies” and “use of ICU”). As mentioned, two were considered stable by the validation method used (bootstrap). These associated the “cost lower than BRL 905.00 (GAST0)” to the “use of low complexity technologies (TEC0)” and “non-use of ICU (CTI0).”
are not being adequately used in patient care, thus resulting in negative outcomes, which would be relected in the correspondence maps as a lower association between these cases and the use of technologies.
The methodology also suggested an association between cases that used less complex technologies and patients aged over 75 years. Individuals in this age group already have collateral circulation (arteriogenesis)24, which decreases the intensity of the stroke, making the AMI less severe, with less need for highly complex interventions. On the other hand, younger persons, owing to not having an auxiliary mechanism when the partial or total occlusion of a vessel occurs; and older people, with debilitated and weakened heart muscles, are victims of the most serious AMI cases, with medium and high complexity. However, the association of cases using less complex technology with death and with no use of ICU indicates diferences between diagnoses (directly inluencing the type of treatment, owing to the actual severity of the case), and possibly early hospital discharges. In addition, the low percentage of use of ICU (Table 1) can also be explained by its underreporting17, or even by “barriers to access” (nonavailability of beds).
The methodology of the MCA + tolerance distance showed no signiicant diferences relating to the hierarchical cluster method. The clusters represented by the dendrogram are similar to the indings of the tolerance distance methodology. Note, however, that the clus-ters formed by the hierarchical clustering methodology include categories that are appar-ently more distant. These associations were not detected by the tolerance distance, which is more rigorous, formalized, and systematic in deining associations12. Furthermore, the tolerance distance enables subsequent validation processes, such as stability analysis, used in this study.
The percentage of deaths by AMI in the study is similar to that estimated by the Brazilian Ministry of Health8, through the data for hospital deaths from SIM. Overall, the proile of expenditures follows the national standard, with lower expenses related to cases using low complexity technologies and nonuse of ICU, and vice-versa. Two issues, however, stand out: the irst is related to the use of ICU, which, in both sexes (29%), is well below that seen in developed countries25. This low use can also help explaining the mentioned lack of association between cases with use of highly complex technologies and the use of ICU observed in this study. The second relates to the fact that, in the correspondence map, the category “males (SEXO1)” is close to “no death,” and that the category “females (SEXO0)” is close to “death within 30 days (OB1)” and “death within 1 year (OB2).” Table 1 shows that the proportion of AMI cases was higher among men (SEXO1), but the mortality rate was higher among women (SEXO0), which causes the proximity between “no death” and males and “death” and females, relationships that have been identiied in the scientiic lit-erature in recent years26.
of severity, complicating comparisons between patients and hospitals. Moreover, another obstacle is that information not investigated may be involved in the admission proile, such as time interval from the onset of symptoms to admission, size of infarct, and hemody-namic situation at the time of initial evaluation. The lack of registration of these variables makes it diicult to perform predictive analyses for clinical outcomes or the adjustment of risk factors.
In terms of future research, it would be interesting to build databases with linkage to more updated data, allowing for studies contemplating the use of bases with patient records in their structure, that is, variables related to clinical and physical aspects of the individuals. It would also be important to use these bases for longer follow up periods, which would allow the collection of more accurate information, allowing more eicient use of inancial resources by the managers.
CONCLUSION
In conclusion, the study indicates that lower costs are more associated with not using ICU and cases with use low complexity technology. In contrast, higher expenses are more associated with the use of ICU and the use of moderately complex technologies, and this efect is not observed in cases with use of highly complex technologies. This last aspect sug-gests that technological facilities available in ICUs were not being adequately used in the care of hospitalized patients, thus not stopping them from dying. Such an interpretation is also supported in studies reported in the literature, which found that the use of ICU is much lower than that observed in developed countries
1. World Health Organization. Cardiovascular diseases (CVDs). Fact sheet nº 317. Geneva: WHO; 2015. Disponível em http://www.who.int/mediacentre/factsheets/fs317/en/ index.html (Acessado em 21 de fevereiro de 2013). 2. Soares GP, Brum JD, Oliveira GMM, Klein CH, Souza
e Silva NA. Evolução de indicadores socioeconômicos e da mortalidade cardiovascular em três estados do Brasil. Arq Bras Cardiol 2013; 100(2): 147-56. 3. Caluza ACV, Barbosa AH, Gonçalves I, Oliveira
CAL, Mato L, Zeefried C, et al. Rede de infarto com supradesnivelamento de ST: sistematização em 205 casos diminui eventos clínicos na rede pública. Arq Bras Cardiol 2012; 99(5): 1040-8.
4. Mansur AP, Favarato D. Mortalidade por doenças cardiovasculares no Brasil e na região metropolitana de São Paulo: atualização 2011. Arq Bras Cardiol 2012; 99(2): 755-61.
5. Teich V, Araujo DV. Estimativa de custo da síndrome coronariana aguda no Brasil. Rev Bras Cardiol 2011; 24(2): 85-94.
6. Brasil. Ministério da Saúde. Datasus - Sistema de informações sobre saúde. Disponível em http:// www2.datasus.gov.br/DATASUS/ index.php?area=02 (Acessado em 21 de fevereiro de 2013).
7. Oliveira GMM, Klein CH, Souza e Silva NA, Godoy PH, Fonseca TMP. Letalidade por doenças isquêmicas do coração no estado do Rio de Janeiro no período de 1999 a 2003. Arq Bras Cardiol 2006; 86(2): 131-7. 8. Brasil. Ministério da Saúde. Datasus - Sistema de
informações hospitalares do SUS. Disponível em http://www2.datasus.gov.br/DATASUS/index.php? area=0203&Vobj=http://tabnet.datasus. gov.br/cgi/ deftohtm.exe?sih/cnv/ni (Acessado em 7 de março de 2013).
9. Infantosi AFC, Costa JCGD, Almeida RMVR. Análise de correspondência: bases teóricas na interpretação de dados categóricos em Ciências da Saúde. Cad Saúde Pública 2014; 30(3): 473-86.
10. Le Roux B, Rouanet H. Geometric data analysis: from correspondence analysis to structured data analysis. 1ª ed. Dortrecht: Kluwer Academic Publishers; 2004. 11. Greenacre M. Correspondence analysis in practice.
2ª ed. Barcelona: Chapman & Hall; 2007.
12. Costa JCGD, Almeida RMVR, Infantosi AFC, Suassuna JHR. A heuristic index for selecting similar categories in multiple correspondence analysis applied to living donor kidney transplantation. Comput Methods Programs Biomed 2008; 90(3): 217-29.
13. Almeida RMVR, Infantosi AFC, Suassuna JHR, Costa JCGD. Multiple correspondence analysis in predictive logistic modeling: application to a living-donor kidney transplantation data. Comput Methods Programs Biomed 2009; 95(2): 116-28.
14. Nascimento A, Almeida RMVR, Castilho SR, Infantosi AFC. Análise de correspondência múltipla na avaliação de serviços de farmácia hospitalar no Brasil. Cad Saúde Pública 2013; 29(6): 1161-72.
15. Escosteguy CC, Portela MC, Medronho RA, Vasconcelos MTL. The Brazilian hospital information system and the acute myocardial infarction care. Rev Saúde Pública 2002; 36(4): 491-9.
16. Melo ECP, Travassos C, Carvalho MS. Quality of data on myocardial infarction deaths, Brazil. Rev Saúde Pública 2004; 38(3): 385-91.
17. Escosteguy CC, Portela MC, Medronho RA, Vasconcelos MTL. Hospital admissions forms versus medical records to assess risk of in-hospital death from acute myocardial infarction in Rio de Janeiro, Brazil. Cad Saúde Pública 2005; 21(4): 1065-76.
18. Soares CCP, Pinheiro RS, Escosteguy CC. Sobrevida após infarto agudo do miocárdio em pacientes internados em hospitais vinculados ao Sistema Único de Saúde no Estado do Rio de Janeiro. Cad Saúde Colet 2006; 14(2): 411-6. 19. Coeli CM, Camargo Junior KR. Avaliação de
diferentes estratégias de blocagem no relacionamento probabilístico de registros. Rev Bras Epidemiol 2002; 5(2): 185-96.
20. Gualandro DM, Calderaro D, Yu PC, Caramelli B. Infarto agudo do miocárdio após operações não cardíacas. Arq Bras Cardiol 2012; 99(5): 1060-67. 21. Hair JR, Hair JF, Anderson RE, Tatham R, Black
W. Análise multivariada de dados. 6ª ed. São Paulo: Bookman; 2009.
22. R: a language for statistical computing [computer program]. Versão 2.11.1. Vienna: R Development Core Team; 2007.
23. Melo ECP, Travassos CMR, Carvalho MS. Infarto agudo do miocárdio no Município do Rio de Janeiro: qualidade dos dados, sobrevida e distribuição espacial. Epidemiol Serv Saúde 2007; 16(2): 121-3.
24. McArdle WD, Katch FI, Katch VL. Fisiologia do exercício: energia, nutrição e desempenho humano. 2ª ed. São Paulo: Manole; 2006.
25. Sendra JM, Saaaía-Santamera A, Iñigo J, Regidor E. Factores asociados a la mortalidad intrahospitalaria del infarto de miocardio: resultados de un estudio observacional. Med Clín 2005; 125(17): 641-6. 26. Anderson RD, Pepine CJ. Gender diferences in the
treatment for acute myocardial infarction: bias or biology? Circulation 2007; 115(7): 823-6.
Received on: 03/20/2015