Submitted21 January 2016 Accepted 23 May 2016 Published13 June 2016 Corresponding author Francesc Solsona, [email protected]
Academic editor Chakchai So-In
Additional Information and Declarations can be found on page 14
DOI10.7717/peerj-cs.69 Copyright
2016 Cuadrado et al.
Distributed under
Creative Commons CC-BY 4.0
OPEN ACCESS
HBPF: a Home Blood Pressure
Framework with SLA guarantees to
follow up hypertensive patients
Josep Cuadrado1, Jordi Vilaplana2, Jordi Mateo2, Francesc Solsona1,2,
Sara Solsona1, Josep Rius2, Rui Alves3and Miguel Camafort4,5
1Hesoft Group, Lleida, Spain
2Department of Computer Science, University of Lleida, Lleida, Spain
3Department of Basic Medical Sciences, University of Lleida, Lleida, Spain
4Department of Medicine, Clinic Hospital, Barcelona, Spain
5Department of Medicine, Universitat de Barcelona, Barcelona, Spain
ABSTRACT
Hypertension or high blood pressure is a condition on the rise. Not only does it affect the elderly but is also increasingly spreading to younger sectors of the population. Treating it involves exhaustive monitoring of patients. A tool adapted to the particular requirements of hypertension can greatly facilitate monitoring and diagnosis. This paper presents HBPF, an efficient cloud-based Home Blood Pressure Framework. This allows hypertensive patients to communicate with their health-care centers, thus facilitating monitoring for both patients and clinicians. HBPF provides a complete, efficient, and cross-platform framework to follow up hypertensive patients with an SLA guarantee. Response time below one second for 80,000 requests and 28% increase in peak throughput going from one to three virtual machines were obtained. In addition, a mobile app (BP) for Android and iOS with a user-friendly interface is also provided to facilitate following up hypertensive patients. Among them, between 54% and 87% favorably evaluated the tool. BP can be downloaded for free from the website Hesoft Group repository (http://www.hesoftgroup.eu).
SubjectsComputer Networks and Communications, Distributed and Parallel Computing
Keywords Hypertension, Healtcare, eHealth
INTRODUCTION
Hypertension is one of the most important risk factors in cardiovascular diseases, the leading cause of death worldwide (Craig & Mindell,2006). It affects about 20% of the adult population, a percentage that increases with age (Aguado et al.,2009).
Home blood pressure (HBP) consists of patients taking readings at home and registering these using a digital device. The patients then send the readings to a health professional who is responsible for taking appropriate action (Pickering et al.,2008).
In a recent scientific article, the American Heart Association concluded thatHBP
monitoring should become a routine component of blood pressure measurement in the majority of patients with known or suspected hypertension (Pickering et al.,2008).HBP
readings (Ohkubo et al.,1998;Bobrie et al.,2004). Furthermore,HBPreadings provide a more accurate assessment of true blood pressure than alternative measurement methods, such as surgery blood pressure or rapid titration of antihypertensive therapy. They also avoid the white-coat syndrome and facilitate the identification of masked hypertension, leading to a greater patient involvement in managing hypertension, a condition that is typically asymptomatic (McManus et al.,2010).
Having ways to monitor HBP in a continuous and rigorous way, with a fluid
communication between patient and doctor, may be crucial in ensuring satisfactory control of blood pressure, which is currently a great challenge. Information and communication technology (ICT) can play an important role in achieving this monitoring capabilities (Green et al.,2008;Vilaplana et al.,2015). In this context, we developed and present HBPF (Home Blood Pressure Framework). HBPF is made up of two parts, the HM (Hypertension Module) server and the BP (Blood Pressure monitoring) mobile app.
HBPF provides high performance for a given SLA (Service Level Agreement). An SLA is a contract negotiated and agreed between a customer and a service provider for which a customer only pays for the resources and services used according to negotiated performance requirements at a given price (Vilaplana et al.,2015;Vilaplana et al.,2014a). Throughput is one of the most important performance metric in a cloud-computing context (Vilaplana et al.,2015;Vilaplana et al.,2014a). It was also the performance parameter chosen in this work to fix the SLA.
Frameworks such as HBPF generate large amounts of data that need to be continuously stored, processed, and available. This require the use of cloud computing services (Abbas & Khan,2014). Earlier versions of the concept underlying HBPF (Vilaplana et al.,2015;
Vilaplana et al.,2014a) were tested in a private cloud-based server, before moving the HM into a real-world cloud environment. These applications used SMS communications between clinicians and patients. This was limiting in many ways. The current platform uses Internet communication, providing physicians with access to standard medical records and allowing them to write reports and to follow up and communicate (i.e., charting and sending videos) with patients by means of HBPF. Efforts were made to design a scalable framework when the number of both patients and hospitals increased by providing Service Level Agreement (SLA) guarantees (Vilaplana et al.,2015;Mateo et al.,2014;Vilaplana et al.,2013;Vilaplana et al.,2014b;Vilaplana et al.,2014c).
The remainder of the paper is organized as follows. ‘Related Work’ details the related work addressing the problem of tele-moritoring hypertensive patients. In ‘Hypertension Module’ we present HM. ‘BP’ is devoted to explaining the operation and functionality of the BP app. This app and its performance is evaluated in ‘Results.’ Finally, ‘Conclusions’ outlines the main conclusions and future work.
RELATED WORK
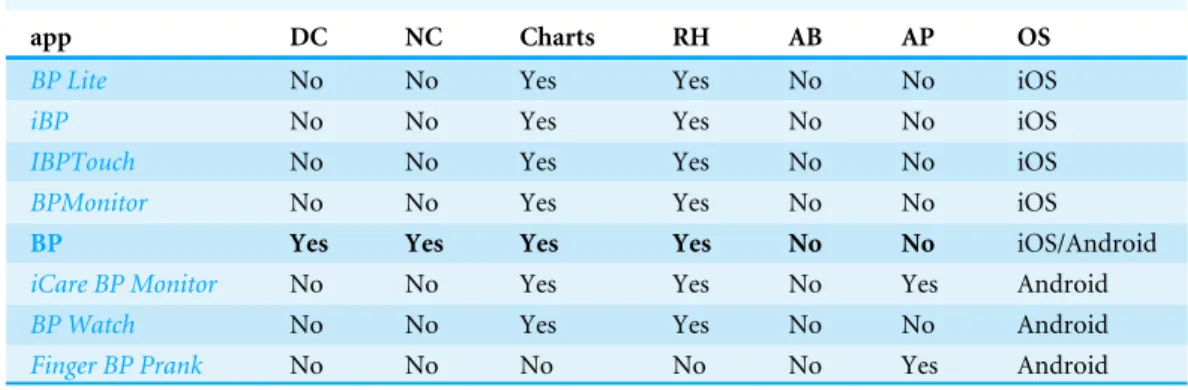
Table 1 Comparison between BP with other similar hypertension apps.
app DC NC Charts RH AB AP OS
BP Lite No No Yes Yes No No iOS
iBP No No Yes Yes No No iOS
IBPTouch No No Yes Yes No No iOS
BPMonitor No No Yes Yes No No iOS
BP Yes Yes Yes Yes No No iOS/Android
iCare BP Monitor No No Yes Yes No Yes Android
BP Watch No No Yes Yes No No Android
Finger BP Prank No No No No No Yes Android
Notes.
app, Application name; DC, Doctor Chat (direct chatting with the physician); NC, Nearby centers (provides information about the distance to specialized centers); Charts, graphical evolution Charts; RH, Readings’ History; AB, Automatic sam-pling of the Blood Pressure by means of an external device; AP, Automatic samsam-pling of the pulse rates by means of an exter-nal device; OS, Operating System.
Earlier work identified 60 websites that provided functionality to manage and present home blood-pressure readings. Out of these, 20 could be freely used. A comparison between these 20 websites was carried out between June and August 2009 (Patel et al.,2010). The results showed that none of these 20 websites were directly linked to common electronic medical records. In addition, none of them provided any tools for sending alert messages in any format.
Studies have shown the positive impact of mHealth on adherence-related behavior among patients. For example, short message service (SMS) appointment reminders have led to an increase in attendance of HIV (Bigna et al.,2014), tuberculosis (Liu et al.,2014), and quitting tobacco patients (Vilaplana et al.,2014a; Vilaplana et al.,2015). Patient-physician short messaging through a telemedicine system was also tested as a means to improve control of hypertension in the follow-up of medium-to-low-risk patients in primary care (Carrasco et al.,2008). A control group (CG) recorded the data on paper and could only deliver it to their GP personally in routine visits. This study showed that 50% of the telemedicine-enabled patients strictly adhered to the treatment protocol, versus 25% in the CG. This suggests that more flexible and continuous ways of interaction and follow up of patients might have a greater impact in treatment adherence.
A study among 107 mHealth articles assessed the role of adherence of patients to chronic diseases management (Hamine et al.,2015). 40.2% (43/107) of studies used SMS exclusively and 23.4% used specialized software or a smartphone app. These programs focused mainly on a combination of devices, such as an electrocardiogram or a BP monitor. As a conclusion, the authors suggested that future mHealth tools need to provide optimal user-interfaces, or targeted motivational messages.
Mobile Clinician Internet
Blood pressure
Pa5ent
database
Server 1
2
3
5
4
HM BP
BP
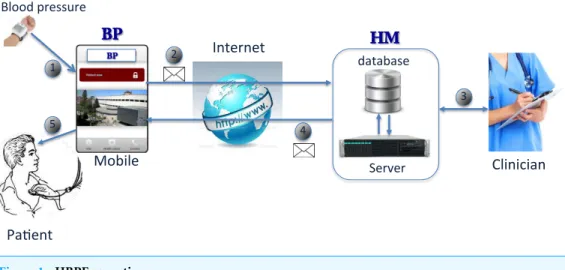
Figure 1 HBPF operation.
of the main features between the various apps). However, with the exception of BP, none of the apps features on-line physician support for the patient, chat between physician and patient, or broadcasting communication among a group of patients. In addition, BP is the only app available for both, iOS and Android operating systems.
HBPF provides a means to communicate across a wide range of platforms and
devices with a doctor, as does HealthTap. In addition, HBPF provides a complete,
efficient, and cross-platform framework to follow up hypertensive patients with an SLA guarantee. Furthermore, the transparent architecture of HBPF was designed to facilitate the involvement of additional third parties, and the integration with existing healthcare systems, while providing ad-hoc adaptation of monitoring parameters to each individual, in a similar way toBenharref & Serhani(2013).
HBPF
Figure 1summarizes the overall operation of HBPF. First of all, patients send their readings with the BP app from a smartphone to the server (1), via Internet (2).
On receiving a message, the server redirects it to the cloud-based HM. HM is responsible for checking and saving the readings in a database. Clinicians can inspect the patients’ readings from the database (3). Next, depending on the data and the criteria specified by the clinicians, HM responds to the patient’s mobile with another message through the server (4 and 5). HM also provides additional facilities to follow up hypertensive patients.
The main objective of the BP app is to extend the communication systems of the HM tool, adding the most widely used communication functionalities for smartphones. These include instant messaging (chat), among others. In this way, patients participate actively in controlling their disease and follow their medical evolution, communicating with the medical team in real time.
Hypertension Module (HM)
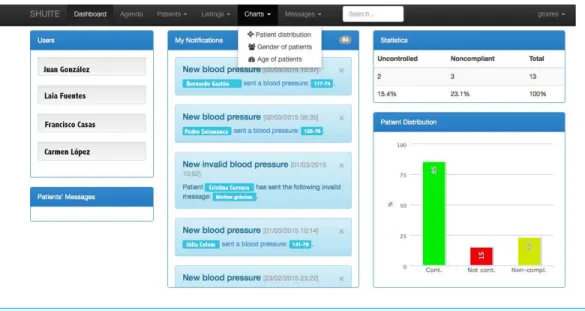
The Hypertension Module (HM) (see Fig. 2) was designed for collecting and managing
Figure 2 HM.The names that appear in the figure are invented.
statistics, show the evolution of patients graphically using charts, provide instant messaging tools (i.e., chat), aid clinicians with diagnose, and generate alerts or suggestions for treatment, patient monitoring, medication and nutrition, among others.
One of the main features of HM is that it plots patients’ readings (systole and diastole blood pressures and pulse). These readings can be registered automatically by means of the BP app or manually by the clinicians. HM automatically calculates the mean values for each day, showing an overall average value per day in the plot. HM performs a data verification check, in order to avoid incorrect or invalid measurements, such as negative or physically implausible values.
HM allows target limits from both systole and diastole blood pressures to be established individually depending on the characteristics of each patient. If these limits are exceeded, an alert is shown on the main page of the HM tool, so that clinicians can act quickly and, if needed, intervene or send an alert message to the patient.
HM is currently designed to communicate with the patients through an Internet connection (via smartphone with the BP app). This somewhat determines the design of the architecture, currently made up of a server and a database (see Fig. 1). In order to increase the reliability and availability of the overall system, the server can contain multiple processing units, like processors, cores, or Virtual Machines. As the current web servers are usually mounted on cloud systems, ‘‘VMs’’ is the terminology used from here on. An analysis of the performance provided by the server according to the number of VMs is performed in ‘Results’.
Apache Scheduleer
MySQL Cluster VM
VM
VM
VM
VM
VM
host 1
host 2
OpenStack OpenStack
Task Firewall
AJP
Figure 3 HM architecture.
According to the personalized monitoring plan of each patient, the system periodically reminds the patient to send their blood pressure readings. The system monitors that the data format and values it receives are appropriate, before recording them and sending a message to the BP app. The contents of the message depend on the information entered by the medical team and on the readings provided by the patients.
HM architecture
The cloud-based architecture of HM scales easily with increasing number of patients, physicians, and hospitals. This is done by using the SLA to adjust the number of available Virtual Machines (VMs, widely used in cloud computing environments) and the number of requests entering the module (seeMateo et al.,2014;Vilaplana et al.,2014b;Vilaplana et al.,2014c;Vilaplana et al.,2015for more information).
The current HM architecture is made up of 2 hosts (nodes), each with one AMD Opteron 6100 processor of 12 cores running at 2.1 GHz (seeFig. 3). We plan to add more hosts as the system grows. Note that nodes can be different, conforming a heterogeneous framework. All the software technologies used to implement HBPF were carefully selected with several criteria in mind. First, they had to be open-source, in order to facilitate future shared development of the apps. In addition, these technologies had to be robust, efficient, and be widely deployed and supported. VMs are deployed across the hosts on top of the OpenStack (http://www.openstack.org). OpenStack is an open source Cloud platform that allows to manage and deploy large networks of Virtual Machines. All the VMs run Ubuntu GNU/Linux 3.2.0-41-virtual x86_64. We believe in a distributed design because the degree of administrative and geographic scalability increases with the number of hosts.
The scheduler is mapped into a VM with 512 MB RAM and 1 core in host 1. It is
requesting tasks, are provided with 4 GB and 2 cores. These VMs are the computing VM nodes, where the HM module copies (each performing the same operation) are deployed on top ofApache Tomcat (http://tomcat.apache.org/), an open-source web server developed by the Apache Software Foundation (ASF).
Task scheduling determines which VM executes the tasks. VM consolidation instead determines the mapping of VMs to hosts. The HM task scheduling and VM consolidation follows a Round-robin policy, which states that tasks (VMs) are assigned to VMs (hosts) by following a circular ring ordering.
All VMs are configured with theAJP(Apache JServ Protocol—Apache Tomcat Connector) protocol enabled, which is used by the scheduler to communicate with the nodes. AJP is a protocol that can proxy inbound requests from a web server (Apache HTTP server) to an application server (Tomcat).
The database is implemented using aMySQL Cluster(https://www.mysql.com/products/
cluster/), a technology that provides shared-nothing clustering and auto-sharding for the MySQL database management system. The database is distributed between the hosts
(nodes) making up the cloud framework. TheMySQL Clusteris implemented with 2 VMs
with 4 GB RAM and 2 cores (of two different hosts). Having multiple computing and data-sites ensures a high degree of load and administrative scalability and reliability.
BP
BP is designed to update and expand the current system of communication with the HM tool, offering an application that was not previously available for smartphones. BP is a user-friendly app that extends the HM services to Android and iOS smartphones.
BP design
Currently, there are many alternative technologies for developing applications for mobile devices. An important design requirement was that the application should be compatible with all the major platforms Android and iOS. Because of this, the BP app was implemented
using HTML, CSS, Javascript, JQuery Mobile and PhoneGap (http://phonegap.com).
PhoneGap is an open-source development tool for creating cross-platform mobile applications with countless libraries available for use. PhoneGap has APIs to control I/O devices efficiently (such as cameras, GPS, databases, file system, etc.) in a similar way to those obtained with native code. Phonegap currently supports the two mainstream platforms (Android and iOS).
BP operation
The BP app can be used to register patients, edit their profile, download or upload data regarding blood pressure and pulse readings from/to the HM server, visualize informative videos uploaded by the clinicians, analyze patient trends by plotting and listing the evolution of the patients’ state and readings, and provide information about collaborating hospitals. Finally, BP can be used for chatting (instant messaging) between patients and clinicians. Whenever required, a patient can easily ask the doctor a question through the chat window.
The application also helps the patients with useful advice. Once the blood pressures and the pulse have been sent, the app immediately shows the results of the analysis (done in HM) through a traffic light indicating the status of the patient. In addition, a short message indicates medical advice. The medical advice depends on the results of the analysis of the readings.
There are three possible states (light colors) and three associated messages:
Good (green).Everything was fine. Remember to keep measuring and sending your
pressure readings.
Regular (yellow).Do not forget, salt-free diet. Remember to take the medication and
do some physical activity.
Bad (red).We have seen your records, do not worry. We will contact you to bring your
next clinical appointment forward.
BP can show a graphic evolution of the patients’ measurements. Different types of visualization can be chosen. By clicking global, the plot of the blood pressure (Fig. 4) appears. Themorning andafternoonbuttons separate the samples by these times of day. Start and finish dates can be selected. Alternatively, 1, 3 and 6 months selectors are available.
RESULTS
Here we report a series of benchmark experiments used to evaluate the performance and efficiency of HBPF. We benchmark HM and the BP app separately and present the results in ‘HM’ and ‘BP’ respectively.
The main performance criteria by which the HM server and the BP app should be evaluated are only partially overlapping. Because of this, we separately evaluated the server and the app. For the HM server, we evaluated response time, throughput, and scalability. For the BP app, we evaluated startup time, communication time and usability.
HM Testbed
Experiments on the HM tool were carried out on five Virtual Machines [VM1. . .VM5]
deployed over OpenStack, installed on a host with 1 AMD Opteron processor with 12 cores
running at 2.1 GHz each. To emulate VM heterogeneity, we set VM1. . .VM5 with 4 GB
RAM and 2 cores.
Figure 4 Consultation readings for blood pressure.
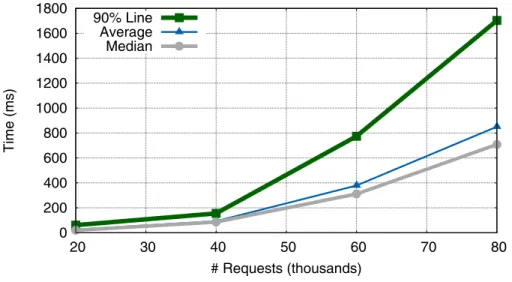
The effect of number of simultaneous requests on HBPF performance was tested by systematically varying the number of users. There were generated 100 requests per user. All users would be performing their requests within a single 50 s period. The time between user requests was constant and therefore these requests were uniformly distributed in the 50 s test interval.
The performance metric we used was the Response Time and Throughput, as these parameters are widely used for measuring system efficiency. Throughput was also the parameter chosen to fix the SLA.
Response time
Testing the response time of the application was done using all five available VMs.
0 200 400 600 800 1000 1200 1400 1600 1800
20 30 40 50 60 70 80
Time (ms)
# Requests (thousands) 90% Line
Average Median
Figure 5 Evolution of response time (average, median and 90% Line).
0 100 200 300 400 500 600 700 800 900
0 10 20 30 40 50 60 70 80
Throughput
# Requests (thousands) 5 VM
3 VM 1 VM
Figure 6 Evolution of system throughput when using 1, 3 and 5 VMs.
Throughput
Another measure of efficiency is throughput (TR), which is defined as the number of requests served per unit of time:
TR=number of requests
time . (1)
Here, we benchmark the effect of changing the number of available VMs on the TR and
the number of users from 50 to 800.Figure 6compares the TR of the system when we
use one (VM1), three (VM1–VM3), or five VMs (VM1–VM5).Figure 6summarizes the
results.
threshold, TR performance decreases slightly and the SLA is not guaranteed. We note that the SLA should be fixed according to the required TR, depending on the number of requests and the number of VMs available. This behaviour is consistent with previous simulations of a similar model system, using an approach based on queuing theory (Vilaplana et al.,
2013;Vilaplana et al.,2014b).
Going from one to three VMs leads to an increase in peak TR of 28.5%. In contrast, going from three to five VMs leads to an increase in peak TR of approximately 16.8%. This suggests that peak relative performance increment decreases every time additional VMs are activated. Internal tests suggest that this loss was due to the delay introduced by the remote communication between VMs located in different cores, which is a known frequent bottleneck in distributed computing applications.
Thus, as was the case in the simulated system (Vilaplana et al.,2013;Vilaplana et al.,
2014b), we face a situation where our system overloads, leading to a significant increase in the response time and a decrease in TR. However, in contrast with the simulated system, adding more VMs to the real HBPF system only partially solves the problem, and a law of diminishing returns is observed with an increase in number of VMs. Overall, these experiments suggests that the most efficient strategy for distributing work between VMs allocated to HBPF is to first deploy work to local VMs. When these are saturated, work should then be sent to remote VMs.
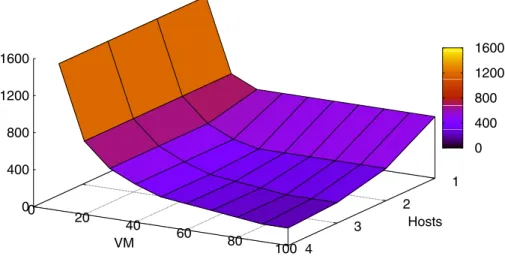
Scalability
We also investigated the scalability of the system in its cloud environment by using an event-driven simulator to test the behaviour of that environment. We use the CloudSim 3.0.2 software (Calheiros et al.,2011) in these tests because it allowed us to easily emulate the HBPF architecture presented and evaluated in ‘HM architecture’ and ‘HM’ respectively. CloudSim allows the behaviour of the AMD Opteron 6,100 (the one chosen for this simulation) to be emulated. The CloudSim task scheduling and VM consolidation followed a Round-robin policy. As we chose the same processor and scheduling policies as the HM architecture (see ‘HM architecture’), the results obtained in the simulation should be directly applicable to the real system.
Figure 7shows the system behavior when scaling it by increasing the number of VMs and hosts. VMs were made up of 2 cores and 4 GB each. As in ‘HM’, one host was made up of one processor. The simulation environment was carried out by executing 1,000 tasks with a size of 100,000 instructions each. Further experiments varying these parameters gave proportional results.
1
2
3
4 0
20
40
60
80
100 0
400 800 1200 1600
Hosts
VM
0 400 800 1200 1600
Figure 7 Execution times depending on the number of VMs and the number of hosts.
Table 2 Performance comparison between devices (in ms).
Device Operating system BP start up time
Samsung Galaxy S2 Android v. 4.2.2 10.583
Samsung Galaxy S3 Android v. 4.3 10.121
Nexus 5 Android v. 5.1.1 9.638
Ipad 2 iOS v. 8.4 10.346
Iphone 6 iOS v. 8.4 9.949
BP
Performance
Typically, two important bottlenecks in application performance are the start up of the app and the operational processes in which that app accesses Internet.
BP was installed and tested on smartphones and tablets running modern versions of Android and iOS. The devices and operating systems used to verify the correct operation of BP are listed inTable 2. This table shows the elapsed time of the start up for BP. These times were the average of three independent measurements.
The cross-reference APIs used by PhoneGap introduced a considerable penalisation in the BP start up time (10 ms). However, the application performed well in all the tested devices. In all cases, overall response time fell below one second, which guarantees that the user’s flow of thought is uninterrupted (Miller,1968).
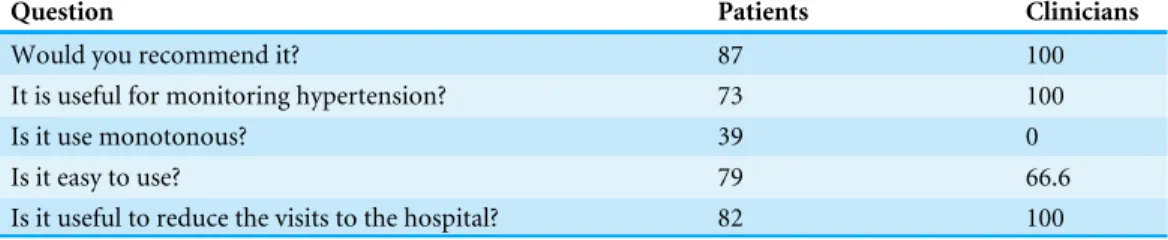
Table 3 Evaluating the use of BP.Affirmative answers (in %).
Question Patients Clinicians
Would you recommend it? 87 100
It is useful for monitoring hypertension? 73 100
Is it use monotonous? 39 0
Is it easy to use? 79 66.6
Is it useful to reduce the visits to the hospital? 82 100
Usability
Here we perform a preliminary evaluation of BP’s usability. This was done by asking both, clinicians and patients, to fill in a Google-forms questionnaire. This questionnaire was sent by the HM server to all 90 registered patients and the three clinicians of the Clinic hospital of Barcelona. 38 patients and all the clinicians answered it.Table 3summarizes the results of this evaluation. This table only shows the affirmative answers.
Clinicians are highly satisfied with the app and all are convinced of its usefulness and efficiency. In addition, they don’t find its use monotonous. In addition, two of the three clinicians found BP very easy to use. We note that these evaluations are anecdotal and a larger number of clinicians must answer the survey before we can come to a reasonable conclusion about usability of BP from the clinician’s point of view. In terms of user evaluation, we focus more on the feedback from patients than that from clinicians for two reasons. First, patients will be the vast majority of final BP users. Second, we need to obtain input from additional clinicians, given the low number of professionals that answered the survey. Between 54% and 87% of all patients reported full satisfaction with the various aspects of using the BP app, indicating that they are mostly happy with the application. The weakest point we detected was that 39% of the patients found the use of BP monotonous. This is in striking difference with the clinicians that had the opposite opinion. We need to further and specifically understand what the patients found boring in order to improve that aspect of the app.
In general, clinicians and patients recognized the usefulness of the app for remote monitoring of hypertensive patients and to reduce traveling costs. We note that we are now in the process of compiling patient and clinician suggestions to help us improve the user-friendliness of the app.
CONCLUSIONS
This article presents HBPF, an efficient eHealth framework to manage and follow up hypertensive patients. HBPF comes with SLA guarantees and it can significantly reduce the costs associated with patient travelling. Its efficiency and SLA guarantees are provided by HM, the HBPF server component.
systems on both smartphones and tablets. Despite the difficulties of adapting the interface in some cases, the results achieved were satisfactory.
However, the user experience could possibly be improved by using native development due to the fact that PhoneGap has a slightly higher response time than native applications. Accordingly, we are migrating the current application to native environments for iOS and Android platforms. We expect to improve this aspect, which we assume will be temporary. We will then compare the performance of PhoneGap against native frameworks.
Future trends are aimed at testing how the use of this comprehensive and personalized monitoring tool can minimize the risk of heart attacks, strokes and other effects of hypertension. We plan to add a wireless or bluetooth interface to the sampling device without requiring the patient to manually submit the data, thus facilitating automatic data transfer and avoiding transcription errors. Moreover, we plan to implement data analytics so we can provide aggregated data to the clinicians in order to detect trends and patterns within their patient groups.
ADDITIONAL INFORMATION AND DECLARATIONS
Funding
This work was supported by the Ministerio de Enonomia y Competitividad under contracts TIN2011-28689-C02-02, TIN2014-53234-C2-2-R and BFU2010-17704. The authors are members of the research groups 2014-SGR163 and 2014-SGR243, funded by the Generalitat de Catalunya. The funders had no role in study design, data collection and analysis, decision to publish, or preparation of the manuscript.
Grant Disclosures
The following grant information was disclosed by the authors:
Ministerio de Enonomia y Competitividad: TIN2011-28689-C02-02, TIN2014-53234-C2-2-R, BFU2010-17704.
Generalitat de Catalunya: 2014-SGR163, 2014-SGR243.
Competing Interests
The authors declare there are no competing interests.
Josep Cuadrado, Francesc Solsona, and Sara Solsona are employees of Hesoft Group, Lleida.
Author Contributions
• Josep Cuadrado conceived and designed the experiments, performed the experiments,
wrote the paper, prepared figures and/or tables, performed the computation work.
• Jordi Vilaplana performed the experiments, prepared figures and/or tables, performed the computation work.
• Jordi Mateo analyzed the data, prepared figures and/or tables, performed the
computation work.
• Francesc Solsona conceived and designed the experiments, wrote the paper, prepared
• Sara Solsona analyzed the data, reviewed drafts of the paper.
• Josep Rius and Rui Alves contributed reagents/materials/analysis tools, reviewed drafts of the paper.
• Miguel Camafort analyzed the data, contributed reagents/materials/analysis tools.
Data Availability
The following information was supplied regarding data availability: The research in this article did not generate any raw data.
REFERENCES
Abbas A, Khan SU. 2014.A review on the state-of-the-art privacy-preservingapproaches
in the e-health clouds.Journal of Biomedical and Health Informatics18(4):1431–1441
DOI 10.1109/JBHI.2014.2300846.
Aguado A, Lopez F, Miravet S, Oriol P, Fuentes MI, Henares B, Badia T, Esteve L,
Peligro J. 2009.Hypertension in the very old; prevalence, awareness, treatment and
control: a cross-sectional population-based study in a Spanish municipality.BMC Geriatrics9:16DOI 10.1186/1471-2318-9-16.
Benharref A, Serhani MA. 2013.Novel cloud and SOA-Based framework for E-health
monitoring using wireless biosensors.Biomedical and Health Informatics, IEEE Journal of 18(1):46–55DOI 10.1109/JBHI.2013.2262659.
Bigna JJR, Noubiap JJN, Kouanfack C, Plottel CS, Koulla-Shiro S. 2014.Effect of
mobile phone reminders on follow-up medical care of children exposed to or infected with HIV in Cameroon (MORE CARE): a multicentre, single-blind, factorial, randomised controlled trial.The Lancet Infectious Diseases14(7):600–608
DOI 10.1016/S1473-3099(14)70741-8.
Bobrie G, Chatellier G, Genes N, Clerson P, Vaur L, Vaisse B, Menard J, Mallion JM.
2004.Cardiovascular prognosis of masked hypertension detected by blood pressure
self-measurement in elderly treated hypertensive patients.JAMA291(11):1342–1349
DOI 10.1001/jama.291.11.1342.
Calheiros R, Ranjan R, Beloglazov A, De Rose C, Buyya R. 2011.CloudSim: a toolkit
for modeling and simulation of cloud computing environments and evaluation of resource provisioning algorithms.Software: Practice and Experience41(1):23–50.
Carrasco MP, Salvador CH, Sagredo PG, Márquez-Montes J, González de Mingo MA, Fragua JA, Rodríguez MC, García-Olmos LM, Garcia-López F, Carrero AM,
Monteagudo JL. 2008.Impact of patient-general practitioner short-messages-based
interaction on the control of hypertension in a follow-up service for low-to-medium risk hypertensive patients: a randomized controlled trial.IEEE Transactions on Infor-mation Technology in Biomedicine12(6):780–791DOI 10.1109/TITB.2008.926429.
Craig R, Mindell J (eds.) 2006.Health survey for England 2006. London: Her Majesty’s
Stationery Office.
Green BB, Cook AJ, Ralston JD, Fishman PA, Catz SL, Carlson J, Carrell D, Tyll L,
web communication, and pharmacist care on hypertension control: a randomized controlled trial.JAMA299(24):2857–2867DOI 10.1001/jama.299.24.2857.
Hamine S, Gerth-Guyette E, Faulx D, Green BB, Ginsburg AS. 2015.Impact of
mHealth chronic disease management on treatment adherence and patient outcomes: a systematic review.Journal of Medical Internet Research17(2):e52
DOI 10.2196/jmir.3951.
Lai CC, Lee RG, Hsiao CC, Liu HS, Chen C. 2009.A H-QoS-demand personalized home
physiological monitoring system over a wireless multi-hop relay network for mobile home healthcare.Journal of Network and Computer Applications32(6):1229–1241
DOI 10.1016/j.jnca.2009.05.007.
Liu Q, Abba K, Alejandria MM, Sinclair D, Balanag VM, Lansang MA. 2014.Reminder
systems to improve patient adherence to tuberculosis clinic appointments for diag-nosis and treatment.The Cochrane Database of Systematic Reviews18(11):CD006594.
Mateo J, Vilaplana J, Pla LM, Lerida JL, Solsona F. 2014.A green strategy for federated
and heterogeneous clouds with communicating workloads.The Scientific World
Journal 2014:1–11DOI 10.1155/2014/273537.
McManus RJ, Mant J, Bray EP, Holder R, Jones MI, Greenfield S, Kaambwa B, Banting
M, Bryan S, Little P, Williams B, Hobbs FD. 2010.Tele-monitoring and
self-management in the control of hypertension (TASMINH2): a randomised controlled
trial.The Lancet376(9736):163–172DOI 10.1016/S0140-6736(10)60964-6.
Miller RB. 1968.Response time in man-computer conversational transactions.
Proceed-ings of AFIPS Fall Joint Computer Conference33:267–277.
Ohkubo T, Imai Y, Tsuji I, Nagai K, Kato J, Kikuchi N, Nishiyama A, Aihara A,
Sekino M, Kikuya M, Ito S, Satoh H, Hisamichi S. 1998.Home blood pressure
measurement has a stronger predictive power for mortality than does screening blood pressure measurement: a population-based observation in Ohasama, Japan.
Journal of Hypertension16(7):971–975DOI 10.1097/00004872-199816070-00010.
Patel B, Turban S, Anderson C, Charleston J, Miller E, Appel L. 2010.A comparison
of web sites used to manage and present home blood pressure readings.Journal of Clinical Hypertension6:389–395DOI 10.1111/j.1751-7176.2010.00277.x.
Pickering TG, Miller NH, Ogedegbe G, Krakoff LR, Artinian NT, Goff D, American Heart Association, American Society of Hypertension, Preventive
Cardio-vascular Nurses Association. 2008.Call to action on use and reimbursement
for home blood pressure monitoring: a joint scientific statement from the American Heart Association, American Society of Hypertension, and Preventive Cardiovascular Nurses Association.Journal of Cardiovascular Nursing 23(4):299–323
DOI 10.1097/01.JCN.0000317429.98844.04.
Vilaplana J, Solsona F, Abella F, Cuadrado J, Alves R, Mateo J. 2014a.S-PC: an
e-treatment application for management of smoke-quitting patients.Computer
Methods and Programs in Biomedicine115(1):33–45
Vilaplana J, Solsona F, Abella F, Cuadrado J, Teixidó I, Mateo J, Rius J. 2015.H-PC: a cloud computing tool for supervising hypertensive patients.The Journal of Supercomputing71(2):591–612DOI 10.1007/s11227-014-1312-9.
Vilaplana J, Solsona F, Abella F, Filgueira R, Rius J. 2013.The cloud paradigm applied
to e-Health.BMC Medical Informatics and Decision Making 13(35):1–10
DOI 10.1186/1472-6947-13-1.
Vilaplana J, Solsona F, Mateo J, Teixido I. 2014c.SLA-aware load balancing in a
web-based cloud system over openstack.Lecture Notes in Computer Science
8377:281–293DOI 10.1007/978-3-319-06859-6_26.
Vilaplana J, Solsona F, Teixidó I, Mateo J, Abella F, Rius J. 2014b.A queuing
theory model for cloud computing.Journal of Supercomputing 6(1):492–507
DOI 10.1007/s11227-014-1177-y.
World Health Organisation. 2011.Second Global survey on eHealth (Global observatory