Pulse Pressure Measured by Home Blood Pressure Monitoring and
its Correlation to Left Ventricular Mass Index
André De Marco, Audes Magalhães Feitosa, Marco Mota Gomes, Giordano Bruno Parente, Edgar Guimarães Victor
Real Hospital Português de Beneficência em Pernambuco – RealCor e Universidade Federal de Pernambuco - Recife, PE, BrazilObjective: Measure the systolic (SP), diastolic (DP) and pulse pressure (PP) using home blood pressure monitoring (HBPM) and correlate their values with the left ventricular mass index (LVMI)
Methods: In 2004, 127 individuals underwent HBPM in a private clinic. A total of 83 of these individuals had also undergone an echocardiographic study within a period shorter than 6 months. After excluding those with dilated or ischemic cardiomyopathy and those with mitral or aortic valvopathies, 72 patients were evaluated for the correlation between SP, DP and PP (SP minus DP) and the LVMI.
Results: The group´s mean age was 51.9±17.3 years and males represented 43% of the sample. The mean body mass index (BMI) was 28.6±6 Kg/m2 and 53% of the patients were using antihypertensive drugs. The PS and PP correlated positively to the LVMI (r = 0.356; p=0.002 and r=0.429; p<0.001, respectively). There was no correlation between DP and LVMI.
Conclusion: The PS and the PP correlate positively to the LVMI.
Key words: Home blood pressure monitoring, pulse pressure, left ventricular mass index, hypertrophy.
Mailing Address: Edgar Guimarães Victor •
Cardiovascular diseases (CVD) are an important public health problem in modern societies1. One of its main risk factors, systemic arterial hypertension (SAH), which has elevated prevalence2,3, is associated to great morbi-mortality4 and high costs of treatment and rehabilitation of its complications5.
After the publication of the Systolic Hypertension in Elderly Program6 (SHEP) study in 1991, the systolic arterial pressure (SAP) started to be extensively studied as the determinant of CVD, until then mainly attributed to the diastolic arterial pressure (DAP)7.
Recently, the concept that arterial pressure is not a static factor originated a new division of its components into stable and pulsatile, represented respectively by the mean arterial pressure and the pulse pressure (PP)8. The pulsatile component has been associated to structural and functional changes in the medial arterial layer, which results in arterial compliance and elevation of the pulse pressure.
Elevated PP levels were associated to an increased cardiovascular mortality9, aorta and carotid atherosclerosis10 and also of the coronary arteries11, re-infarction in patients with depressed systolic fucntion12 and re-stenosis after coronary intervention13. Finally, a study demonstrated that an elevated
PP implicated in an increment of mortality in a group of normotensive males8.
Another study, based on the ambulatory monitoring of 24-hour arterial pressure, showed that hypertensive individuals with a normal nocturnal dip and PP < 53mmHg presented an intermediate cardiovascular risk, whereas those who did not present nocturnal dip or had PP > 53 mmHg were categorized as having elevated cardiovascular risk14.
One of the consequences of SAH, the left ventricular hypertrophy (LVH)15, is well established as an independent risk factor for cardiovascular morbi-mortality16,17. The increase in the left ventricle mass has been previously correlated with PP18, but not with the use of Home Blood Pressure Monitoring (HBPM) for its measurement.
The objective of this study is to measure SAP, DAP, and PP by home blood pressure monitoring (HBPM) and correlate their values with those of the left ventricular mass index (LVMI).
Methods
recorded.
The data were plotted into an Excel 2002® spreadsheet, and values were double typed and compared in order to avoid errors when inserting information.
Based on the registered data, the body mass index (BMI) and the body surface area (BSA) using the Dubois & Dubois formula22 were calculated, as well as the LV ejection fraction calculated by the cube formula when its diameter, normalized for the body surface, was normal and by the Teichholz formula, when it was increased. The LV was considered abnormal when the ratio between its diastolic diameter and the patient’s BSA
ZDVPPP2. The LV mass was calculated according to the Penn’s convention with the corrections by Devereux and Reichek23. The LVMI was calculated by the LV mass: BSA ratio. PP was calculated by the difference between the SAP and DAP means.
The non-parametric binomial test was used in order to verify the isolated non-randomization of dichotomic variables. The Chi-square test was used to compare categorical variables between groups. To compare the means between the two groups, students’ ttest was used for normal samples and the Mann-Whitney score was used for non-normal samples. To compare means between more than 2 groups, Analysis of Variance (ANOVA) was used. Pearson’s coefficient was used to verify the correlation between continuous variables. In order to identify predictive equations among the dependent and independent variables, the multiple linear regression was applied from the variables suggested as significant by the step-by-step regression analysis.
Results
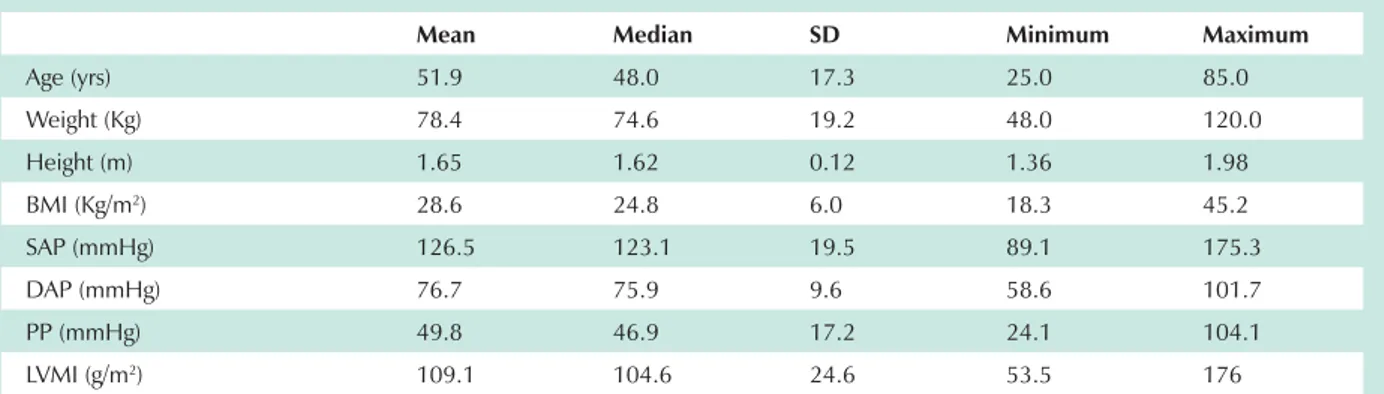
When analyzing the 127 HBPM evaluations performed during the study period, 83 patients were identified as meeting the inclusion criteria. Of these, 5 were excluded due to the valvopathies, 3 due to segmental deficits and 3 due to EF below the normal reference values, with 72 patients left for the analysis. Table I shows the main characteristics of the analyzed group. Age varied from 25 to 85 years, the mean age was 51.9 ± 17.3 yrs and half of the group was younger than 48 yrs. Table II shows the comparison of the study variables Real Hospital Português de Beneficência in the city of Recife,
state of Pernambuco, Brazil, where the database regarding HBPM examinations performed in the year 2004, totaling 127 tests, was analyzed.
Patients included in this study were older than 18 years who underwent HBPM and echocardiogram with an interval < 6 months between examinations.
Patients excluded were those who presented mitral or aortic valvopathies (when presenting moderate to severe degrees), segmental left ventricular (LV) dysfunction at the echocardiogram (except when described as slight or mild)
RU /9 JOREDO V\VWROLF IXQFWLRQ ZKHQ FDOFXODWHG E\
the cube formula or 55% when calculated by Teichholz formula.
In this study, the patients considered hypertensive were those using anti-hypertensive drugs and/or those presenting abnormal results at the HBPM (SAP >135mmHg and/or DAP >85 mmHg)19. LVH was defined as LVMI >134 g/m2 for males and >110 g/m2 for females20.
The HBPM examinations were carried out in MicroLife BP3AC1 or OMRON HEM-705CP equipment, which are both automatic and validated by the British Hypertension Society protocol21.
The patients were advised regarding the correct examination procedures as previously established19. The utilized evaluation protocol consisted in performing two series of three measurements each, one in the morning and another at night, for three consecutive days. At the final calculation of the SAP and DAP means, the first-day measurements were disregarded, in order to reduce the influence of the alarm reaction. Data such as identification, weight and height, use or not of anti-hypertensive drugs and SAP and DAP means were recorded.
The echocardiograms were carried out in General Electrics, GE System Five and GE Vivid Five equipment and the measurements were performed measurements in M-mode or bidimensional mode. The systolic and diastolic diameters of the LV and the measurements of the LV septum and posterior wall were recorded, and finally, the presence of structural and wall mobility defects and cardiac valve defects were also
Mean Median SD Minimum Maximum
Age (yrs) 51.9 48.0 17.3 25.0 85.0
Weight (Kg) 78.4 74.6 19.2 48.0 120.0
Height (m) 1.65 1.62 0.12 1.36 1.98
BMI (Kg/m2) 28.6 24.8 6.0 18.3 45.2
SAP (mmHg) 126.5 123.1 19.5 89.1 175.3
DAP (mmHg) 76.7 75.9 9.6 58.6 101.7
PP (mmHg) 49.8 46.9 17.2 24.1 104.1
LVMI (g/m2) 109.1 104.6 24.6 53.5 176
BMI – body mass index; SAP – systolic arterial pressure; DAP – diastolic arterial pressure; PP – pulse pressure; LVMI – left ventricular mass index; HBPM – home blood pressure monitoring; SD – standard deviation.
between the genders. The female gender corresponded to 57% of the sample. The distribution of obesity between the genders was homogeneous.
The linear regression analysis showed a positive correlation between age and SAP (p<0.001, r=0.510) and PP (p<0.001, r=0.691). There was no correlation between age and DAP (p=0.085), as well as no correlation between BMI and SAP, DAP or PP means.
There was no difference between genders regarding the LVMI (p=0.285). In addition, there was no correlation between LVMI and BMI (p=0.189). There was a strong correlation between LVMI and age (p=0.001).
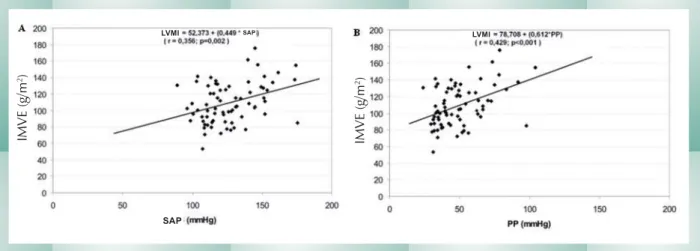
Chart 1 shows the correlations between LVMI with SAP and PP, both significant (p=0.002, r=0.356 and p<0.001, r=0.429 respectively). There was no correlation between LVMI and DAP (p=0.702).
Patients with SAH presented the highest prevalence of LVH (p=0.02). Considering only the hypertensive patients and categorizing them as low PP (PP<53 mmHg) or elevated PP (PP>53 mmHg), a significant difference regarding LVMI was observed, 103.7 ± 24.7 g/m2 and 124.1 ± 26.9 g/m2 (p=0,011), respectively.
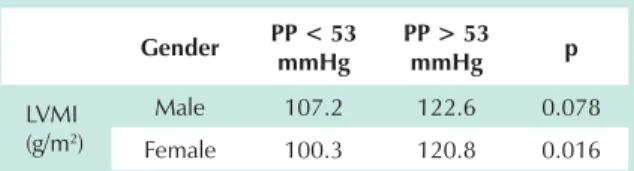
Table III compares the LVMI of patients with low PP with that of patients with elevated PP in each gender, considering normotensive as well as hypertensive individuals.
Discussion
The main finding of the present study consists in the presence of a positive correlation between LVMI and PP evaluated by HBPM.
The existing correlation between LVMI and SAP, DAP and mean arterial pressure had been previously evaluated by other authors by 24-h ambulatory blood pressure monitoring or HBPM and compared with LVMI24. There have also been reports of PP evaluation measured by conventional methods or by 24-h ambulatory blood pressure monitoring and its correlation with LVMI18,24-26. The present study also evaluates this correlation between LVMI and PP, but differently from the others, it performs PP measurement through HBPM.
As observed in Chart 1, PP has a closer correlation with LVMI than SAP, with Pearson’s coefficients of r=0.356 and p=0.002 for SAP and r=0.429 and p<0.001 for PP. However,
Variable Male Female p
Patients (n) 31 41 0.289 Age (yrs) 48.4 54.7 0.041 BMI (Kg/m2) 28.9 28.4 0.185
Anti-hypertensive drug use (%)
10 (32.2) 28 (68.3) 0.005
SAP (mmHg) 127.2 125.9 0.781 DAP (mmHg) 78.6 75.4 0.163 PP (mmHg) 48.6 50.5 0.670 LVMI (g/m2) 112.2 106.8 0.285
SAH (%) 15 (48.4) 31 (75.6) 0.033 LVH (%) 8 (25.8) 17 (41.5) 0.258
BMI – body mass index; SAP – systolic arterial pressure; DAP – diastolic arterial pressure; PP – pulse pressure; LVMI – left ventricular mass index; SAH – systemic arterial hypertension; LVH – left ventricular hypertrophy; HBPM – home blood pressure monitoring.
Table 2 - Comparison between genders of number of patients, BMI, use of anti-hypertensive drugs, SAP, DAP, PP, SAH and LVH, in 72 patients submitted to HBPM and echocardiogram in 2004
(Recife-PE)
The 72 patients analyzed were successful in acquiring 100% of the arterial pressure measurements by HBPM. There was no significant difference between the genders regarding SAP (p=0.78), DAP (p=0.16) or PP means (p=0.67). According to the diagnostic criteria for SAH defined for this study, 63.9% of the patients were considered hypertensive, but it was not possible to determine the time of disease duration.
When stratified by gender, the prevalence of SAH was 75% in females and 48.4% in males (p=0.033). The frequency of anti-hypertensive drug use among hypertensive patients was similar in both genders (p=0.095).
Chart 1 - A: correlation between LVMI and SAP. B: correlation between LVMI and PP. Cohort of 72 patients submitted to HBPM and echocardiogram in 2004 (Recife-PE, Brazil).
LVMI LVMI
SAP
SAP
IMV
E
(g/
m
2)
IMV
E
(g/
m
no correlation between LVMI and DAP was observed, which is in disagreement with a previous study that found a significant correlation of LVMI with SAP and DAP using HBPM27. This study did not assess the correlation with PP.
When evaluating 304 patients by 24-h ambulatory blood pressure monitoring, Mule et al demonstrated, in a multivariate analysis, the existence of a correlation between the 24-hr blood pressure mean and the LVMI in patients older than 50 years, whereas younger patients only showed a correlation between LVMI and the mean arterial pressure24. Despite this fact, in a multiple regression model, there was no correlation between PP and LVMI when the effects of SAP were considered.
The two aforementioned studies evaluated hypertensive patients only. In the present study, when assessing hypertensive patients only, the linear regression analysis displays results that are similar to the analysis of the total group, with statistical significance regarding the correlation between the LVMI and SAP (p=0.009) and between LVMI and PP (p<0.001) and again, showing no correlation between LVMI and DAP (p=0.66).
In this study, the most significant associations with LVMI were those with age and systolic and pulse pressure, with the latter being the strongest one. When performing a multiple linear regression analysis between LVMI, age and PP, age becomes an expendable variable when constructing the equation that estimates LVMI, with p=0.039. The same is not true when the same analysis between LVMI, age and SAP is performed; in this case, SAP is the expendable variable. This fact is probably due to the parallel development between age and SAP. On the other hand, the data analyzed in the present study also show a concurrence of PP and age values. Thus, other factors must justify the strong and independent PP correlation with LVMI. Reinforcing this association, in a step-by-step multiple regression analysis, when the correlation between LVMI, age, Sap and PP was tested, the isolate use
of PP is able to estimate the LVMI without the need to add other variables to the equation.
Despite the strong association between LVMI and PP demonstrated in out results, it is noteworthy the point dispersion depicted in the Chart, represented by r=0.429. This can be explained by the multifactorial trait of LVH, as several other factors are known to influence its value (obesity, pressure response to daily activities, daily salt intake, blood viscosity, volemia, and genetic factors, among others16).
It is relevant the use of HBPM to measure the arterial pressure of patients, by standardizing the measurement procedures and broadly preventing the several measurement error sources. There is a stronger correlation between LVMI and arterial pressure measurements obtained at the HBPM when compared to those obtained at the office27.
A remarkable finding in the present study is demonstrated in Table III, where the patients are grouped by the presence of low (<53 mmHg) or elevated PP (>53 mmHg)14 and by gender, with the LVMI means being depicted for each group. It is known that the LVMI is higher in men than in women23. This was not observed in our sample, which can be due to a higher frequency of SAH in the female gender subgroup. Apart from that, the LVMI means were significantly different between female patients with low and elevated PP in this subgroup. Additionally, the means obtained define normal ventricular mass in female patients with low PP and abnormal (elevated) ventricular mass in the female patients with elevated PP, establishing the diagnosis of LVH in the latter. This information can have a prognostic value, as the existence of a strong association between LVH and cardiovascular morbi-mortality is known16,17.
This study was carried out retrospectively, which does not allow us to infer a causal relation between PP and the increase of the left ventricular mass. Additionally, the small sample size as in previous studies might have influenced the lack of significance of some correlations. Moreover, the inclusion criteria included two examinations within a period < 6 months, in an attempt to optimize the series. This can imply in variations of the echocardiogram measurements between the two examinations, especially if one takes into account the large number of hypertensive individuals using anti-hypertensive drugs. On the other hand, 84.7% of the patients included in the study underwent the examinations within a 7-day interval.
The present study allows us to conclude that the LVMI increases concomitantly with SAP and PP increments, and that this correlation is more significant with PP, justifying the need for controlled and prospective studies, in order to establish the role of PP in LVH determination.
Gender PP < 53 mmHg
PP > 53
mmHg p
LVMI (g/m2)
Male 107.2 122.6 0.078 Female 100.3 120.8 0.016
LVMI – left ventricular mass index; PP – pulse pressure; HBPM – home blood pressure monitoring.
Table 3 - Differences in the LVMI between individuals with low and elevated PP, in 31 males and 41 females, submitted to HBPM and
References
1. Da Silva MA, Sousa AG, Schargodsky H. Risk factors for acute myocardial infarction in Brazil. FRICAS Study. Arq Bras Cardiol 1998; 71(5): 667-75.
2. III Consenso Brasileiro de Hipertensão Arterial. In: SBdC, Sociedade Brasileira de Hipertensão, Sociedade Brasileira de Nefrologia. Editora BG Cultural; 1998.
3. Burt VL, Cutler JA, Higgins M, et al. Trends in the prevalence, awareness, treatment, and control of hypertension in the adult US population. Data from the health examination surveys, 1960 to 1991. Hypertension 1995; 26(1): 60-9.
4. The sixth report of the Joint National Committee on prevention, detection, evaluation, and treatment of high blood pressure. Arch Intern Med 1997; 157(21): 2413-46.
5. Kaplan NM. Hypertensive and Atherosclerotic Cardiovascular Disease. In: Braunwald E, Zipes DP, Libby P (ed.) Heart Disease: A textbook of cardiovascular medicine. 6th ed. Philadelphia: W. B. Saunders Company; 2001: 941-71.
6. SHEP Cooperative Research Group. Prevention of stroke by antihypertensive drug treatment in older persons with isolated systolic hypertension. Final results of the Systolic Hypertension in the Elderly Program (SHEP). JAMA 1991; 265(24): 3255-64.
7. Collins R, Peto R, MacMahon S, et al. Blood pressure, stroke, and coronary heart disease. Part 2, Short-term reductions in blood pressure: overview of randomised drug trials in their epidemiological context. Lancet 1990; 335(8693): 827-38.
8. Benetos A, Rudnichi A, Safar M, Guize L. Pulse pressure and cardiovascular mortality in normotensive and hypertensive subjects. Hypertension 1998; 32(3): 560-4.
9. Benetos A, Safar M, Rudnichi A, et al. Pulse pressure: a predictor of long-term cardiovascular mortality in a French male population. Hypertension 1997; 30(6): 1410-5.
10. van Popele NM, Grobbee DE, Bots ML, et al. Association between arterial stiffness and atherosclerosis: the Rotterdam Study. Stroke 2001; 32(2): 454-60.
11. Nair GV, Waters D, Rogers W, Kowalchuk GJ, Stuckey TD, Herrington DM. Pulse Pressure and Coronary Atherosclerosis Progression in Postmenopausal Women. Hypertension 2004; 11-5.
12. Mitchell GF, Moye LA, Braunwald E, et al. Sphygmomanometrically determined pulse pressure is a powerful independent predictor of recurrent events after myocardial infarction in patients with impaired left ventricular function. SAVE investigators. Survival and Ventricular Enlargement. Circulation 1997; 96(12): 4254-60.
13. Nakayama Y, Tsumura K, Yamashita N, Yoshimaru K, Hayashi T. Pulsatility of ascending aortic pressure waveform is a powerful predictor of restenosis after percutaneous transluminal coronary angioplasty. Circulation 2000; 101(5): 470-2.
14. Verdecchia P. Prognostic value of ambulatory blood pressure: current evidence and clinical implications. Hypertension 2000; 35(3): 844-51.
15. Hannan RD, Jenkins A, Jenkins AK, Brandenburger Y. Cardiac hypertrophy: a matter of translation. Clin Exp Pharmacol Physiol 2003; 30(8): 517-27.
16. Devereux RB, de Simone G, Ganau A, Koren MJ, Roman MJ. Left ventricular hypertrophy associated with hypertension and its relevance as a risk factor for complications. J Cardiovasc Pharmacol 1993; 21(Suppl 2): 38-44.
17. Kannel WB. Left ventricular hypertrophy as a risk factor in arterial hypertension. Eur Heart J 1992; 13(Suppl D): 82-8.
18. Viazzi F, Leoncini G, Parodi D, et al. Pulse pressure and subclinical cardiovascular damage in primary hypertension. Nephrol Dial Transplant 2002; 17(10): 1779-85.
19. I Diretrizes para uso da Monitorização Residencial da Pressão Arterial III MAPA/I MRPA. Rev Bras Hipertens 2001; 8(1).
20. Hammond IW, Devereux RB, Alderman MH, et al. The prevalence and correlates of echocardiographic left ventricular hypertrophy among employed patients with uncomplicated hypertension. J Am Coll Cardiol 1986; 7(3): 639-50.
21. O´Brien E, Petrie J, Littler WA. The Britsh hypertension society protocol for the evaluation of blood pressure measuring devices. J Hypertens 1993; 11(Suppl 2): 43-63.
22. Du Bois D, Du Bois E. A formula to estimate the approximate surface area if height and weight be known. Arch Intern Med 1916 (17): 863-71.
23. Devereux RB, Reichek N. Echocardiographic determination of left ventricular mass in man. Anatomic validation of the method. Circulation 1977; 55(4): 613-8.
24. Mule G, Nardi E, Andronico G, et al. Pulsatile and steady 24-h blood pressure components as determinants of left ventricular mass in young and middle-aged essential hypertensives. J Hum Hypertens 2003; 17(4): 231-8.
25. Pannier B, Brunel P, el Aroussy W, Lacolley P, Safar ME. Pulse pressure and echocardiographic findings in essential hypertension. J Hypertens 1989; 7(2): 127-32.
26. Gardin JM, Arnold A, Gottdiener JS, et al. Left ventricular mass in the elderly. The Cardiovascular Health Study. Hypertension 1997; 29(5): 1095-103.