CORRECTION
Correction: Regulation of
MYC
Expression and
Differential JQ1 Sensitivity in Cancer Cells
Trent Fowler, Payel Ghatak, David H. Price, Ronald Conaway, Joan Conaway,
Cheng-Ming Chiang, James E. Bradner, Ali Shilatifard, Ananda L. Roy
There is an error in
Fig 2
that appears to have occurred during the preparation of files after the
manuscript was accepted. In
Fig 2B
, the blot for Brd4 incorrectly appears as a duplicate of
P-Brd4. The authors have provided a corrected version of
Fig 2
here.
PLOS ONE | DOI:10.1371/journal.pone.0126328 April 22, 2015 1 / 2
OPEN ACCESS
Citation:Fowler T, Ghatak P, Price DH, Conaway R, Conaway J, Chiang C-M, et al. (2015) Correction: Regulation ofMYCExpression and Differential JQ1 Sensitivity in Cancer Cells. PLoS ONE 10(4): e0126328. doi:10.1371/journal.pone.0126328
Published:April 22, 2015
Reference
1. Fowler T, Ghatak P, Price DH, Conaway R, Conaway J, Cheng-Ming C, et al. (2014) Regulation of
MYCExpression and Differential JQ1 Sensitivity in Cancer Cells. PLoS ONE 9(1): e87003. doi:10. 1371/journal.pone.0087003PMID:24466310
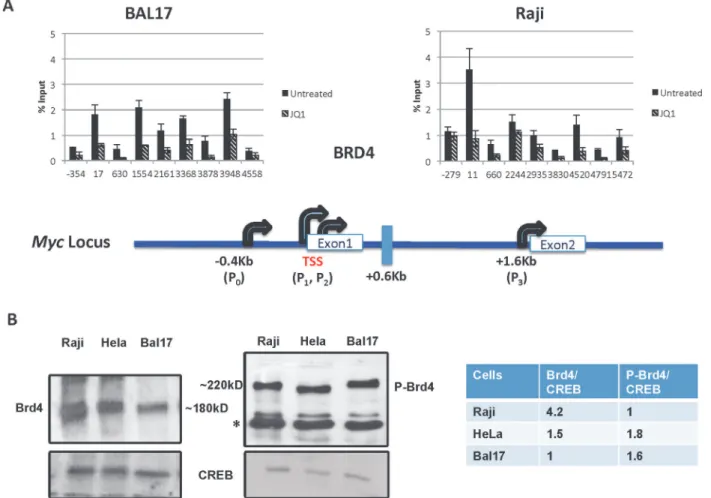
Fig 2. Brd4 occupancy and expression in different cells.Cells were either untreated or treated with 1μM of JQ1 for 2 hours. (A) Chromatin
Immunoprecipitation (ChIP) acrossMYCwith anti-C-terminal Brd4 antibody. Each experiment was performed twice, analyzed in triplicate via real-time PCR
and reported as the mean and standard deviation of the two experiments. A representation of the promoter area ofMYCis provided for orientation. (B)
Western blotting to detect (far left) Brd4 (~180 KD) and (middle) Brd4-S484/488-phos (P-Brd4, ~220 KD) was performed three times. A non-specific band detected with phopsho-Brd4 antibody is denoted with an asterisk. Typical results are shown with densitometry analysis relative to CREB expression, which is used as a normalization control (far right).
doi:10.1371/journal.pone.0126328.g001