Prevalence and Risk Factors of Restless Legs
Syndrome among Chinese Adults in a Rural
Community of Shanghai in China
Yunbo Shi☯, Huan Yu☯, Ding Ding, Peimin Yu, Dongyan Wu, Zhen Hong *
Department of Neurology, Huashan Hospital, Fudan University, Shanghai, China
☯These authors contributed equally to this work. *profzhong@sina.com
Abstract
Aims
The primary objective of this study was to investigate the prevalence and risk factors of rest-less legs syndrome (RLS) in an adult Chinese population living in a rural community. We also aimed to determine the predictive diagnostic value of the 4-item screening question-naire for RLS in this population.
Methods
This study was designed as a 2-phase survey. In phase 1 we performed a face-to-face inter-view of eligible individuals living in a rural community in Shanghai using a 4-item screening questionnaire. In phase 2, sleep specialists performed a phone interview of the individuals who screened positive to diagnosis RLS.
Results
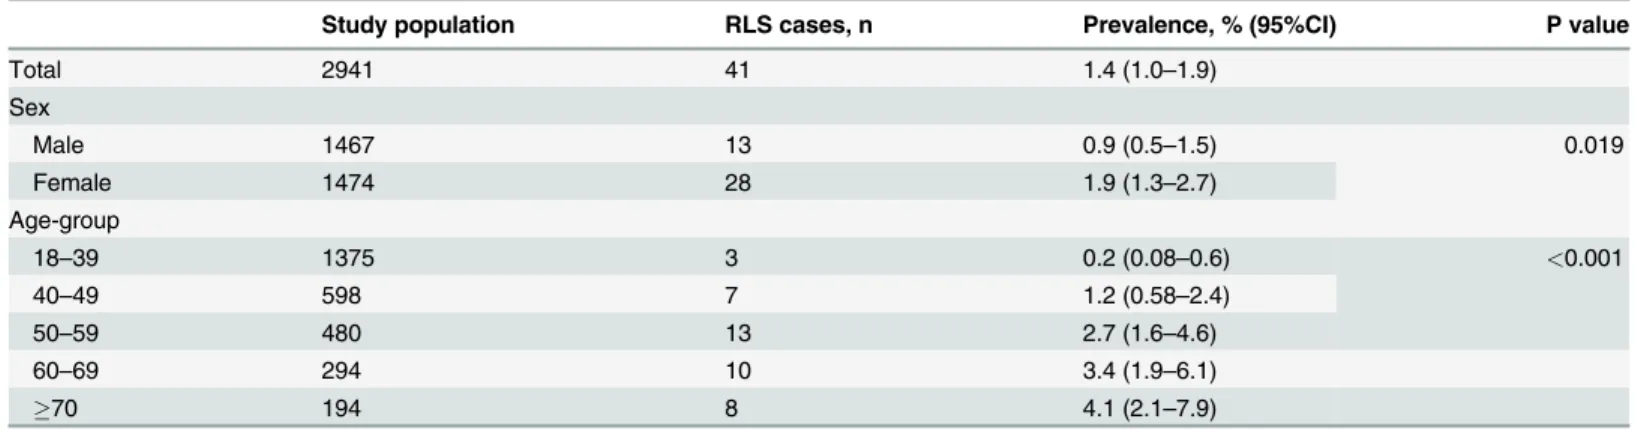
Forty-one RLS cases were confirmed among 2941 eligible individuals 18 years of age or older in the study community. The prevalence of RLS was 1.4% (95% confidence interval (CI) =1.0-1.9%), with a significantly higher rate observed in females (1.9% [95%CI =1.3-2.7%]) than that in males (0.9% [95%CI =0.5-1.5%], p=0.019). The prevalence rate increased significantly with age, from 0.2% (95% CI =0.08-0.6%) in those 18-39 years old to 4.1% (95% CI =2.1-7.9%) in those70 years old (p<0.001). The multivariate logistic regression analysis indicated that gastritis, anemia and hypertension were risk factors for RLS. The sensitivity and specificity of the 4-item screening questionnaire used in this study were 63.4% and 97.5%, respectively.
Conclusion
RLS prevalence is relatively low among Chinese adults living in rural Shanghai. Further-more, population-based studies with a larger sample size and a longitudinal follow-up may help to determine the risk factors of RLS and potential interventions for RLS.
OPEN ACCESS
Citation:Shi Y, Yu H, Ding D, Yu P, Wu D, Hong Z (2015) Prevalence and Risk Factors of Restless Legs Syndrome among Chinese Adults in a Rural Community of Shanghai in China. PLoS ONE 10(3): e0121215. doi:10.1371/journal.pone.0121215
Academic Editor:Marianna Mazza, Catholic
University of Sacred Heart of Rome, ITALY
Received:March 20, 2014
Accepted:February 12, 2015
Published:March 24, 2015
Copyright:© 2015 Shi et al. This is an open access article distributed under the terms of theCreative Commons Attribution License, which permits unrestricted use, distribution, and reproduction in any medium, provided the original author and source are credited.
Data Availability Statement:All relevant data are within the paper.
Funding:The authors have no support or funding to report.
Competing Interests:The authors have declared
Introduction
Restless legs syndrome (RLS) is a neurological sensorimotor disturbance characterized by dis-tressing sensations in the limbs, particularly the legs, that begin or worsen during periods of in-activity. The sensations are worse during the evening and nighttime hours and are partially or totally relieved by movement [1,2]. More recently, research has shown that RLS negatively af-fects sleep [3] and quality of life [4] and increases the risk of coronary heart disease [5]; thus, RLS is drawing the attention of an increasing number of neurologists.
More epidemiological studies have been conducted since the International Study Group de-clared the diagnostic criteria for RLS (1,2). The prevalence of RLS in residents of Western countries>18 years of age was estimated to be 8.5%-28.2% [6,7]. The prevalence of RLS in
Asian populations has been shown to be much lower, ranging from 0.1% to 12% [8,9]. This dif-ference is thought to be due to genetic heterogeneity and the geographic locations and differ-ences in research methodology of these studies [10].
Previous studies have shown that translating the diagnostic criteria of RLS into different lan-guages can result in wording variations due to the idiosyncrasies of each language. Also, the study procedure, or social and cultural factors can cause significant difficulties when diagnos-ing RLS. Based on these considerations, it was strongly recommended that the sensitivity, specificity, and positive predictive value of any instrument used to diagnose RLS should be vali-dated for the population in which it is intended to be used [11]. To our knowledge, only two RLS studies were previously conducted in a Chinese population in mainland China [10,12]. However, neither of those studies validated the instruments that they used in their
study population.
In this population-based epidemiological study, we aimed to investigate the prevalence and risk factors of RLS in Chinese adults18 years of age living in a rural community in Shanghai, China. We also validated the 4-item screening questionnaire for RLS in this population.
Methods
Ethics Statement
This study was approved by the Medical Ethics Committee of Huashan Hospital, Fudan Uni-versity, Shanghai, China. A written informed consent was obtained from all of the participants and/or their legal guardian.
Study population
The present door-to-door survey was conducted in a community of Shanyang town, Jinshan district, Shanghai, China, from January, 2013 to February, 2013. Potential subjects were identi-fied using a government maintained‘residents list’, which includes the name, sex, age, address, and telephone number of every resident. To be included in the study, the participant was re-quired 1) to be a registered resident in the community; 2) to be18 years of age; and 3) to pro-vide a written informed consent for study participation.
Screening procedure of the study
At phase I of the study, a screening questionnaire was used by the physicians and nurses to identify potential RLS cases. Demographic information was collected for each study subject (e.g., age, sex and the number of pregnancies in females). We also recorded the participants’ self-reported height and weight (overweight was defined as BMI>25 kg/m2) and life style
beer or 50 gm of Chinese alcohol more than twice a week). Medical histories, such as physi-cian-diagnosed hypertension, diabetes, anemia, gastritis, kidney disease, cardiovascular disease, and mental disorders (depression and anxiety) were also collected. Four questions suggested by the International Restless Legs Syndrome Study Group (IRLSSG) [2] based on the symptoms of RLS were used for screening. These questions were as follows: (1). Do you have unpleasant sensations (for example, crawling, tingling, pulling, stinging, burning, etc.) in your legs com-bined with an urge or need to move your legs? (2). Do these feelings occur mainly or only when you are at rest or lying down? (3). Do these feelings improve with movement (for exam-ple, walking, stretching, flexing, rubbing your legs or other activities)? (4). Are these feelings worse in the evening or night than in the morning? A sleep specialist at Huashan Hospital translated these four questions into Chinese.
Diagnosis of RLS
Those subjects who answered“yes”to question 1 alone or to question 1 and any additional questions during phase I of the study were identified as potential RLS cases at phase II. Sleep specialists at Huashan Hospital interviewed the participants over the telephone to rule out con-ditions mimicking RLS, such as radiculopathy and arthritis, etc. A RLS patient was defined as someone whose symptoms were consistent with RLS diagnostic criteria, with no possibility of having a disease that could mimic RLS. The degree of RLS severity was determined according to the 10-item IRLSSG rating scale: mild, (IRLS scores, 1–10); moderate, (IRLS scores, 11–20); severe, (IRLS scores, 21–30); and very severe,(IRLS scores, 31–40))[13]. The participants’ histo-ry of RLS-like symptoms among close relatives and the onset age of RLS symptoms were also recorded.
Statistical analysis
The categorical variables were expressed as frequencies (%). The Pearson Chi-squared test and Cochran Mantel Haenszel Chi-squared test were used to compare the categorical variables. The prevalence and 95% confidence intervals (CIs) of RLS were calculated for the entire popu-lation and for the popupopu-lation by age and gender. A multivariate logistic regression analysis was used to detect the risk factors associated with RLS in the total population and in males and fe-males. The models were adjusted for demographic factors, life styles, and medical histories. Factors with a frequency<10% were not entered into the regression model.
All of the p-values and CIs were estimated in a two-tailed manner. Differences were consid-ered to be statistically significant at p<0.05. The data were analyzed using SPSS 17.0.
Results
Characteristics of the study subjects
Fig 1shows that, 3196 registered residents who met the inclusion criteria were contacted from 2 neighborhoods in the community. Among these subjects, 255 (7.98%) refused to participate. Thus, 2941 subjects completed phase I screening, and 263 subjects among them entered phase II of the study as potential RLS cases. During phase II, the sleep specialist interviewed 238 po-tential RLS cases (25 refused to be interviewed) and diagnosed 41 participants with RLS.
RLS prevalence
18–39-year-old age group was 0.2% (95% CI: 0.08–0.6%), while that for the70-year-old age group was 4.1% (95% CI: 2.1–7.9%, p<0.001) (Table 1).
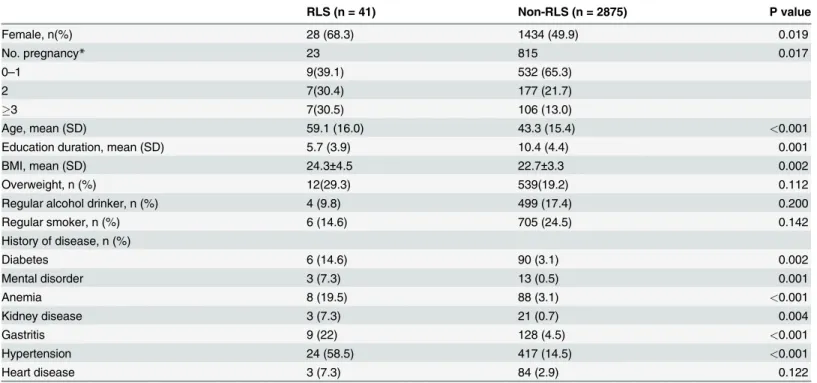
Socio-demographics and medical history of people with and without RLS
Sixty-eight percent of people with RLS were female, which was significantly higher than people without RLS (50%). The average age of people with RLS was significantly higher than that of people without RLS (59.1 years (SD 16.0) vs. 43.3 years (SD 15.4)). The average BMI of people with RLS was significantly higher than that of people without RLS (24.3 (SD 4.5) vs 22.7 Fig 1. Flow chart of patients with RLS through the study.3196 subjects were enrolled in this study. 2941 subjects completed phase I screening using 4-item questionnaire to identify potential RLS cases. 263 subjects who at least answered“yes”to question 1 during phase I of the study were identified as potential RLS cases at phase II. At last, 41 subjects were diagnosed RLS patient consistent with RLS diagnostic criteria, with no possibility of having a disease that could mimic RLS by Sleep specialists.
doi:10.1371/journal.pone.0121215.g001
Table 1. Prevalence of RLS by sex and age-group.
Study population RLS cases, n Prevalence, % (95%CI) P value
Total 2941 41 1.4 (1.0–1.9)
Sex
Male 1467 13 0.9 (0.5–1.5) 0.019
Female 1474 28 1.9 (1.3–2.7)
Age-group
18–39 1375 3 0.2 (0.08–0.6) <0.001
40–49 598 7 1.2 (0.58–2.4)
50–59 480 13 2.7 (1.6–4.6)
60–69 294 10 3.4 (1.9–6.1)
70 194 8 4.1 (2.1–7.9)
(SD 3.3)). However, when being overweight was defined as BMI>25 kg/m2, there was no
sig-nificant difference in the frequency of overweight individuals with or without RLS. People with RLS had significantly less years of education than people without RLS (5.7 (SD 3.9) vs. 10.4 (SD 4.4)). There was no significant difference in regular alcohol consumption, regular smoking or heart disease between the 41 RLS cases and 2875 non-RLS cases. Compared to the non-RLS cases, people with RLS were more likely to have diabetes, mental disorders, anemia, kidney dis-ease, gastritis, and hypertension (Table 2).
Risk factors associated with RLS
The results of the multivariate logistic regression analysis of the factors impacting RLS are pre-sented inTable 3. The analysis indicated that gastritis (OR = 2.96; 95% CI:1.27–6.90;
P = 0.012), anemia (OR = 6.93; 95% CI:2.78–17.30; P<0.001), and hypertension (OR = 4.10;
95% CI: 1.88–8.92; P<0.001) were risk factors for RLS. For the female population, gastritis
(OR = 3.28; 95% CI:1.05–10.24; P = 0.041) and anemia (OR = 10.86; 95% CI:3.87–30.48; P<0.001) were risk factors of RLS, and for the male population, only hypertension (OR = 7.18;
95% CI:1.74–29.58; P = 0.006) was the risk factor of RLS.
The family history and severity of RLS cases
Among 41 diagnosed RLS cases, 7 (17.1%) reported a family history of RLS-like symptoms among relatives of any degree. Of those diagnosed with RLS, 31.7% had mild symptoms, 53.7% had moderate symptoms and 14.6% had severe symptoms. Only nine patients (21.9%) were aware of their disease and diagnosed RLS by a physician.
Table 2. Socio-demographics and medical history of individuals with or without RLS.
RLS (n = 41) Non-RLS (n = 2875) P value
Female, n(%) 28 (68.3) 1434 (49.9) 0.019
No. pregnancy* 23 815 0.017
0–1 9(39.1) 532 (65.3)
2 7(30.4) 177 (21.7)
3 7(30.5) 106 (13.0)
Age, mean (SD) 59.1 (16.0) 43.3 (15.4) <0.001
Education duration, mean (SD) 5.7 (3.9) 10.4 (4.4) 0.001
BMI, mean (SD) 24.3±4.5 22.7±3.3 0.002
Overweight, n (%) 12(29.3) 539(19.2) 0.112
Regular alcohol drinker, n (%) 4 (9.8) 499 (17.4) 0.200
Regular smoker, n (%) 6 (14.6) 705 (24.5) 0.142
History of disease, n (%)
Diabetes 6 (14.6) 90 (3.1) 0.002
Mental disorder 3 (7.3) 13 (0.5) 0.001
Anemia 8 (19.5) 88 (3.1) <0.001
Kidney disease 3 (7.3) 21 (0.7) 0.004
Gastritis 9 (22) 128 (4.5) <0.001
Hypertension 24 (58.5) 417 (14.5) <0.001
Heart disease 3 (7.3) 84 (2.9) 0.122
*Among female subjects
Validation of the screening questionnaire
Among the 238 interviewed potential RLS cases, 31 subjects responded“yes”to all four ques-tions, and 26 of those 31 subjects were diagnosed RLS. Also, 15 out of 207 subjects who an-swered“yes”to at least the first question, but not to all four questions, were diagnosed with RLS. The 4-item screening questionnaire had a 63.4% sensitivity and a 97.5% specificity for the diagnosis of RLS in this study population. Its positive predictive value was 83.9%, and its nega-tive predicnega-tive value was 92.8%.
Discussion
The prevalence of RLS was found to be 1.4% in the current population-based Chinese study using a door-to-door interview and telephone interview performed by sleep specialists accord-ing to the criteria of IRLS. This findaccord-ing is substantially lower than the prevalence rates documented for primarily adult Caucasian population samples (7.2%–14.3%) [6,14,15], but is similar to prevalence rates documented for most adult Asian population samples (1.57%–2.1%) [16,17,18].
To date, two other studies have reported the prevalence of RLS in mainland China [10,12]. One was conducted in a population of 16 years of age and above in a town of Shandong prov-ince. The diagnosis in that study was based only on the 4-item screening questionnaire sug-gested by the IRLSSG, and no further interview was performed by a sleep specialist. Thus “mimics”(false positive diagnoses of RLS) could not be excluded. In that study, the prevalence of RLS was 7.2% [12], which was much higher than that in our study (1.4%,18 years). Anoth-er 3-step-design study surveyed an eldAnoth-erly population, ovAnoth-er 50 years of age, in a town of Shang-hai. They used the 4-item screening questionnaire suggested by the IRLSSG to perform the first telephone interview. The second telephone interview was performed by a sleep specialist to rule out‘mimics’and secondary RLS. The final face-to-face interview was performed in the clinic for confirmation and examination. The overall prevalence of primary RLS was 0.69% in the study [10], which was lower than that in our study (3.2%,50 years). A possible explana-tion for the differences in the results between our study and the previous studies is differences in procedure and sample selection.
Recently, it has become clear that the positive predictive value of many questionnaire screens for RLS may be fairly low, and many individuals who are identified by these screens Table 3. Odds ratios of factors associated with RLS in total, male and female populations, by multivariate logistic regression analysis.
Total Male Female
Variables OR (95% CI) P value OR (95% CI) P value OR (95% CI) P value
Sex 1.35 (0.57–3.20) 0.501 - - -
-Age 1.02 (0.99–1.05) 0.209 1.04 (0.98–1.10) 0.210 1.01 (0.96–1.06) 0.845
Education year 0.91 (0.83–1.00) 0.070 0.88 (0.73–1.05) 0.164 0.93 (0.82–1.06) 0.294
Overweight 1.31 (0.63–2.73) 0.476 2.01 (0.56–7.16) 0.282 1.11 (0.37–3.34) 0.851
No. pregnancy - - - - 1.23 (0.79–1.91) 0.354
Drinking alcohol regularly 0.72 (0.21–2.53) 0.612 0.66 (0.18–2.49) 0.543 -
-Smoking regularly 0.85 (0.27–2.64) 0.773 1.08 (0.32–3.68) 0.903 -
-Diabetes 1.75 (0.64–4.82) 0.278 2.84 (0.53–15.14) 0.222 1.69 (0.39–7.40) 0.488
Anemia 6.93 (2.78–17.30) <0.001 - - 10.86 (3.87–30.45) <0.001
Gastritis 2.96 (1.27–6.90) 0.012 3.59 (0.90–14.27) 0.070 3.28 (1.05–10.24) 0.041
Hypertension 4.10 (1.88–8.92) <0.001 7.18 (1.74–29.58) 0.006 2.75 (0.91–8.34) 0.074
Heart disease 0.56 (0.15–2.17) 0.402 0.58 (0.07–5.21) 0.628 0.30 (0.03–3.20) 0.320
have other conditions that can“mimic”the features of RLS by satisfying the four diagnostic cri-teria. The data from diagnostic studies on RLS have indicated that the use of the essential diag-nostic criteria of the IRLSSG by RLS experts has less than perfect sensitivity and specificity. ‘‘Mimics”(false positive diagnoses) of RLS have been reported in 16% of the investigated popu-lations [11]. In another study, up to 41.0% of the individuals that replied‘yes’to either one, two or three questions asked by the interviewers were diagnosed with RLS [19]. The gold standard for the correct diagnosis of RLS is a careful and detailed interview by an experienced specialist [20]. Hening et al. emphasized that the 4-item screening questionnaire was sensitive, specific and reliable for RLS diagnosis even if it was used during a telephone interview, but the inter-view should be conducted by a sleep specialist. The results of RLS diagnosis using this question-naire would be different if the questions were asked by non-physician interviewers [21]. Based on these considerations, the 4-item screening questionnaire should be evaluated for its sensitiv-ity, specificsensitiv-ity, and positive predictive value for its target population. Based on the results of phase I and phase II of our study, we validated the 4-item screening questionnaire and conclud-ed that its sensitivity and specificity were 63.4% and 97.5%, respectively. Its positive prconclud-edictive value and negative predictive value were 83.9% and 92.8%, respectively. As we know, this was the first study to determine the predictive value of the 4-item screening questionnaire in a Chinese population.
In our study, social-demographics and medical histories were taken into consideration, further subgroup analysis indicated that hypertension was an RLS risk factor for males but not females. In our study, 87.5% of RLS cases were of mild-moderate severity; and the frequency of RLS in our study population was low, which can partly explain our results. Therefore, future studies with larger samples and longitudinal follow-up should examine whether there are gender dif-ferences in the risk factors of RLS.
Another important finding in our study was that only nine patients were aware of their dis-ease and had been diagnosed with RLS by a physician. This ignorance may result from people not viewing RLS as a disease. This finding shows that RLS is under-diagnosed due to the low physician awareness of RLS in mainland China.
There were some advantages of this study. First, this door-to-door study had a high re-sponse rate of 92.0%. In addition, we are the first to validate the diagnostic ability of the 4-item screening questionnaire in a Chinese population. Furthermore, we demonstrated the risk fac-tors for different genders. Several limitations of this study should be taken into account. First, 25 of the 263 participants that responded‘yes’to at least the first question refused to participate in phase II, which might have resulted in an underestimation of the prevalence of RLS; howev-er, the refusal rate was low, so the results should be reliable. Secondly, all of the clinical disor-ders were self-reported, which can generate recall bias. Thirdly, our sample was from a rural community of Shanghai, where the socio-economic status is higher than in the rural communi-ties of other cicommuni-ties. Therefore, the data cannot be generalized to the entire 1370 million Chinese living throughout the country. Lastly, the use of cross-sectional data prohibits any assessment of the causal relationship between RLS and the clinical disorders surveyed. The causal relation-ship may be verified in future follow-up studies for this cohort.
Our study results suggest that the prevalence of RLS was 1.4% among Chinese adults in a rural community of Shanghai in China, but up to 78.1% RLS patients have not been diagnosed or treated. An increasing number of studies have shown that RLS negatively affects sleep and quality of life and increases the risk of coronary heart disease and hypertension, yet medicines can efficiently treat this disease. Therefore, there is a need to increase the awareness regarding RLS among both medical professionals and the general population. Further population-based studies with larger sample sizes and longitudinal follow-up may help to determine the risk fac-tors of RLS and potential interventions for RLS.
Acknowledgments
The authors thank all of the staff who took part in the questionnaire survey and all of the par-ticipants for their cooperation.
Author Contributions
Conceived and designed the experiments: ZH HY. Performed the experiments: YS HY PY DW. Analyzed the data: YS DD. Contributed reagents/materials/analysis tools: YS HY PY. Wrote the paper: YS ZH.
References
1. Walters AS (1995) Toward a better definition of the restless legs syndrome. The International Restless Legs Syndrome Study Group. Mov Disord 10: 634–642. PMID:8552117
3. Allen RP, Earley CJ (2001) Validation of the Johns Hopkins restless legs severity scale. Sleep Med 2: 239–242. PMID:11311687
4. Hening W, Walters AS, Allen RP, Montplaisir J, Myers A, et al. (2004) Impact, diagnosis and treatment of restless legs syndrome (RLS) in a primary care population: the REST (RLS epidemiology, symp-toms, and treatment) primary care study. Sleep Med 5: 237–246. PMID:15165529
5. Li Y, Walters AS, Chiuve SE, Rimm EB, Winkelman JW, et al. (2012)Prospective study of restless legs syndrome and coronary heart disease among women. Circulation 126: 1689–1694. doi:10.1161/ CIRCULATIONAHA.112.112698PMID:22967852
6. Tison F, Crochard A, Leger D, Bouee S, Lainey E, et al. (2005) Epidemiology of restless legs syndrome in French adults: a nationwide survey: the INSTANT Study. Neurology 65: 239–246. PMID:16043793 7. Alattar M, Harrington JJ, Mitchell CM, Sloane P (2007) Sleep problems in primary care: a North
Caro-lina Family Practice Research Network (NC-FP-RN) study. J Am Board Fam Med 20: 365–374. PMID:
17615417
8. Tan EK, Seah A, See SJ, Lim E, Wong MC, et al. (2001) Restless legs syndrome in an Asian popula-tion: A study in Singapore. Mov Disord 16: 577–579. PMID:11391765
9. Kim J, Choi C, Shin K, Yi H, Park M, et al. (2005) Prevalence of restless legs syndrome and associated factors in the Korean adult population: the Korean Health and Genome Study. Psychiatry Clin Neurosci 59: 350–353. PMID:15896230
10. Ma JF, Xin XY, Liang L, Liu LH, Fang R, et al. (2012)Restless legs syndrome in Chinese elderly people of an urban suburb in Shanghai: a community-based survey. Parkinsonism Relat Disord 18: 294–298. doi:10.1016/j.parkreldis.2011.11.014PMID:22154296
11. Hening WA, Allen RP, Washburn M, Lesage SR, Earley CJ (2009) The four diagnostic criteria for Rest-less Legs Syndrome are unable to exclude confounding conditions ("mimics"). Sleep Med 10: 976–981. doi:10.1016/j.sleep.2008.09.015PMID:19185537
12. Li LH, Chen HB, Zhang LP, Wang ZW, Wang CP(2012) A community-based investigation on restless legs syndrome in a town in China. Sleep Med 13: 342–345. doi:10.1016/j.sleep.2011.09.008PMID:
22172960
13. Walters AS, LeBrocq C, Dhar A, Hening W, Rosen R, et al. (2003) Validation of the International Rest-less Legs Syndrome Study Group rating scale for restRest-less legs syndrome. Sleep Med 4: 121–132. PMID:14592342
14. Allen RP, Walters AS, Montplaisir J, Hening W, Myers A, et al. (2005) Restless legs syndrome preva-lence and impact: REST general population study. Arch Intern Med 165: 1286–1292. PMID:15956009 15. Bjorvatn B, Leissner L, Ulfberg J, Gyring J, Karlsborg M, et al. (2005) Prevalence, severity and risk
fac-tors of restless legs syndrome in the general adult population in two Scandinavian countries. Sleep Med 6: 307–312. PMID:15923140
16. Rangarajan S, D'Souza GA (2007) Restless legs syndrome in an Indian urban population. Sleep Med 9: 88–93. PMID:17825618
17. Nomura T, Inoue Y, Kusumi M, Uemura Y, Nakashima K (2008) Prevalence of restless legs syndrome in a rural community in Japan. Mov Disord 23: 2363–2369. doi:10.1002/mds.22274PMID:18973260 18. Chen NH, Chuang LP, Yang CT, Kushida CA, Hsu SC, et al. (2010)The prevalence of restless legs
syn-drome in Taiwanese adults. Psychiatry Clin Neurosci 64: 170–178. doi:10.1111/j.1440-1819.2010. 02067.xPMID:20447013
19. Yilmaz NH, Akbostanci MC, Oto A, Aykac O (2013)Prevalence of restless legs syndrome in Ankara, Turkey: an analysis of diagnostic criteria and awareness. Acta Neurol Belg 113: 247–251. doi:10. 1007/s13760-012-0153-7PMID:23111781
20. Phillips B, Young T, Finn L, Asher K, Hening WA, et al. (2000) Epidemiology of restless legs symptoms in adults. Arch Intern Med 160: 2137–2141. PMID:10904456
21. Hening WA, Allen RP, Thanner S, Washburn T, Heckler D, et al. (2003) The Johns Hopkins telephone diagnostic interview for the restless legs syndrome: preliminary investigation for validation in a multi-center patient and control population. Sleep Med 4: 137–141. PMID:14592344
22. Phillips B, Hening W, Britz P, Mannino D (2006) Prevalence and correlates of restless legs syndrome: results from the 2005 National Sleep Foundation Poll. Chest 129: 76–80. PMID:16424415
23. Ulfberg J, Bjorvatn B, Leissner L, Gyring J, Karlsborg M, et al. (2007) Comorbidity in restless legs syn-drome among a sample of Swedish adults. Sleep Med 8: 768–772. PMID:17825613
24. Rangarajan S, D'Souza GA (2007) Restless legs syndrome in Indian patients having iron deficiency anemia in a tertiary care hospital. Sleep Med 8: 247–251. PMID:17368978
26. Pennestri MH, Montplaisir J, Colombo R, Lavigne G, Lanfranchi PA (2007) Nocturnal blood pressure changes in patients with restless legs syndrome. Neurology 68: 1213–1218. PMID:17420405 27. Bartzokis G, Tishler TA, Lu PH, Villablanca P, Altshuler LL, et al. (2007) Brain ferritin iron may influence
age- and gender-related risks of neurodegeneration. Neurobiol Aging 28: 414–423. PMID:16563566 28. Mallon L, Broman JE, Hetta J (2008) Restless legs symptoms with sleepiness in relation to mortality:
20-year follow-up study of a middle-aged Swedish population. Psychiatry Clin Neurosci 62: 457–463. doi:10.1111/j.1440-1819.2008.01831.xPMID:18778444