Prevalence and associated
factors with alcohol use
disorders among adults: a
population-based study in
southern Brazil
Prevalência e fatores associados a
transtornos devido ao uso de álcool
em adultos: estudo populacional no
sul do Brasil
Emilene Reisdorfer
Fátima Büchele
Rodrigo Otávio Moretti Pires
Antonio Fernando Boing
II Post-Graduate Program in Public Health, Center of Health Sciences, Federal
University of Santa Catarina, Florianópolis, Santa Catarina, Brazil.
*Binge drinking is a common pattern of excessive alcohol use . The National Institute on Alcohol Abuse and Alcoholism (USA) deines binge drinking as a pattern of drinking that brings a person’s blood alcohol concentration (BAC) to 0.08 grams percent or above. This typically happens when men consume 5 or more drinks, and when women consume 4 or more drinks, in about 2 hours.
Financiamento: Este artigo é originário do Projeto EPIFLORIPA2009 (Estudo Epidemiológico das Condições de Saúde dos Adultos de Florianópolis), Santa Catarina. Este estudo foi inanciado pelo Conselho Nacional de Desenvolvimento Cientíico e Tecnológico (CNPq), processo número 485327/2007-4 e desenvolvido no âmbito do Programa de Pós-Graduação em Saúde Coletiva da Universidade Federal de Santa Catarina.
Correspondence to: Emilene Reisdorfer. Post-Graduate Program in Public Health, Center of He-alth Sciences - Department of Public HeHe-alth - room 129, Federal University of Santa Catarina, Uni-versity Campus – Trindade – CEP 88010-970 Florianópolis – SC, Brazil. Fax: 55 48 37219842. E-mail: [email protected]
Abstract
Objectives: The study aimed to describe the prevalence of alcohol use disorders in an adult population from Brazil and its association with demographic, socioeco-nomic, behavioral variables and health conditions. Methods: A population-based cross-sectional survey was conducted with adults (20 to 59 years) of a medium-sized city in Southern Brazil with a random sam-ple of 1,720 individuals. Cluster sampling was done in two stages: census tract first and household second. Alcohol use di-sorders were measured using the Alcohol Use Disorders Identification Test (AUDIT) and associations were tested with selected variables by Poisson Regression. Results of multivariate analysis were expressed as prevalence ratios. Results: The prevalence of alcohol use disorders in the population was 18.4% (95% CI: 16.6% - 20.3%), higher among men (29.9%) than in women (9.3%). The prevalence of abstinence was 30.6%; 6.8% of respondents had already caused problems to themselves or to others after drinking; and 10.3% reported that a relative, friend or doctor had already shown concern on their drinking. After multivariate analy-sis, an association with alcohol use disorders remained for: being male, age 20 to 29 years, being single, declaring to be light-skinned blacks and being an ex-smoker or current smoker. Conclusion: The prevalence of alcohol use disorders identified is high compared with other similar studies, with differences according to being male, age 20 to 29, skin color and tobacco use. These issues must be considered in formulating public health policies aimed at reducing problems related to alcohol use.
Descriptors: Cross sectional studies.
Resumo
Objetivos: Descrever a prevalência de uso problemático de álcool na população adulta de uma cidade de médio porte do sul do Brasil e testar sua associação com variáveis demográficas, socioeconômicas, comporta-mentais e de condições de saúde. Métodos:
Foi realizado um estudo transversal de base populacional com adultos (20 a 59 anos) de uma cidade de médio porte do sul do Brasil com amostra probabilística de 1.720 pessoas. Utilizou-se o processo de amostra-gem por conglomerados, em dois estágios, sendo o primeiro o setor censitário e o se-gundo o domicílio. O uso problemático de álcool foi mensurado por meio do Alcohol Use Disorder Identification Test (AUDIT) e foram testadas as associações com variá-veis selecionadas através da Regressão de Poisson. Os resultados das análises multi-variáveis foram expressos como razão de prevalência. Resultados: A prevalência de uso problemático de álcool na população foi de 18,4% (IC95%: 16,6% – 20,3%), sendo
maior entre os homens (29,9%) do que entre as mulheres (9,3%). A prevalência de abs-tenção foi de 30,6%. Verificou-se que 6,8% dos entrevistados já causaram problemas a si mesmos ou a outros após terem bebido e 10,3% referiram que algum parente, amigo ou médico já se preocupou com seu modo de beber. Após a análise multivariável, per-maneceram associados com o uso proble-mático de álcool o sexo masculino, a faixa etária de 20 a 29 anos, pessoas solteiras, que se declararam pardas, e ex-fumantes ou fumantes atuais. Conclusão: A prevalência de uso problemático de álcool é elevada em comparação com outros estudos se-melhantes, existindo diferenças segundo características demográficas, cor de pele e comportamentais. Estas questões devem ser consideradas na formulação de políticas pú-blicas de saúde que objetivem a redução dos problemas relacionados ao uso de álcool.
Palavras-chave: Estudos transversais.
Prevalência. Transtornos relacionados ao uso de álcool. Adulto. Brasil.
Introduction
Alcohol use disorders are associated with several adverse psychological, social and biological consequences such as incre-ase in psychosocial problems, psychiatric co-morbidities and avoidable illnesses and incapacities. It is estimated that in 2007, 3.2% of deaths and 4.0% of all years of po-tential life lost were related to consumption of alcoholic beverages, worldwide1.
Alcohol use is associated with several economic, cultural, environmental, biologi-cal, psychological and social factors that act simultaneously to influence the propensity for anyone to use alcohol, and this is due to the interaction between alcohol, the subject and the environment in which it operates. These factors influence how people drink in different ways, and can be protective or risk factors2.
Among the factors associated with alco-hol use disorders, being male, single, young and declaring to be light-skinned black are more likely related to the development of al-cohol use disorders3-5. Moreover, a Brazilian
study found a higher chance of association of alcohol abuse in patients with common mental disorders6.
The prevalence of alcohol use is quite varied in different parts of the world. Whilst a study conducted in 20 countries on the African continent identified a prevalence of abstinence above 95%7, a population-based
study carried out in Denmark found that only 5% of the population abstained, and 14% of men and 9% of women presented problems related to alcohol use8. North and
East European countries and certain regions in America present the highest levels of alcohol consumption per capita, whilst the lowest levels are observed in Mediterranean countries9.
consumption per capita per year, reaching almost 8.5 liters, a number which is higher than the world average of 5.8 liters10. Policies
to minimize alcohol consumption are timid in the country and incentives to drink throu-gh advertisements for alcoholic beverages, particularly beer, are ostensible11-12.
In 2001, the I Household Survey on the Use of Psychotropic Drugs in Brazil was performed in the 107 largest Brazilian cities, with individuals aged 12 to 65 years. The stu-dy showed that alcohol use during lifetime was 68.7%. It was estimated that 11.2% of the population was dependent on alcohol. This index, stratified by sex, indicated dependen-ce of 17.1% in men and 5.7% in women13.
By 2005, the II Household Survey on the Use of Psychotropic Drugs in Brazil found an estimated 12.3% of alcohol dependence, with a non-statistically significant increase of 1.1%. As for lifetime use, this study found a prevalence of 74.6%, higher than the figure found in the previous study14.
Another important study conducted in Brazil, in 2007, was the First National Survey on Alcohol Consumption Patterns in the Brazilian population. The results of the study enable obtaining a summary of the standard drinking habits of Brazilians: 48% were abstainers, 23% drank heavily and regularly, and 29% were occasional drinkers and did not make heavy use. Of the total population aged 18 or over, 9% had a pattern of dependence15.
In developing countries, including Brazil, problems deriving from alcohol use are still largely investigated with a focus on alcohol dependence. There are, however, problems just as serious, if not more so, to the individual or to society related to other alcohol consumption patterns such as the potential alcohol use disorders, which include hazardous, harmful use as well as possible dependence2,16.
Hazardous drinking is a pattern of alcohol consumption that increases the risk of harmful consequences to the user or to others. Hazardous drinking patterns are of public health significance despite the absence of any current disorder in the
individual user. Harmful use refers to alco-hol consumption resulting in consequences to physical and mental health16.
Alcohol dependence is a cluster of behavioral, cognitive, and physiological phenomena that may develop after repeated alcohol use. Typically, these phenomena include a strong desire to consume alcohol, impaired control over its use, persistent drinking despite harmful consequences, a higher priority given to drinking than to other activities and obligations, increased alcohol tolerance, and a physical withdra-wal reaction when alcohol use is disconti-nued17. In this sense, population-based
studies aimed at identifying patterns of alcohol use enable a better understan-ding of the magnitude of this problem in society and call for public actions to bring about a decrease in problems caused by consumption of this substance18. However,
few population-based studies are carried out in these countries to identify alcohol use disorders and associated factors in the population.
The aims of this study were to describe the prevalence of alcohol use disorders in the adult population in the South of Brazil and to test its association with demogra-phic, socioeconomic and behavioral varia-bles and health conditions.
Methods
A population-based cross sectional study was conducted in Florianópolis, a city situated in the South of Brazil which presents a high Human Development Index (0.875), the fourth highest among Brazilian cities. It is considered the state capital with the best quality of life in the country, and it had an estimated population of 408,163 inhabitants in 2009.
occurred between September 2009 and January 2010.
Sample
The sample size was calculated to test the difference between alcohol use disorders and socioeconomic and demographic exposures. Among the simulations carried out after data were collected, using per capita income as exposure provided the largest sample, and was the value adopted. Parameters used were relative risk of 1.65, power of 80%, significan-ce level of 95%, ratio between non-exposed and exposed of 2:1, and prevalence of alcohol use disorders in the non-exposed group of 14.7%. The sample size was calculated in the EpiInfo 6.04 statistical package. The initial sample of 633 individuals was multiplied by a design effect (deff) of 2 increased by 10% for losses and refusals and 20% for control of confounding factors. This resulted in a sample of 1,671 individuals. As the current study was part of a larger research investiga-ting other health outcomes, the final sample was larger, 2,016 adults.
The sampling process was a two-stage cluster. The first stage comprised 420 urban census tracts which consisted of appro-ximately 300 homes each, also used by the Brazilian Institute of Geography and Statistics (IGBE) in the national census. Tracts were stratified into deciles, according to the head of the family’s income. Six sectors in each decile were then systematically selec-ted by drawing lots, totaling 60 census tracts for the sample. All tracts were visited by the research team who then counted the residen-tial units occupied, which were configured as the second stage tract. As the number of homes among tracts varied between 61 and 810, sectors were reorganized through fusion and division of the units, respecting the geographic location and income decile of each one. Consequently, the variation in the number of residential units among census tracts was substantially reduced. From 17,755 eligible residences, 1,134 were selected for the study, resulting in an average of 1.8 adult household members per residence.
Data Collection
Data were collected in the homes, throu-gh a questionnaire applied individually to the participant by the interviewer in a quiet place, by 35 trained interviewers. Data were recorded and stored in a small computer also known as a Personal Digital Assistant
(PDA) and later exported to Stata 9 (Stata Corporation, College Station, Texas) and analyzed. Prior to data collection, a pre--test of the questionnaire and a pilot study were carried out on approximately 100 individuals in two census tracts that were not included in the study.
All adult residents in the households were potentially eligible. Individuals who were institutionalized or with a physical and/or mental impediment were excluded from the study and those who declined to participate were considered refusals. Individuals who were not located at homes visited at least four times, including at least one visit on weekends and one at night, were considered losses. The questionnaire could not be answered by someone other than the individuals chosen. When an individual opted not to participate in the study, it was considered a refusal. Quality control of data collection was ensured by application of a shortened version of the questionnaire (10 questions) by phone to 15% of participants interviewed. The lowest kappa score was 0.6 in the question about use of dental prosthetics.
Dependent Variable
Alcohol use disorders were measu-red through the Alcohol Use Disorder Identification Test (AUDIT)16. The AUDIT
was validated in various countries, inclu-ding Brazil, and presented good levels of sensitivity (87.8%) and specificity (81%)19
for detection of alcohol use disorders. Its performance has been positively evaluated in primary Health Care services and in population based studies on prevalence20.
dependency and alcohol-related problems. The answers to each question are given scores from 0 to 4, higher scores indicating worse problems. The score varies from 0 to 40 and in the current study, alcohol use disorders were defined by a score above 716.
Exploratory Variables
The independent variables analyzed were sex, age (20-29, 30-39, 40-49 and 50-59 years), self-referred skin color (white, light--skinned blacks or darklight--skinned blacks), marital status (married, single or divorced/ widowed), per capita income in tertiles, level of schooling (years of study: 0 to 4, 5 to 8, 9 to 11 to 12 or more), being employed at time of interview (yes or no), self-assessment of health (positive (very good + good) or ne-gative (regular + bad + very bad)), common mental disorder (measured through the Self-Reported Questionnaire – SRQ 20, with a cutoff point of 721, previous diagnosis of
at least one chronic disease, use of tobacco (never, ex-smoker, current smoker of up to 10 cigarettes a day, current smoker of more than 10 cigarettes a day), medical appoint-ment in the past two weeks (yes or no), and a home visit by a Community Health Worker of the Family Health Program (FHP) in the past 12 months (yes or no).
Data analysis
Poisson regression was used for statis-tical analysis22 and in accordance with the
theory of hierarchical model for determina-tion23. In the model proposed in the current
study, the demographic variables constitu-ted the most distal level, the socioecono-mic and health conditions constituted the intermediary level and use of health services constituted the closest to the outcome.
In the data analysis, variables were included in the model according to the hierarchy established in the theoretical mo-del. For the multivariate analysis, variables which presented p ≤ 0.20 in the bivariate analysis were maintained; those with p < 0.05 remained in the final model. For the
analysis, the design effect was taken into account by using the ‘svy’ command in Stata.
Ethical Questions
The project was approved by the Committee of Ethics in Research on Human Beings of the Federal University of Santa Catarina under protocol number 351/08. Participation in the study was voluntary and informed consent was obtained from all participants.
RESULTS
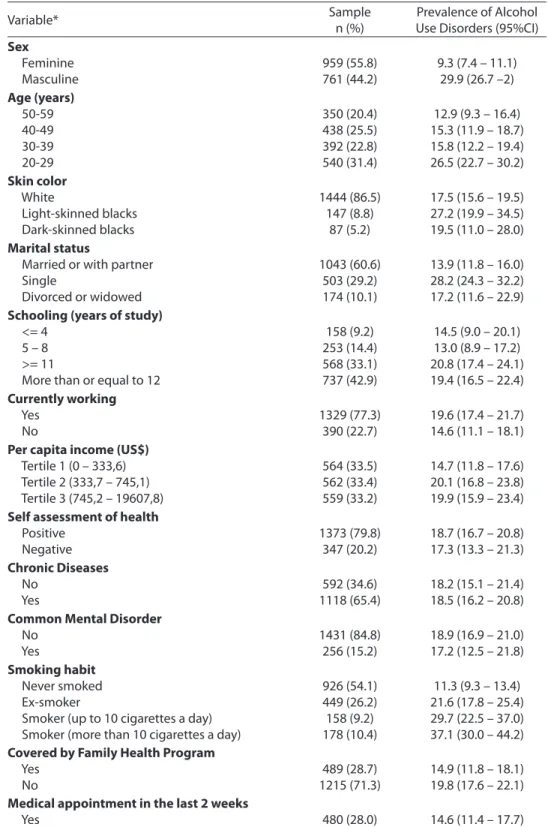
We interviewed 1,720 individuals, a response rate of of 85.3%, with 51.7% of the participants being women, and the average age 38.1 years. The majority of interviewees declared themselves to be white (86.5%), married or living with a partner (60.6%). In terms of schooling, 42.9% had 12 or more years of study and 77.3% were employed at the time of the study. Other characteristics of the sample are shown in Table 1.
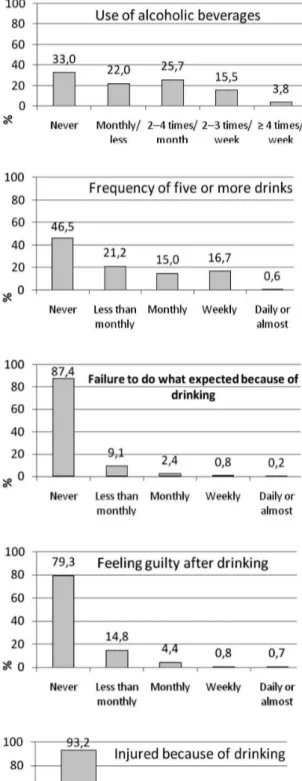
The answers to the AUDIT questions are described in Figure 1. Approximately one in three individuals abstained from alco-hol and, of those who drank, 70.3% drank more than two doses. In addition, excessive sporadic drinking (binge drinking24*) was
observed in 32.3%, i.e. ingestion of five doses or more at one time, at least once a month. Results showed that 6.8% of those interviewed had already caused problems to themselves or to others after drinking, and 10.3% reported that a relative, friend or doctor had shown concern regarding their drinking habits.
Table 1 – Sample characteristics and prevalence of alcohol use disorders according to demographic, socioeconomic and behavioral variables and use of health services. Florianópolis, 2009.
Tabela 1 – Características da amostra e prevalência de uso problemático de álcool de acordo com variáveis demográicas, socioeconômicas, comportamentais e de uso de serviços de saúde. Florianópolis, 2009.
Variable* Sample
n (%)
Prevalence of Alcohol Use Disorders (95%CI) Sex
Feminine Masculine
959 (55.8) 761 (44.2)
9.3 (7.4 – 11.1) 29.9 (26.7 –2) Age (years)
50-59 40-49 30-39 20-29
350 (20.4) 438 (25.5) 392 (22.8) 540 (31.4)
12.9 (9.3 – 16.4) 15.3 (11.9 – 18.7) 15.8 (12.2 – 19.4) 26.5 (22.7 – 30.2) Skin color
White
Light-skinned blacks Dark-skinned blacks
1444 (86.5) 147 (8.8)
87 (5.2)
17.5 (15.6 – 19.5) 27.2 (19.9 – 34.5) 19.5 (11.0 – 28.0) Marital status
Married or with partner Single
Divorced or widowed
1043 (60.6) 503 (29.2) 174 (10.1)
13.9 (11.8 – 16.0) 28.2 (24.3 – 32.2) 17.2 (11.6 – 22.9) Schooling (years of study)
<= 4 5 – 8 >= 11
More than or equal to 12
158 (9.2) 253 (14.4) 568 (33.1) 737 (42.9)
14.5 (9.0 – 20.1) 13.0 (8.9 – 17.2) 20.8 (17.4 – 24.1) 19.4 (16.5 – 22.4) Currently working
Yes No
1329 (77.3) 390 (22.7)
19.6 (17.4 – 21.7) 14.6 (11.1 – 18.1) Per capita income (US$)
Tertile 1 (0 – 333,6) Tertile 2 (333,7 – 745,1) Tertile 3 (745,2 – 19607,8)
564 (33.5) 562 (33.4) 559 (33.2)
14.7 (11.8 – 17.6) 20.1 (16.8 – 23.8) 19.9 (15.9 – 23.4) Self assessment of health
Positive Negative
1373 (79.8) 347 (20.2)
18.7 (16.7 – 20.8) 17.3 (13.3 – 21.3) Chronic Diseases
No Yes
592 (34.6) 1118 (65.4)
18.2 (15.1 – 21.4) 18.5 (16.2 – 20.8) Common Mental Disorder
No Yes
1431 (84.8) 256 (15.2)
18.9 (16.9 – 21.0) 17.2 (12.5 – 21.8) Smoking habit
Never smoked Ex-smoker
Smoker (up to 10 cigarettes a day) Smoker (more than 10 cigarettes a day)
926 (54.1) 449 (26.2) 158 (9.2) 178 (10.4)
11.3 (9.3 – 13.4) 21.6 (17.8 – 25.4) 29.7 (22.5 – 37.0) 37.1 (30.0 – 44.2) Covered by Family Health Program
Yes No
489 (28.7) 1215 (71.3)
14.9 (11.8 – 18.1) 19.8 (17.6 – 22.1) Medical appointment in the last 2 weeks
Yes No
480 (28.0) 1237 (72.0)
14.6 (11.4 – 17.7) 20.0 (17.8 – 22.2)
“*The “skin color” variable presented the lowest number of observations (n =1,678).
Table 2 shows the unadjusted and adjus-ted estimates of prevalence ratios of alcohol use disorders according to the independent variables. In the bivariate analysis, the following findings stood out: the highest prevalence among men (PR = 3.23; 95% CI 2.48 – 4.21); in those between 20 and 29 years of age (PR = 2.06; 95%CI 1.49 – 2.85); single (PR = 2.03; 95%CI 1.66 – 2.49) and smokers of more than 10 cigarettes a day (PR = 3.27; 95%CI 2.51 – 4.26). In addition, skin color, income, FHP coverage and doc-tor appointments were all associated with alcohol use disorders.
In the multivariate analysis, men still presented a prevalence of alcohol use di-sorders three times higher than women. Similarly, those who were not in a stable relationship (single, divorced and widows), young (20 to 29 years of age) and smokers of all intensities presented a higher prevalence of alcohol use disorders. The remaining va-riables did not associate with the outcome in the adjusted analysis. Analysis was also stratified by sex. However, no differences were observed in relation to the global analysis to include it in the study’s results.
Discussion
This study analyzed the prevalence of alcohol use disorders in a medium-sized city in the South of Brazil. The prevalence of alcohol use disorders was 18.4%, being higher among men, young, smokers, sin-gle and divorced or widowed individuals. Approximately 30% were abstainers and one in ten of those interviewed referred that a relative, friend or doctor had shown concern over their drinking habits.
One of the limitations in comparing alcohol use is the diversity of existing scree-ning tests, as each test approaches different aspects such as dependence, abusive use and amount of pure ethanol ingested per day, among others25. The instrument used
in the current study to identify prevalence of alcohol use disorders, the AUDIT, has been recommended by several researchers as the best alternative for detecting alcohol-related
problems, even in household suerveys16, 26.
In addition to alcohol use disorders, the AUDIT can also be stratified to identify ha-zardous, harmful use and possible alcohol dependence. In this study, only potential alcohol use disorders were measured.
A possible limitation of the study was memory as the questions referred to alco-hol use in the past year. This is a period of time long enough for potential forgetting or inaccurate reports of information provided for the research. However, this was minimi-zed by the use of a photo which displayed the kinds of drinks most consumed in the region and the equivalent (in glasses, bottles or cans) to one dose of ethanol.
A further possible limitation was infor-mation as people tend to report patterns of alcohol use which are more socially accep-ted16. In order to avoid this, the interviewers
were instructed not to give opinions or be judgmental about participants’ behavior thus allowing for trustworthy answers. The interviews also took place in a quiet area in the participant’s home and only the parti-cipant and the interviewer were present.
The response rate of the study was 85.3%, similar in all the income deciles of the primary sampling units, which streng-thens external validity of the research. The number of interviews according to sex and age range also presented a similar distri-bution to that estimated by the Brazilian Institute of Geography and Statistics (IGBE) for Florianópolis in 2009.
The prevalence of alcohol use disorders was three times higher among men (29.9%) in relation to women (9.3%). These results are similar to those reported in a national based study conducted by telephone in Brazil in 2009, when alcohol abuse was measured27. The prevalence of the outcome
Table 2 – Association between alcohol use disorders and demographic, socioeconomic and behavioral variables and use of health services. Florianópolis, 2009.
Tabela 2 – Associação entre uso problemático de álcool e variáveis demográicas, socioeconômicas, comportamentais e de uso de serviços de saúde. Florianópolis, 2009.
Variable Unadjusted Adjusted
PR* (95%CI ) P value ** PR* (95%CI ) P value **
1 Sex
Feminine Masculine
1 3.23 (2.48 – 4.21)
<0.001 1 3.18 (2.41 – 4.19)
<0.001
1 Age (years) 50-59 40-49 30-39 20-29
1 1.19 (0.85 – 1.66) 1.23 (0.84 – 1.79) 2.06 (1.49 – 2.85)
<0.001 1 1.18 (0.85 – 1.64) 1.19 (0.83 – 1.72) 1.50 (1.07 – 2.11)
<0.001
1 Skin color White
Light-skinned blacks Dark-skinned blacks
1 1.55 (1.16 – 2.08) 1.12 (0.69 – 1.81)
0.082 1
1.42 (1.07 – 1.90) 1.08 (0.70 – 1.68)
0.146
1 Marital status Married Single
Divorced or Widowed
1 2.03 (1.66 – 2.49) 1,24 (0,82 – 1,87)
<0.001 1 1.59 (1.29 – 1.97) 1.60 (1.11 – 2.30)
<0.001
2 Schooling (years) Less than or equal to 4 5 – 8
9 – 11
More than or equal to 12
1 0.90 (0.50 – 1.62) 1.43 (0.86 – 2.36) 1.33 (0.80 – 2.22)
0.073 1
0.82 (0.49 – 1.38) 1.04 (0.66 – 1.64) 0.98 (0.60 – 1.59)
0.814
2 Working
Yes No
1 0.75 (0.54 – 1.04)
0.083 1
1.03 (0.75 – 1.42)
0.824
2 Per capita income (US$) Tertile 1 (0 – 333,6) Tertile 2 (333,7 – 745,1) Tertile 3 (745,2 – 19607,8)
1 1.37 (1.07 – 1.74) 1.35 (1.01 – 1.81)
0.045 1
1.2 (0.9 – 1.6) 1.2 (0.9 – 1.7)
0.124
3 Self-assessment of health Positive
Negative
1 0.92 (0.69 – 1.24)
0.589 ***
3 Chronic Diseases No
Yes
1 1.01 (0.80 – 1.29)
0.904 ***
3 Common Mental Disorder No
Yes
1 0.91 (0.66 – 1.24)
0.540 ***
3 Smoking habits Never smoked Ex smoker
Up to10 cigarettes/ day More than 10 cigarettes/day
1 1.91 (1.47 – 2.47) 2.62 (1.86 – 3.69) 3.27 (2.51 – 4.26)
<0.001 1 2.17 (1.70 – 2.78) 2.87 (2.01 – 4.10) 3.46 (2.65 – 4.51)
<0.001
4 Covered by the Family Health Program Yes
No
1 1.32 (1.00 – 1.76)
0.047 1
1.05 (0.81 – 1.35) 0.701 4 Medical appointment in the last 2 weeks
Yes No
1 1.37 (1.04 – 1.81)
0.024 1
1.08 (0.83 – 1.40) 0.560
* Prevalence Ratio / * Razão de Prevalência. ** P value on Wald test / ** valor de P no teste de Wald
*** Did not enter on the adjusted model as it had a p value >0.20 on the unadjusted analysis. / *** Não entrou no modelo ajustado, pois apresentou valor de p
difference could be some characteristics of the sample. The study covered all individu-als 15 years of age and over, and included younger and older people, with different patterns of alcohol consumption, and the city had half the number of inhabitants. In relation to the international context, the current study presented a higher prevalence than found in people aged 12 to 65 years in Thailand, where the prevalence of alcohol use disorders measured by the AUDIT was reported as 8.5%28. In a survey conducted on
individuals between 17 and 70 years of age in Hong Kong, employing a questionnaire based on criteria set by the Diagnosis and Statistics Manual of Mental Disorders (DSM IV), a prevalence of 14.4% was found in men and 3.6% in women5. Data from national
surveys on alcohol use carried out on adults from 8 countries from the former Soviet Union reported that 23% of men and 2% of women can be considered high risk users29.
Data from a comparative study between 1991 and 2001, in the United States, indicate that during this time, binge-drinking episo-des per person per year increased by 17%24.
Highest alcohol consumption in men has been reported in the most different regions of the world9 and can be explained by different
aspects such as culture and physiology. In terms of cultural aspects, in some societies, alcohol use is considered a demonstration of masculinity, and women are prohibited from consuming alcohol as a sign of submission to men30. Physiological differences between
men and women were also reported as lower proportional quantities of liquid and higher gastric metabolic rates in women31.
In terms of age, alcohol use disorders were observed in younger people. This finding is consistent with the domestic and international literature on the subject as stated by the World Health Organization10.
Studies conducted in Brazil found similar results, such as Barros in a large city in Southeast Brazil32, as well as in another
research conducted in a medium-sized city in the South of Brazil by Bortoluzzi33. This
pattern of use was also found in research carried out in Australia, where, in addition to
consuming more, young people also present higher risk behaviors related to alcohol use compared to older people34.
Bobo35 indicated that these results can
be related to marketing strategies employed by the alcoholic beverage industry. Publicity campaigns have been developed to target this specific age group by associating alco-hol use to moments of leisure which relax and favor socialization11. In addition, in
Brazil, the product presents a relatively low price and is extremely easy to buy.
Another factor which can be related to high alcohol consumption among young adults is the transitional phase they are experiencing. This phase is characterized by many changes, such as entry into the labor market and the beginning of adult life, leaving them more vulnerable to initiate and maintain alcohol use2. Furthermore,
alcohol is the substance most used by North American youth, a group of individuals who underestimate the negative effects of alcohol and therefore expose themselves to situations of risk which are harmful to their health36.
Marital status also figured as a factor as-sociated with alcohol use disorders. People who were single, divorced or widowed pre-sented a higher prevalence than those who were married. These data are similar to a study conducted in Alberta, Canada37 and
in Russia38. In general, a stable relationship
has been associated with better health con-ditions39 and a decrease in alcohol use
disor-ders is also observed in older relationships40.
According to Leonard41 transition to a
stable relationship can cause a decrease in alcohol use in the same way that divorce can trigger abusive use of this substance. Among men, alcohol consumption is also observed to be lower for individuals in stable relationships, so, marital status could be a protective factor39-40. In consistency with the
literature, this study found an association between alcohol use disorders and use of tobacco. Bobo35 reported that 37% of North
the prevalence of tobacco use in the year prior to the research was lower among peo-ple who had never used alcohol in their life (23%) and increased considerably among individuals who drank. Among the causes of this association, Room43 suggests that
multiple factors should be considered, such as physiopharmacological, psychological and socio-cultural factors.
If we consider pharmacological factors, ethanol and nicotine present effects which are partially opposite and people often use one to reinforce the effects of the other44. As
for physiological factors, Lê45 reported that
repeated use of nicotine stimulates use of alcohol, whereas Chen46 stated that nicotine
reduces the collateral effects of alcohol use. In terms of psychological factors, per-sonality traits, such as impulsiveness and a search for a sensation of satiability, are rela-ted to tobacco and alcohol use in the same way that stressful events in life and chronic stress are associated with the development of dependence on both substances47.
Socio cultural factors can be explained for different reasons. As the use of tobacco and alcohol are culturally classified in simi-lar categories, sometimes as transgressive behaviors, there is a social influence which tends to link their use. Tobacco use is also associated with places where alcohol is con-sumed such as bars, restaurants and night clubs, all reinforcing its use43.
An association between alcohol use disorders and level of schooling was not found in this study. This relationship has caused controversy in several studies29,48,
demonstrating the need for further investi-gations that can clarify this link. Regarding income, the data found in population-based studies have shown discrepancies32. The
most frequent findings refer to the highest “average” intake of alcohol in people with a higher socioeconomic level but the highest prevalence of alcohol use disorders has been found in people with lower social condi-tions6,38. Therefore, new studies are required
to clarify this association.
The use of health services also did not present an association with alcohol use
disorders. This relation also requires further study as health services are considered a privileged space to approach the problem of alcohol use. Interventions conducted by professionals working in Primary Health Care are viable and potentially effective in a public health global approach to reduce inappropriate use of alcohol49.
One of the possibilities to act against alcohol use disorders is the use of screening instruments in association with the Strategy for Diagnosis and Brief Intervention (SDBI)50.
This strategy aims to recognize and assist people in the decision-making process and in their efforts to decrease or stop drinking before the onset of physical, psychological or social problems. Use of this strategy also facilitates an initial approximation and allo-ws for an objective return for the individual, enabling the introduction of brief interven-tion procedures and motivainterven-tion for behavior changes51. This effectiveness has been proved
in several studies52, emphasizing the
impor-tance of training health professionals and the adoption of the SDBI in different health care contexts, considering their proven efficacy and economic viability50.
Knowing the prevalence and factors associated with alcohol use disorders is of extreme relevance in order to subsidize for-mulation and assessment of health program policies, being of interest at all government levels, to society in general and their organi-zations in search for better levels of health.
Acknowledgements
We thank Dr. Nilza Nunes da Silva, School of Public Health of University of São Paulo, São Paulo, Brazil, for her advice on sample procedures. We would like to thank the Brazilian Institute of Geography and Statistics (IBGE) and the Florianópolis Health Authority staff for their useful help with the practical aspects of the study.
Conlicts of Interest
References
1. World Health Organization. Management of substance
abuse: Alcohol. Geneva: World Health Organization; 2011
[cited 2011 July]; Available from: http://www.who.int/ substance_abuse/facts/global_burden/en/index.html
2. Andrade LHSG, Silveira CM, Martins SS, Stor CL, Wang YP, Viana MC. Padrões de consumo do álcool e problemas decorrentes do beber pesado episódico no Brasil. In: Andrade AC, Anthony J, editors. Álcool e
suas conseqüências: abordagem multiconceitual. 1 ed.
Barueri: Minha Editora; 2009.
3. Costa JS, Silveira MF, Gazalle FK, Oliveira SS, Hallal PC, Menezes AM et al. Heavy alcohol consumption and associated factors: a population-based study. Rev Saude
Publica 2004 38(2): 284-91.
4. Kerr WC, Patterson D, Greenfield TK. Differences in the measured alcohol content of drinks between black, white and Hispanic men and women in a US national sample. Addiction 2009; 104(9): 1503-11.
5. Kim JH, Lee S, Chow J, Lau J, Tsang A, Choi J et al. Prevalence and the factors associated with binge drinking, alcohol abuse, and alcohol dependence: a population-based study of Chinese adults in Hong Kong.
Alcohol Alcohol. 2008; 43(3): 360-70.
6. Mendoza-Sassi RA, Béria JU. Prevalence of alcohol use disorders and associated factors: a population-based study using AUDIT in southern Brazil. Addiction 2003; 98(6): 799-804.
7. Clausen T, Rossow I, Naidoo N, Kowal P. Diverse alcohol drinking patterns in 20 African countries. Addiction
2009; 104(7): 1147-54.
8. Bloomfield K, Grittner U, Rasmussen HB, Petersen HC. Socio-demographic correlates of alcohol consumption in the Danish general population. Scand J Public Health
2008; 36(6): 580-8.
9. Worl Health Organization. Alcohol, gender and drinking problems: perspectives from low and middle income
countries. Gèneve: World Health Organization; 2005. p.
241.
10. World Health Organization. WHO Global status report on
alcohol 2004. 1 ed. Geneve; 2004.
11. Pinsky I, El Jundi SA. Alcohol advertising and alcohol consumption among youngsters: review of the international literature. Rev Bras Psiquiatr 2008; 30(4): 362-74.
12. Donovan K, Donovan R, Howat P, Weller N. Magazine alcohol advertising compliance with the Australian Alcoholic Beverages Advertising Code. Drug Alcohol Rev
2007; 26(1): 73-81.
13. Carlini EA, Galduroz JCF, Noto AR, Nappo SA. I Levantamento domiciliar sobre o uso de drogas
psicotrópicas no Brasil: estudo envolvendo as 107 maiores
cidades do país – 2001. São Paulo: CEBRID; 2002.
14. Carlini EA, Galduróz JCF. II Levantamento domiciliar sobre o uso de drogas psicotrópicas no Brasil: Estudo
envolvendo as 108 maiores cidades do país. São Paulo:
CEBRID/UNIFESP; 2006. p. 445.
15. Laranjeira R. I Levantamento Nacional Sobre os Padrões
de Consumo de Álcool na População Brasileira. Brasília:
SENAD; 2007.
16. Babor TF, Higgins-Biddle JC, Saunders JB, Monteiro MG.
AUDIT: The Alcohol Use Disorders Identification Test
Guidelines for Use in Primary Care. 2 ed. Gèneve: World
Health Organization; 2001.
17. World Health Organization. The ICD-10 Classification of Mental and Behavioural Disorders: Diagnostic criteria for
research. Geneve: WHO; 1993.
18. Szwarcwald CL, Viacava F. World health survey in Brazil, 2003. Cad Saude Publica 2005; 21(S): 4-5.
19. Lima CT, Freire AC, Silva AP, Teixeira RM, Farrell M, Prince M. Concurrent and construct validity of the audit in an urban brazilian sample. Alcohol Alcohol 2005; 40(6): 584-9.
20. Reinert DF, Allen JP. The alcohol use disorders identification test: an update of research findings.
Alcohol Clin Exp Res 2007; 31(2): 185-99.
21. Mari JJ, Williams P. A validity study of a psychiatric screening questionnaire (SRQ-20) in primary care in the city of Sao Paulo. Br J Psychiatry 1986; 148: 23-6.
22. Barros AJ, Hirakata VN. Alternatives for logistic regression in cross-sectional studies: an empirical comparison of models that directly estimate the prevalence ratio. BMC Med Res Methodol 2003; 3 :21.
23. Victora CG, Huttly SR, Fuchs SC, Olinto MT. The role of conceptual frameworks in epidemiological analysis: a hierarchical approach. Int J Epidemiol 1997; 26(1): 224-7.
24. Naimi TS, Brewer RD, Mokdad A, Denny C, Serdula MK, Marks JS. Binge Drinking Among US Adults. JAMA 2003; 289(1): 70-5.
25. Corradi-Webster CM, Laprega MR, Furtado EF.
Performance assessment of CAGE screening test among psychiatric outpatients. Rev Lat Am Enfermagem
2005;13(Spec No): 1213-8.
26. Álvarez Montero S, Gallego Casado P, Latorre de la Cruz C, Bermejo Fernández F. Papel del test AUDIT (Alcohol Use Disorders Identification Test) para la detección de consumo excesivo de alcohol. Medifam 2001; 11: 83-7.
27. Brasil. Vigitel Brasil 2009: vigilância de fatores de risco e proteção para doenças crônicas por inquérito telefônico.
28. Assanangkornchai S, Sam-Angsri N, Rerngpongpan S, Lertnakorn A. Patterns of alcohol consumption in the Thai population: results of the National Household Survey of 2007. Alcohol Alcohol 2010; 45(3): 278-85.
29. Pomerleau J, McKee M, Rose R, Haerpfer CW, Rotman D, Tumanov S. Hazardous alcohol drinking in the former Soviet Union: a cross-sectional study of eight countries.
Alcohol Alcohol 2008; 43(3): 351-9.
30. Campbell H. The Glass Phallus: Pub(lic) Masculinity and Drinking in Rural New Zealand. Rural Sociology 2000; 65(4): 562-81.
31. Slutske WS, Piasecki TM, Hunt-Carter EE. Development and initial validation of the Hangover Symptoms Scale: prevalence and correlates of Hangover Symptoms in college students. Alcohol Clin Exp Res 2003; 27(9): 1442-50.
32. Barros MB, Botega NJ, Dalgalarrondo P, Marín-León L, de Oliveira HB. Prevalence of alcohol abuse and associated factors in a population-based study. Rev
Saude Publica 2007; 41(4): 502-9.
33. Bortoluzzi MC, Traebert J, Loguercio A, Kehrig RT. [Prevalence and alcohol user profile in adult population in a south Brazilian city]. Cien Saude Colet 2010; 15(3): 679-85.
34. Livingston M, Room R. Variations by age and sex in alcohol-related problematic behaviour per drinking volume and heavier drinking occasion. Drug Alcohol
Depend 2009; 101(3): 169-75.
35. Bobo JK, Husten C. Sociocultural influences on smoking and drinking. Alcohol Res Health 2000; 24(4): 225-32.
36. National Institute on Alcohol Abuse and Alcoholism (NIAAA). A Call to Action: Changing the Culture of
Drinking at U.S. Colleges. Bethesda: National Institute
on Alcohol Abuse and Alcoholism; 2005.
37. Wild TC, Roberts AB, Cunningham J, Schopflocher D, Pazderka-Robinson H. Alcohol problems and interest in self-help: a population study of Alberta adults. Can J
Public Health 2004; 95(2): 127-32.
38. Malyutina S, Bobak M, Kurilovitch S, Nikitin Y, Marmot M. Trends in alcohol intake by education and marital status in urban population in Russia between the mid 1980s and the mid 1990s. Alcohol Alcohol 2004; 39(1): 64-9.
39. Robles TF, Kiecolt-Glaser JK. The physiology of marriage: pathways to health. Physiol Behav 2003; 79(3): 409-16.
40. Derrick JL, Leonard KE, Quigley BM, Houston RJ, Testa M, Kubiak A. Relationship-specific alcohol expectancies in couples with concordant and discrepant drinking patterns. J Stud Alcohol Drugs 2010; 71(5): 761-8.
41. Leonard KE, Rothbard JC. Alcohol and the marriage effect. J Stud Alcohol Suppl 1999; 13: 139-46.
42. Dawson DA. Drinking as a risk factor for sustained smoking. Drug Alcohol Depend 2000; 59(4): 235-49.
43. Room R. Smoking and drinking as complementary behaviours. Biomed Pharmacother 2004 Mar; 58(2): 111-5.
44. De Leon J, Rendon DM, Baca-Garcia E, Aizpuru F, Gonzalez-Pinto A, Anitua C et al. Association between smoking and alcohol use in the general population: stable and unstable odds ratios across two years in two different countries. Alcohol Alcohol 2007; 42(3): 252-7.
45. Lê AD, Corrigall WA, Harding JW, Juzytsch W, Li TK. Involvement of nicotinic receptors in alcohol self-administration. Alcohol Clin Exp Res 2000; 24(2): 155-63.
46. Chen WJ, Parnell SE, West JR. Nicotine decreases blood alcohol concentration in neonatal rats. Alcohol Clin Exp Res 2001; 25(7): 1072-7.
47. Little HJ. Behavioral mechanisms underlying the link between smoking and drinking. Alcohol Res Health 2000; 24(4): 215-24.
48. Vargas D, Oliveira MA, Araújo EC. Prevalence of alcohol addiction among users of primary healthcare services in Bebedouro, São Paulo State, Brazil. Cad Saude Publica
2009; 25(8): 1711-20.
49. Whitlock EP, Polen MR, Green CA, Orleans T, Klein J, Force USPST. Behavioral counseling interventions in primary care to reduce risky/harmful alcohol use by adults: a summary of the evidence for the U.S. Preventive Services Task Force. Ann Intern Med 2004; 140(7): 557-68.
50. Marques AC, Furtado EF. Brief interventions for alcohol related problems. Rev Bras Psiquiatr 2004; 26(S1): 28-32.
51. Minto EC, Corradi-Webster CM, Gorayeb R, Laprega MR, Furtado EF. Intervenções breves para o uso abusivo de álcool em atenção primária. Epidemiol Serv Saúde 2007; 16: 207-20.
52. Ronzani TM, Rodrigues TP, Batista AG, Lourenço LM, Formigoni MLOdS. Estratégias de rastreamento e intervenções breves para problemas relacionados ao abuso de álcool entre bombeiros. Estudos de Psicologia
(Natal) 2007; 12: 285-90.