Male Use of Female Sex Work in India: A Nationally
Representative Behavioural Survey
Michelle F. Gaffey1, Srinivasan Venkatesh2, Neeraj Dhingra2, Ajay Khera3, Rajesh Kumar4, Paul Arora1, Nico Nagelkerke1, Prabhat Jha1*
1Centre for Global Health Research, Li Ka Shing Knowledge Institute, St. Michael’s Hospital and Dalla Lana School of Public Health, University of Toronto, Toronto, Ontario, Canada,2National AIDS Control Organisation, New Delhi, India,3Ministry of Health and Family Welfare, New Delhi, India,4School of Public Health, Postgraduate Institute of Medical Education and Research, Chandigarh, India
Abstract
Heterosexual transmission of HIV in India is driven by the male use of female sex workers (FSW), but few studies have examined the factors associated with using FSW. This nationally representative study examined the prevalence and correlates of FSW use among 31,040 men aged 15–49 years in India in 2006. Nationally, about 4% of men used FSW in the previous year, representing about 8.5 million FSW clients. Unmarried men were far more likely than married men to use FSW overall (PR = 8.0), but less likely than married men to use FSW among those reporting at least one non-regular partner (PR = 0.8). More than half of all FSW clients were married. FSW use was higher among men in the high-HIV states than in the low-HIV states (PR = 2.7), and half of all FSW clients lived in the high-HIV states. The risk of FSW use rose sharply with increasing number of non-regular partners in the past year. Given the large number of men using FSW, interventions for the much smaller number of FSW remains the most efficient strategy for curbing heterosexual HIV transmission in India.
Citation:Gaffey MF, Venkatesh S, Dhingra N, Khera A, Kumar R, et al. (2011) Male Use of Female Sex Work in India: A Nationally Representative Behavioural Survey. PLoS ONE 6(7): e22704. doi:10.1371/journal.pone.0022704
Editor:Landon Myer, University of Cape Town, South Africa
ReceivedJanuary 13, 2011;AcceptedJuly 5, 2011;PublishedJuly 29, 2011
Copyright:ß2011 Gaffey et al. This is an open-access article distributed under the terms of the Creative Commons Attribution License, which permits unrestricted use, distribution, and reproduction in any medium, provided the original author and source are credited.
Funding:External funding is from the Fogarty International Centre of the US National Institutes of Health (grant R01 TW05991-01), Canadian Institute of Health Research (CIHR; IEG-53506), and Li Ka Shing Knowledge Institute and Keenan Research Centre at St Michael’s Hospital, University of Toronto (unrestricted support). The funders had no role in study design, data collection and analysis, decision to publish, or preparation of the manuscript.
Competing Interests:The authors have declared that no competing interests exist. * E-mail: [email protected]
Introduction
India had about 1.4 to 1.6 million people living with HIV in 2006 [1]. National HIV prevalence at ages 15–49 years is about 0.25–0.28% [1], but varies by region. The four high-HIV prevalence southern states of Andhra Pradesh, Karnataka, Maharashtra and Tamil Nadu account for only 30% of India’s population but about 64% of its HIV infections [2].
HIV transmission in India occurs primarily through heterosex-ual contact [3], with most of it driven by the male use of female sex work [4–6]. As in other Asian settings, the spread of HIV in India, including into the general population, depends largely on the size of the female sex worker (FSW) and client populations and on the rate of their unprotected sexual contact [7].
Previous studies in India have investigated HIV risk behaviour among FSW [8–12] but few studies have examined FSW use among Indian men. Prior research on factors associated with FSW use in India has been limited to high-risk male subpopulations, such as urban homeless men [13], urban sexually transmitted infection (STI) clinic attendees [14], or rural voluntary counselling and testing (VCT) clinic attendees [15], and to general population-based studies in small geographical areas [16,17]. Here we report a nationally representative study on the prevalence and correlates of having any non-regular sex partners (NRP) and of using FSW among men aged 15–49 years in the Indian general population. We also estimate the absolute number of men who used FSW in India in 2006.
Methods
Ethics statement
Participants in Behavioural Surveillance Surveys conducted by India’s National AIDS Control Organisation (NACO) provided informed consent verbally, documented by interviewer signature [18]. This secondary analysis of these data was approved by the ethics review board of St Michael’s Hospital, Toronto, Ontario, Canada.
Study population
NACO conducted national surveys of sexual behaviour in 2001 and 2006. The sampling and data collection methods are published [18,19]. Multi-stage, stratified cluster sampling was used to select a nationally representative probability sample of men and women aged 15–49 years in the general population. In the 2006 round, trained interviewers administered questionnaires in the household to 48 623 men and 48 617 women.
Of the 48 623 men interviewed nationally, we excluded 5417 men from the seven northeastern states (i.e. Arunachal Pradesh, Manipur, Meghalaya, Mizoram, Nagaland, Sikkim and Tripura; about 4% of the national adult male population) where HIV transmission is driven largely by injection drug use [20]. Of the 43 206 men in the remaining 28 states, we excluded 11 936 men who reported no lifetime sexual activity and 230 sexually active men for whom information on NRP in the past year was missing, leaving 31 040 men in the study population. Andhra Pradesh, Karnataka,
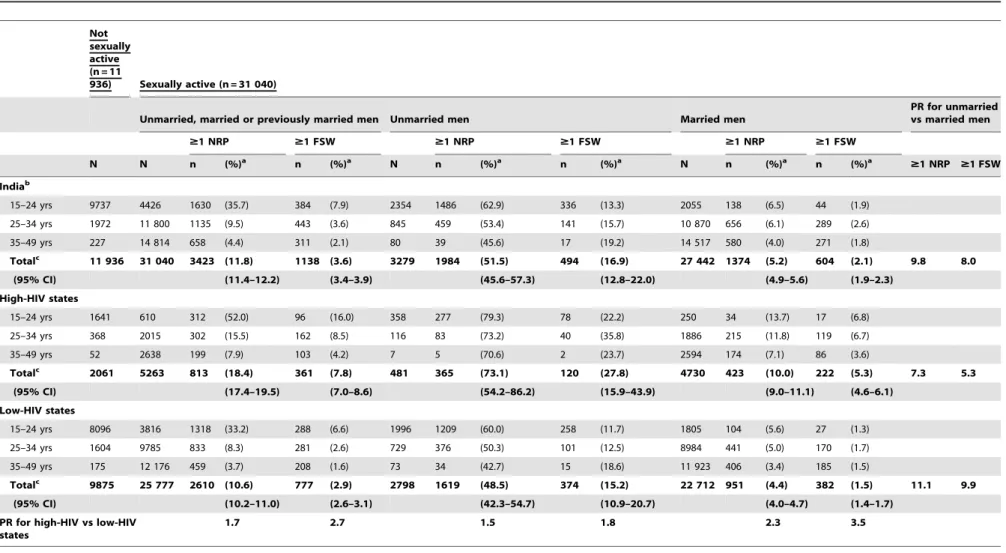
Table 1.Age-standardized prevalences of having non-regular partners and of using female sex work in the past year among Indian men, by region and marital status, 2006.
Not sexually active (n = 11
936) Sexually active (n = 31 040)
Unmarried, married or previously married men Unmarried men Married men
PR for unmarried vs married men
$1 NRP $1 FSW $1 NRP $1 FSW $1 NRP $1 FSW
N N n (%)a n (%)a N n (%)a n (%)a N n (%)a n (%)a
$1 NRP $1 FSW
Indiab
15–24 yrs 9737 4426 1630 (35.7) 384 (7.9) 2354 1486 (62.9) 336 (13.3) 2055 138 (6.5) 44 (1.9)
25–34 yrs 1972 11 800 1135 (9.5) 443 (3.6) 845 459 (53.4) 141 (15.7) 10 870 656 (6.1) 289 (2.6)
35–49 yrs 227 14 814 658 (4.4) 311 (2.1) 80 39 (45.6) 17 (19.2) 14 517 580 (4.0) 271 (1.8)
Totalc 11 936 31 040 3423 (11.8) 1138 (3.6) 3279 1984 (51.5) 494 (16.9) 27 442 1374 (5.2) 604 (2.1) 9.8 8.0
(95% CI) (11.4–12.2) (3.4–3.9) (45.6–57.3) (12.8–22.0) (4.9–5.6) (1.9–2.3)
High-HIV states
15–24 yrs 1641 610 312 (52.0) 96 (16.0) 358 277 (79.3) 78 (22.2) 250 34 (13.7) 17 (6.8)
25–34 yrs 368 2015 302 (15.5) 162 (8.5) 116 83 (73.2) 40 (35.8) 1886 215 (11.8) 119 (6.7)
35–49 yrs 52 2638 199 (7.9) 103 (4.2) 7 5 (70.6) 2 (23.7) 2594 174 (7.1) 86 (3.6)
Totalc 2061 5263 813 (18.4) 361 (7.8) 481 365 (73.1) 120 (27.8) 4730 423 (10.0) 222 (5.3) 7.3 5.3
(95% CI) (17.4–19.5) (7.0–8.6) (54.2–86.2) (15.9–43.9) (9.0–11.1) (4.6–6.1)
Low-HIV states
15–24 yrs 8096 3816 1318 (33.2) 288 (6.6) 1996 1209 (60.0) 258 (11.7) 1805 104 (5.6) 27 (1.3)
25–34 yrs 1604 9785 833 (8.3) 281 (2.6) 729 376 (50.3) 101 (12.5) 8984 441 (5.0) 170 (1.7)
35–49 yrs 175 12 176 459 (3.7) 208 (1.6) 73 34 (42.7) 15 (18.6) 11 923 406 (3.4) 185 (1.5)
Totalc 9875 25 777 2610 (10.6) 777 (2.9) 2798 1619 (48.5) 374 (15.2) 22 712 951 (4.4) 382 (1.5) 11.1 9.9
(95% CI) (10.2–11.0) (2.6–3.1) (42.3–54.7) (10.9–20.7) (4.0–4.7) (1.4–1.7)
PR for high-HIV vs low-HIV states
1.7 2.7 1.5 1.8 2.3 3.5
PR = prevalence ratio; NRP = non-regular partner; FSW = female sex worker; CI = confidence interval.
aPercentages are sample-weighted. bExcludes the northeastern states.
cTotal percentages and 95% CIs are sample-weighted and standardized to the age distribution of all 31 040 sexually active men in the study sample.
doi:10.1371/journal.pone.0022704.t001
Male
Use
of
Female
Sex
Work
in
India
ONE
|
www.plos
one.org
2
July
2011
|
Volume
6
|
Issue
7
|
Maharashtra and Tamil Nadu comprise the four ‘‘high-HIV’’ states and the remaining 24 states comprise the ‘‘low-HIV’’ states, based on HIV prevalence among pregnant women aged 15–24 years in 2001–07 [21,22].
Study variables
Two self-reported outcomes in the previous year were examined: (i) any NRP, and (ii) use of FSW. Socio-demographic characteristics included age, urban residency, level of education and employment in the transport sector. Indicators of knowledge and awareness about HIV/AIDS and STI included awareness of a local HIV testing centre, having heard of STI other than HIV, receiving any interpersonal education about STI or HIV/AIDS in the past year, and having correct knowledge about HIV prevention and transmission. Men were assessed as receiving interpersonal education if they answered positively to either of two questionnaire items: ‘‘Did anyone in the past one year approach you to educate you on the spread of STI/HIV/AIDS?’’ and ‘‘Did anyone in the past one year approach you to educate you on use of condoms to prevent STI/HIV/AIDS?’’ Correct knowledge about HIV prevention and transmission was a composite indicator [23] that included the identification of two primary prevention methods (i.e. having one uninfected, monogamous partner; and correct,
consistent condom use) and the rejection of three myths about transmission (i.e. HIV can be transmitted by mosquito bites or through sharing food with an HIV-infected person, and cannot be transmitted from a healthy-looking person). Sexual behaviour indicators included sexual debut before the age of 17 years, self-reported genital discharge or ulcer/sore in the past year, number of NRP in the past year, consistency of condom use with all NRP, and consistency of condom use with wife. Consistent condom use was defined as ‘‘always’’ using condoms in the past year versus ‘‘sometimes’’ or ‘‘never’’ using condoms.
Data analysis
Analyses were conducted using national sampling weights calculated by NACO to adjust for sex ratio and urban/rural sampling proportion in each state [18]. Prevalences of NRP and of using FSW were stratified by HIV region and marital status, and standardized to the age distribution of all unmarried, married and previously married men in the study population. The analyses of factors associated with using FSW were restricted to men reporting at least one NRP in the past year. Univariate associations between FSW use and explanatory variables were first assessed by Chi-squared tests; a backward stepwise approach was then used to generate multivariate Poisson regression models to estimate
Table 2.Age-standardized prevalence of using female sex work among Indian men reporting any non-regular partner in the past year, by region and marital status, 2006.
Unmarried, married or previously
married men Unmarried men Married men
PR for unmarried vs married men
$1 FSW $1 FSW $1 FSW
N n (%)a N n (%)a N n (%)a
Indiab
15–24 yrs 1630 384 (22.0) 1486 336 (21.1) 138 44 (29.6)
25–34 yrs 1135 443 (37.7) 459 141 (29.4) 656 289 (41.7)
35–49 yrs 658 311 (46.2) 39 17 (42.0) 580 271 (45.4)
Totalc 3423 1138 (30.8) 1984 494 (27.2) 1374 604 (35.9) 0.8
(95% CI) (29.2–32.5) (23.7–30.9) (31.5–40.6)
High-HIV states
15–24 yrs 312 96 (30.7) 277 78 (28.1) 34 17 (50.0)
25–34 yrs 302 162 (54.6) 83 40 (48.8) 215 119 (56.5)
35–49 yrs 199 103 (52.7) 5 2 (33.6) 174 86 (50.9)
Totalc 813 361 (41.5) 365 120 (35.1) 423 222 (52.0) 0.7
(95% CI) (38.1–45.0) (27.4–43.7) (42.7–61.2)
Low-HIV states
15–24 yrs 1318 288 (20.0) 1209 258 (19.5) 104 27 (23.0)
25–34 yrs 833 281 (31.4) 376 101 (24.8) 441 170 (34.7)
35–49 yrs 459 208 (43.3) 34 15 (43.6) 406 185 (43.0)
Totalc 2610 777 (27.4) 1619 374 (25.3) 951 382 (29.9) 0.8
(95% CI) (25.5–29.3) (21.5–29.4) (25.2–35.1)
PR for high-HIV vs low-HIV states
1.5 1.4 1.7
PR = prevalence ratio; FSW = female sex worker; CI = confidence interval. aPercentages are sample-weighted.
bExcludes the northeastern states.
cTotal percentages and 95% CIs are sample-weighted and standardized to the age distribution of all 3423 men in the study sample reporting any non-regular partner in the past year.
doi:10.1371/journal.pone.0022704.t002
Male Use of Female Sex Work in India
Table 3.Factors associated with using female sex work among Indian men reporting any non-regular partner in the past year in the high-HIV states, 2006.
No FSW $1 FSW AdjustedaPR (95% CI)
n (%) n (%)
Unmarried men in the high-HIV states (n = 365)
Socio-demographic characteristics
Residence
Rural 142 (72.8) 55 (27.3) 1.0
Urban 103 (61.1) 65 (38.9) 1.3 (1.0–1.7)
Education
Secondary or higher 221 (71.9) 91 (28.1) 1.0
Primary or none 24 (45.2) 29 (54.8) 1.7 (1.2–2.4)
Employed in transport sector
No 242 (70.1) 108 (29.9) 1.0
Yes 3 (22.0) 11 (78.0) 1.8 (1.1–2.9)
HIV/STI knowledge and awareness
Heard of STI other than HIV
No 95 (60.6) 65 (39.4) 1.0
Yes 149 (74.3) 55 (25.7) 0.6 (0.5–0.8)
Interpersonal STI/HIV/AIDS education in past year
No 158 (65.3) 88 (34.7) 1.0
Yes 87 (73.8) 32 (26.2) 0.7 (0.5–1.0)
Sexual behaviour indicators
Genital discharge or ulcer in past year
No 230 (69.6) 105 (30.4) 1.0
Yes 13 (46.9) 15 (53.2) 1.5 (1.1–2.2)
Number of NRP in past year
1 194 (88.4) 27 (11.6) 1.0
2 or more 49 (35.9) 90 (64.2) 4.6 (3.2–6.7)
Consistent condom use with NRP in past year
No 116 (72.7) 44 (27.3) 1.0
Yes 126 (64.9) 73 (35.1) 2.2 (1.6–3.0)
Married men in the high-HIV states (n = 423)
Socio-demographic characteristics
Residence
Rural 91 (39.3) 137 (60.7) 1.0
Urban 110 (57.7) 85 (42.3) 0.8 (0.7–1.0)
Employed in transport sector
No 185 (52.0) 157 (48.0) 1.0
Yes 16 (21.2) 65 (78.8) 1.3 (1.1–1.6)
HIV/STI knowledge and awareness
Heard of STI other than HIV
No 94 (47.4) 96 (52.6) 1.0
Yes 106 (45.9) 124 (54.1) 0.9 (0.7–1.0)
Interpersonal STI/HIV/AIDS education in past year
No 141 (54.5) 115 (45.5) 1.0
Yes 60 (35.3) 105 (64.7) 1.3 (1.0–1.5)
Sexual behaviour indicators
Number of NRP in past year
1 136 (66.3) 64 (33.7) 1.0
adjusted prevalence ratios. Estimates for the absolute number of FSW clients in 2006 were calculated by applying the stratum-specific sample prevalences of FSW use to the projected 2006 male population in each stratum. The male population for each stratum was derived by combining Indian census projections of the 2006 male population by age and state [24] with Sample Registration System data on the age and marital status distributions of the 2006 male population [25]. Excess risk of using FSW due to having two or more NRP versus one NRP was calculated using the standard formula for attributable fraction (i.e. (RR-1)/RR, where RR is the relative risk of using FSW).
Results
Prevalence of having non-regular partners and of using female sex work
The survey captured information on previous year sexual partnerships for 5263 and 25 777 sexually active men aged 15– 49 years in the high-HIV and low-HIV states respectively, of which 4730 (88%) men and 22 712 (87%) men were married. Among all 31 040 men (unmarried, married or previously married), 3423 men (age standardized prevalence 11.8%; 95%CI 11.4–12.2) reported at least one NRP in the past year and 1138 (3.6%; 3.4–3.9) reported at least one FSW partner (Table 1). Stratified by marital status, prevalences of NRP and of FSW use in the high-HIV states were 1.5 to 3.5 times as high as in the low-HIV states.
Prevalences of any NRP and of using FSW differed sharply by marital status. After standardizing for age, about 52% (1984/3279) of all unmarried men in the sample reported any NRP and about 17% (494/3279) reported FSW use; these prevalences were about 10 and 8 times as high as among married men. About 73% (365/ 481) of unmarried men in the high-HIV states reported any NRP and about 28% (120/481) reported using FSW. The prevalence of any NRP was highest among men aged 15–24 years in both regions, whether unmarried or married. In contrast, FSW use tended to be more prevalent at older ages. However, among married men in the high-HIV states, FSW use was most prevalent in the youngest age group.
Among all 3423 men reporting any NRP, 1138 men (age standardized prevalence 30.8%; 29.2–32.5) reported also using FSW (Table 2). The prevalence of FSW use was greater in the high-HIV states (361/813; 41.5%; 38.1–45.0) than in the low-HIV states (777/2610; 27.4%; 25.5–29.3). Unmarried men were less likely to also report FSW use than married men in both regions (high-HIV states: prevalence ratio (PR) 0.7; low-HIV states: PR 0.8). About 52% (222/423) of married men in the high-HIV states reporting any NRP also reported using FSW, compared to about
30% (382/951) of married men reporting any NRP in the low-HIV states.
Risk factors for using female sex work
Tables 3 and 4 present the variables which were significantly associated with using FSW among men reporting any NRP in the high-HIV states and low-HIV states, respectively, after adjusting for other characteristics and sexual risk behaviours. Three variables were associated with FSW use across all groups of men: having more than one NRP in the past year, consistent condom use with all NRP in the past year, and being employed in the transport sector. The strongest predictor of using FSW was the number of NRP in the past year. In unmarried and married men of each region, the adjusted PR for FSW use increased with increasing number of NRP (Figure 1). Particularly notable was the PR of 5.4 (95% CI 3.7–7.9) among unmarried men reporting three or more NRP in the high-HIV states.
Absolute number of men using FSW
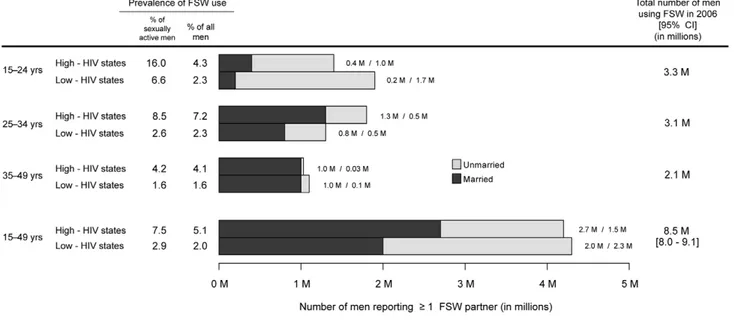
The prevalences of FSW use in our study imply that about 8.5 million (95%CI 8.0–9.1) men aged 15–49 years in India used FSW in 2006 (Figure 2). Half of these men (4.2 million) were located in the high-HIV states, where nearly 8% of sexually active men were FSW clients compared to 3% of sexually active men in the low-HIV states. Nationally, more than half of all clients were married (4.7 million; 55%), with both a larger number and a larger proportion being married in the high-HIV states (2.7 million; 64%) than in the low-HIV states (2.0 million; 47%). The number of clients decreased with age in the low-HIV states, with about 44% (1.9 million) aged 15–24 years, 30% (1.3 million) aged 25–34 years, and 26% (1.1 million) aged 35–49 years. In the high-HIV states however, 33% (1.4 million) were aged 15–24 years, 43% (1.8 million) were aged 25–34 years, and 24% (1.0 million) were aged 35–49 years.
Discussion
Our nationally representative study estimates that in 2006 more than 8 million men aged 15–49 years had at least one FSW partner in the preceding year. The observed patterns of reported FSW use confirm that most HIV transmission in India likely arises from male use of FSW [4–6], with onward transmission to typically monogamous wives [18].
Our results help to explain the higher HIV-prevalence in the four southern high-HIV states: men in these states were almost twice as likely to have NRP (18% vs 11%) and almost three times as likely to use FSW (8% vs 3%) as men in the low-HIV states, and half of all FSW clients in India in 2006 lived in these high-HIV
No FSW $1 FSW AdjustedaPR (95% CI)
n (%) n (%)
Consistent condom use with NRP in past year
No 140 (63.0) 78 (37.1) 1.0
Yes 52 (27.4) 141 (72.6) 1.8 (1.5–2.2)
FSW = female sex worker; PR = prevalence ratio; NRP = non-regular partner; STI = sexually transmitted infection. Frequencies (sample-weighted percentages) for each variable exclude missing data.
aUnmarried model (model n = 352) is adjusted for age and the variables shown in the upper portion of the table; married model (model n = 399) is adjusted for age, education, consistency of condom use with spouse, and the variables shown in the lower portion of the table.
doi:10.1371/journal.pone.0022704.t003
Table 3.Cont.
Male Use of Female Sex Work in India
states. Previous studies in the high-HIV states have identified husbands’ sexual risk behaviour as the most important factor associated with wives’ HIV risk [26,27]. We found that the prevalence of marriage among sexually active men was similar in both regions, but that married men comprised a larger proportion of FSW clients in the high-HIV states than in the low-HIV states
(64% vs 47%) as well as a larger absolute number of FSW clients (2.7 million vs 2.0 million).
Our results also suggest that men with multiple NRP differ from men with only one NRP mainly because they are substantially more likely to use FSW. Thus, 78% and 68% of unmarried clients with multiple NRP in the high-HIV and low HIV states,
Table 4.Factors associated with using female sex work among Indian men reporting any non-regular partner in the past year in the low-HIV states, 2006.
No FSW $1 FSW AdjustedaPR (95% CI)
n (%) n (%)
Unmarried men in the low-HIV states (n = 1619)
Socio-demographic characteristics
Residence
Rural 565 (82.7) 148 (17.3) 1.0
Urban 680 (73.8) 226 (26.3) 1.4 (1.2–1.8)
Education
Secondary or higher 966 (81.2) 258 (18.8) 1.0
Primary or none 279 (73.2) 116 (26.8) 1.3 (1.1–1.7)
Employed in transport sector
No 1200 (80.3) 337 (19.7) 1.0
Yes 45 (55.1) 37 (44.9) 1.6 (1.2–2.1)
Sexual behaviour indicators
Genital discharge or ulcer in past year
No 1177 (80.2) 332 (19.8) 1.0
Yes 66 (63.2) 42 (36.9) 1.7 (1.3–2.3)
Number of NRP in past year
1 850 (89.3) 114 (10.7) 1.0
2 or more 391 (64.0) 252 (36.0) 3.1 (2.4–3.9)
Consistent condom use with NRP in past year
No 606 (84.2) 130 (15.9) 1.0
Yes 628 (74.5) 241 (25.6) 1.5 (1.2–1.9)
Married men in the low-HIV states (n = 951)
Socio-demographic characteristics
Employed in transport sector
No 519 (65.8) 302 (34.2) 1.0
Yes 49 (44.7) 80 (55.3) 1.3 (1.0–1.5)
HIV/STI knowledge and awareness
Aware of local HIV test centre
No 309 (61.2) 220 (38.8) 1.0
Yes 252 (67.2) 151 (32.8) 0.7 (0.6–0.9)
Sexual behaviour indicators
Number of NRP in past year
1 371 (75.4) 135 (24.6) 1.0
2 or more 196 (49.9) 236 (50.1) 2.1 (1.8–2.6)
Consistent condom use with NRP in past year
No 308 (75.8) 113 (24.2) 1.0
Yes 255 (52.0) 260 (48.0) 2.0 (1.6–2.5)
FSW = female sex worker; PR = prevalence ratio; NRP = non-regular partner. Frequencies (sample-weighted percentages) for each variable exclude missing data. aUnmarried model (model n = 1591) is adjusted for age and the variables shown in the upper portion of the table; married model (model n = 906) is adjusted for age,
Figure 1. Adjusted prevalence ratios (95% CI) for use of female sex workers (FSW) comparing men with multiple non-regular partners (NRP) to men with one NRP in the past year in 2006.CI = confidence interval. All prevalence ratios (PR) are adjusted for age and education. PR for unmarried men in the high-HIV states is also adjusted for urban residency, employment in the transport sector, having heard of STI, receiving interpersonal STI/HIV/AIDS education in the past year, genital discharge or ulcer in the past year, and consistency of condom use with NRP in the past year. PR for married men in the high-HIV states is also adjusted for urban residency, employment in the transport sector, having heard of STI, receiving interpersonal STI/HIV/AIDS education in the past year, and consistency of condom use with NRP in the past year. PR for unmarried men in the low-HIV states is also adjusted for urban residency, employment in the transport sector, genital discharge or ulcer in the past year, and consistency of condom use with NRP in the past year. PR for married men in the low-HIV states is also adjusted for employment in the transport sector, awareness of a local HIV test centre, and consistency of condom use with NRP in the past year.
doi:10.1371/journal.pone.0022704.g001
Figure 2. Estimated number of unmarried and married men in India reporting at least one female sex worker (FSW) partner in the past year in 2006.CI = confidence interval. Men from the seven northeastern states (i.e. Arunachal Pradesh, Manipur, Meghalaya, Mizoram, Nagaland, Sikkim and Tripura; about 4% of the national adult male population) are excluded.
doi:10.1371/journal.pone.0022704.g002
Male Use of Female Sex Work in India
respectively, might not have used FSW had they had only one NRP. The excess risk of using FSW was lower (about 50%) among married clients with multiple NRP in both regions, reflecting that among married men, FSW use was common even among those with fewer NRP.
This study of self-reported sexual behaviour suffers some limitations. Social desirability bias, which discourages disclosure, has been observed to be more of a problem in women than in men [28–30]. Indeed, men, especially unmarried men, may exaggerate their NRP [31]. If unmarried men over-reported their FSW use more so than married men in our study, our estimates of the increased risk of FSW use associated with being married may be too low. The effect of such bias on our calculation of the number of FSW clients in 2006 may be limited however, given that more than half of all clients were married. Moreover, an Indian study comparing audio-assisted confidential voting interviewing to face-to-face interviewing in northern India found no difference between the two reporting modes in the proportion of young men reporting NRP or FSW [32]. Finally, we don’t expect such biases to differ between the high-HIV states and low-HIV states, thus not materially affecting our regional comparisons.
While HIV prevention approaches targeted at male users of FSW may also prove effective given the social disempowerment that most FSW in India presently endure [33], the results of our study indicate that the current national strategy of peer-based condom and education interventions for FSW remains the most efficient way to curb heterosexual HIV transmission in India [34,35]. First, the steep relationship between more NRP and higher risk of FSW use, particularly among unmarried men, suggests that few NRP are in fact ‘‘girlfriends’’ or non-commercial partners. Leaving aside homosexual contact (which is estimated to involve only a small proportion of men in India [18]), male and female sexual contacts in a population should be roughly comparable. Whereas about 12% of men reported NRP in India in the past year, only about 3% of women did so (7% and 2% in the high-HIV and low-HIV states, respectively; data not shown). This four-fold difference between men and women (and the large absolute number of male clients) may in part reflect under-reporting of NRP by women, but also suggests the common use of FSW, as has been shown in the United States [36]. Thus, if FSW use accounts for much of male-to-female transmission, then FSW
interventions should reduce downstream HIV transmission, including transmission to wives.
Secondly, clients of FSW reported an average of 2.2 FSW partners in the preceding year (2.2 in the high-HIV states and 2.1 in the low-HIV states; data not shown). The number of FSW contacts is difficult to estimate because the frequency of contact per FSW partner was not measured. Nonetheless, 8.5 million contacts (and likely a much higher number) is a minimum estimate. Highly effective condom and education interventions are thus much more efficiently delivered by focusing on FSW rather than on their clients: about 0.36 million FSW work in the urban areas of the high-HIV states [37] compared to 4.2 million clients in urban and rural areas. (One exception is the feasibility of reaching probable FSW clients by implementing condom and education interventions among men employed in the transport sector.)
Finally, consistent condom use with all NRP in the past year was more likely among clients of FSW than among non-clients in both regions. We could not determine if higher condom use among FSW clients preceded or followed the acquisition of FSW partners, and we found few significant differences between clients and non-clients with respect to various HIV/STI knowledge and awareness indicators. Behavioural surveillance in high-risk groups in India shows that condom use in commercial sex increased between 2001 and 2006 [38]. In the high-HIV states, condom use with the last commercial partner rose from 82% to 95% among FSW and from 81% to 93% among clients. In the low-HIV states, condom use increased from 77% to 87% among FSW and from 75% to 84% among clients (data not shown). It may be that peer-based condom and education interventions for FSW have succeeded in increasing condom use despite persistent low knowledge of HIV/STI transmission, which would be consistent with African data [35].
In sum, we find a large number of men using FSW in India, particularly in the high-HIV states, and our study results argue for ensuring that condom promotion and education interventions for FSW remain a priority to curb HIV transmission in India.
Author Contributions
Conceived and designed the experiments: MFG PJ PA NN. Analyzed the data: MFG PJ PA NN. Contributed reagents/materials/analysis tools: SV ND AK. Wrote the paper: MFG PJ PA NN RK.
References
1. Jha P, Kumar R, Khera A, Bhattacharya M, Arora P, et al. (2010) HIV mortality and infection in India: estimates from nationally representative mortality survey of 1.1 million homes. BMJ 340: c621.
2. Claeson M, Alexander A (2008) Tackling HIV in India: evidence-based priority setting and programming. Health Aff (Millwood) 27(4): 1091–102.
3. National AIDS Control Organisation (2007) Annual Report 2006. New Delhi: Ministry of Health & Family Welfare, Government of India.
4. Kumar R, Jha P, Arora P, Dhingra N, Rao S (2005) HIV-1 trends, risk factors and growth in India. In: Rao S, ed. National Commission on Macroeconomics and Health Background Papers: Burden of Disease in India. New Delhi: Ministry of Health and Family Welfare, Government of India.
5. Nagelkerke NJD, Jha P, de Vlas SJ, Korenromp EL, Moses S, et al. (2002) Modelling HIV/AIDS epidemics in Botswana and India: impact of interventions to prevent transmission. Bull World Health Organ 80(2): 89–96.
6. Venkataramana CB, Sarada PV (2001) Extent and speed of spread of HIV infection in India through the commercial sex networks: a perspective. Trop Med Int Health 6(12): 1040–61.
7. Ruxrungtham K, Brown T, Phanuphak P (2004) HIV/AIDS in Asia. Lancet 364(9428): 69–82.
8. Buzdugan R, Copas A, Moses S, Blanchard J, Isac S, et al. (2010) Devising a female sex work typology using data from Karnataka, India. Int J Epidemiol 39(2): 439–48.
9. Shahmanesh M, Cowan F, Wayal S, Copas A, Patel V, et al. (2009) The burden and determinants of HIV and sexually transmitted infections in a population-based sample of female sex workers in Goa, India. Sex Transm Infect 85(1): 50–59. 10. Ramesh BM, Moses S, Washington R, Isac S, Mohapatra B, et al. (2008) Determinants of HIV prevalence among female sex workers in four south Indian
states: analysis of cross-sectional surveys in twenty-three districts. AIDS 22(Suppl 5): S35–44.
11. Sarkar K, Bal B, Mukherjee R, Saha MK, Chakraborty S, et al. (2006) Young age is a risk factor for HIV among female sex workers—an experience from India. J Infect 53(4): 255–59.
12. Basu IMP, Jana S, Rotheram-Borus MJ, Swendeman D, Lee S, et al. (2004) HIV prevention among sex workers in India. J Acquir Immune Defic Syndr 36(3): 845–52.
13. Talukdar A, Roy K, Saha I, Mitra J, Detels R (2008) Risk behaviors of homeless men in India: a potential bridge population for HIV infection. AIDS Behav 12(4): 613–22.
14. Hernandez AL, Lindan CP, Mathur M, Ekstrand M, Madhivanan P, et al. (2006) Sexual behavior among men who have sex with women, men, and Hijras in Mumbai, India—multiple sexual risks. AIDS Behav 10(4 Suppl): S5–16.
15. Schneider JA, Saluja GS, Oruganti G, Dass S, Tolentino J, et al. (2007) HIV infection dynamics in rural Andhra Pradesh south India: a sexual-network analysis exploratory study. AIDS Care 19(9): 1171–76.
16. Dandona L, Dandona R, Kumar GA, Reddy GB, Ameer MA, et al. (2008) Risk factors associated with HIV in a population-based study in Andhra Pradesh state of India. Int J Epidemiol 37(6): 1274–86.
17. Blanchard JF, Halli S, Ramesh BM, Bhattacharjee P, Washington RG, et al. (2007) Variability in the sexual structure in a rural Indian setting: implications for HIV prevention strategies. Sex Transm Infect 83(Suppl 1): i30–36. 18. National AIDS Control Organisation (2006) National Behavioural Surveillance
19. National AIDS Control Organisation (2001) National Baseline General Population Behavioural Surveillance Survey, 2001. New Delhi: Ministry of Health & Family Welfare, Government of India.
20. National AIDS Control Organisation (2006) Strategy and Implementation Plan—National AIDS Control Programme Phase III (2006-2011). New Delhi: Ministry of Health & Family Welfare, Government of India.
21. Kumar R, Jha P, Arora P, Mony P, Bhatia P, et al. (2006) Trends in HIV-1 in young adults in south India from 2000 to 2004: a prevalence study. Lancet 367(9517): 1164–72.
22. Arora P, Kumar R, Bhattacharya M, Nagelkerke NJ, Jha P (2008) Trends in HIV incidence in India from 2000 to 2007. Lancet 372(9635): 289–90. 23. Family Health International (2000) Behavioral Surveillance Surveys (BSS):
Guidelines for repeated behavioral surveys in populations at risk for HIV. Washington, DC: Family Health International.
24. Registrar General of India (2006) Census of India 2001: Population projections for India and states 2001-2026. New Delhi: Registrar General of India. 25. Registrar General of India (2007) Sample Registration System, Statistical
Report: 2006. New Delhi: Registrar General of India.
26. Gangakhedkar RR, Bentley ME, Divekar AD, Gadkari D, Mehendale SM, et al. (1997) Spread of HIV infection in married monogamous women in India. JAMA 278(23): 2090–92.
27. Newmann S, Sarin P, Kumarasamy N, Amalraj E, Rogers M, et al. (2000) Marriage, monogamy and HIV: a profile of HIV-infected women in south India. Int J STD AIDS 11(4): 250–53.
28. Fenton KA, Johnson AM, McManus S, Erens B (2001) Measuring sexual behaviour: methodological challenges in survey research. Sex Transm Infect 77(2): 84–92.
29. Buve A, Lagarde E, Carael M, Rutenberg N, Ferry B, et al. (2001) Interpreting sexual behaviour data: validity issues in the multicentre study on factors
determining the differential spread of HIV in four African cities. AIDS 15(Suppl 4): S117–26.
30. Wellings K, Collumbien M, Slaymaker E, Singh S, Hodges Z, et al. (2006) Sexual behaviour in context: a global perspective. Lancet 368(9548): 1706–28. 31. Nnko S, Boerma JT, Urassa M, Mwaluko G, Zaba B (2004) Secretive females or
swaggering males? An assessment of the quality of sexual partnership reporting in rural Tanzania. Soc Sci Med 59(2): 299–310.
32. Lenka SR, Thakur JS, Jha P, Kumar R (2011) Performance of audio-assisted confidential voting interview for assessment of sexual behaviour among young adults in Chandigarh Union Territory. Indian J Public Health 55(1): 30–33. 33. Chattopadhyay A, McKaig RG (2004) Social development of commercial sex
workers in India: an essential step in HIV/AIDS prevention. AIDS Patient Care STDS 18(3): 159–168.
34. Jha P, Nagelkerke NJD, Ngugi EN, Prasada Rao JV, Willbond B, et al. (2001) Public health: reducing HIV transmission in developing countries. Science 292(5515): 224–25.
35. Kaul R, Kimani J, Nagelkerke NJ, Fonck K, Keli F, et al. (2002) Reduced HIV risk-taking and low HIV incidence after enrollment and risk-reduction counseling in a sexually transmitted disease prevention trial in Nairobi, Kenya. J Acquir Immune Defic Syndr 30(1): 69–72.
36. Brewer DD, Potterat JJ, Garrett SB, Muth SQ, Roberts JM, et al. (2000) Prostitution and the sex discrepancy in reported number of sexual partners. Proc Natl Acad Sci U S A 97(22): 12385–8.
37. Avahan—The India AIDS Initiative (2008) The business of HIV prevention at scale. New Delhi: Bill & Melinda Gates Foundation.
38. National AIDS Control Organisation (2006) National Behavioural Surveillance Survey (BSS) 2006: Female Sex Workers (FSWs) and Clients of FSWs. New Delhi: Ministry of Health & Family Welfare, Government of India.
Male Use of Female Sex Work in India