Abstract—It is known that the cause of cancer could be due to
the gain of function of an oncoprotein (OCP) or the lost of function of a tumor suppressor protein (TSP). These proteins are potential targets for drugs. Lung cancer is one of the leading causes of death in Taiwan. In this study, differential expressed genes (DEGs) are identified, using the Bioconductor package, via expression dataset generated from human lung adenocarcinoma tumor and adjacent non-tumor tissues. By integrating complementary resources, that is, microarray (ArrayExpress), protein-protein interaction (BioGrid), and protein complex (MIPS); it is found that certain cancer-related DEGs match with known protein complexes. After constructing the lung cancer protein-protein interaction network (PPIN), we performed graph theory analysis of PPIN. Highly dense modules (k-clique communities) are identified,
which are potential cancer-related protein complexes. Up-clique and down-clique genes were used as queries to perform functional annotation clustering on DAVID. Over-represented or enriched biological processes and pathways are determined. Our findings suggest a potential relationship between those processes (as well as pathways) and cancer, which deserve further drug-gene interaction and potential drugs investigation.
Index Terms—lung cancer, microarray data analysis,
protein-protein interactions, protein complexes, enrichment analysis
I. INTRODUCTION
UNGcancer is the leading cause of death in the United States [1] and Taiwan [2]. According to the World Health Organization (WHO) classification, lung cancer can be divided into two major classes: small cell lung cancer (SCLC) and non-small cell lung cancer (NSCLC). NSCLC accounts for more than 85% of all lung cancer cases, and adenocarcinoma is the most common subtype.
It is known that many proteins are associated with human diseases, although very often their precise functional role in disease pathogenesis remains unclear. A strategy to gain a better understanding into the interaction and function of these proteins is to make use of the protein-protein interaction (PPI) data, and construct a set of interaction rules for disease proteins. The recent availability of PPI data has made it possible to study human disease at a system level.
The work of Chien-Hung Huang and Ka-Lok Ng is supported by the National Science Council of Taiwan under grants NSC 101-2221-E-150-088-MY2 and NSC 101-2221-E-468-027, respectively.
Chien-Hung Huang# and Min-You Wu# are with the Department of Computer Science and Information Engineering, National Formosa University, Taiwan 632 (e-mail: [email protected],
[email protected]). # equal contribution
Chi-Ying F. Huang is with Institute of Clinical Medicine, National Yang Ming University, Taiwan 112 (email: [email protected]).
Ka-Lok Ng (corresponding author) is with the Department of Biomedical Informatics, Asia University, Taiwan 41354. (phone: 886-4-23394541; fax: 886-4-23320718; e-mail: [email protected]).
The key challenge facing a disease PPI network is the identification of a node which is related to potential drug target. To address these questions, we first collected lung cancer associated genes and hypothesized that the PPI network, derived from the gene signature, could be analyzed topologically to prioritize potential targets. We further performed gene set enrichment analysis (GSEA) and pathway analysis, and then make use of drug-gene interaction databases and Connectivity Map (cMap) to find potential drugs for the treatment of lung cancer [3]. It is conjectured that a small drug molecule may potentially reverse the disease signature if the molecule-induced signature is significantly negatively correlated with the disease-induced signature in cMap [3]. In other words, both up and down expressed genes are potential therapeutic targets. Therefore, identifying potential drugs to treat lung cancer by using an in silico screening approach followed by empirical validation might be easier and faster than those traditional drug discovery pipelines.
II. METHODOLOGY
A. Input data set
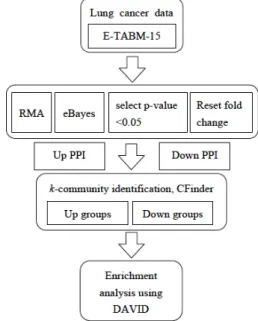
The microarray data for the lung cancer was downloaded from ith experiment ID E-TABM-15. We analyzed a total of 41 samples from, a cohort of 18 patients with cancerous and non-cancerous lung adenocarcinoma tissue via microarray analysis. We conducted two-pair test (normal as well as cancer tissues are taken from the same patient), therefore, only 36 samples are used. Figure 1 shows the system flowchart of this study.
Fig 1. Work flow of the present study.
B. Microarray data analysis
Microarray technology allows for high-throughput
Therapeutic Target Identification for
Lung Cancer
Chien-Hung Huang, Min-You Wu, Chi-Ying F. Huang, and Ka-Lok Ng,
Member, IAENG
L
Proceedings of the International MultiConference of Engineers and Computer Scientists 2013 Vol I, IMECS 2013, March 13 - 15, 2013, Hong Kong
ISBN: 978-988-19251-8-3
ISSN: 2078-0958 (Print); ISSN: 2078-0966 (Online)
screening and analyzing tens of thousands of genes at the same time. Some genes are activated or inhibited differentially expressed genes (DEGs), due to certain regulatory factors; resulting in changes in gene expression levels up to a few times, ten times or more. Given sets of microarray data, one can identify DEGs among a large number of gene expressions, and understand the mechanism of lung cancer formation induced by these DEGs.
There are many microarray data analysis methods, such as using the concept of false discovery rate (FDR) to screen for significant genes [5], using ANOVA to explore the impact of microarray gene expression values within a single factor [6], and clustering analysis. Among the many statistical methods, Significance Analysis of Microarray (SAM) [7-8], Empirical Bayes Analysis of Microarrays (EBAM) [9], and empirical Bayes statistics (eBayes) [10] are three commonly approach employed to screen DEGs. The publicly available microarray data analysis package Bioconductor [11-12] was adopted to perform such calculations.
Statistical method eBayes was chosen in this study because it was found that eBayes, SAM, and EBAM achieve a similar level of cancer gene prediction accuracy [13].
For any gene expression level with fold change less than 5.64 (log250), it was reset to 5.64 in order to facilitate cMap search.
C. Cluster analysis
In a PPI network, a densely connected area is referred to as a cluster, which is a functional module. The nodes of a cluster are usually involved in similar biological processes, and protein complexes can be identified through the clustering of a network [14-15]. It is suggested that a protein complex is a biologically functional module composed of subunits performing similar functions [16].
To investigate the functional modules in which the potential lung cancer related proteins are involved; a set of highly confident human PPIs were input into the CFinder software [17] to analyze the network of PPIs based on the clique percolation clustering approach. A 3-community was set as k being equal to three (complete subgraphs of size k). Any two k-community are adjacent if they share k-1
common nodes. A k-community is constructed by merging all possible adjacent k-cliques.
In this study, we compared the k-community results with known protein complexes obtained from MIPS [18], in order to identify realistic cancer-related protein modules. Subunits from k-community are compared with the MIPS protein complexes. The Jaccard Index (JI) is a quantity which is used to quantify the similarity between two sets, hence, given two modules A and B the JI is given by:
JI(A,B)=|A∩B|
|A∪B|
(1) where |A∩B| and |A∪B| denote the cardinality of
|
|A∩B and |A∪B| respectively. It is noted that JI lies between 0% and 100%.
D. Gene set enrichment analysis (GSEA)
In order to investigate the enriched biological processes
of cancer proteins in the k-communities, the proteins of the
up-group and down-group of proteins were submitted to DAVID [19] for clustering which return annotation terms of
the protein list. Thus, enriched biological processes for these two protein groups were obtained. DAVID provides functional annotation tools which mainly provide typical batch annotation and gene GO [20] term enrichment analysis to highlight the most relevant GO terms associated with a given gene list. Enriched biological processes with E-value less than or equal to 0.05 were examined in this work.
III. RESULTS
A. Microarray data analysis
The most significant DEGs, which consist of up and down regulated genes, predicted by p-values less than 0.05. Among these DEGs, 953 and 1338 genes belong to the up and down group respectively. By integrating these results with the BioGrid [21] PPI data, list of binary interactions among DEGs are determined for the up and down groups.
B. Cluster analysis
PPI among the up and down groups of genes was determined by using the PPI database, BioGrid. It was found that there are 767 and 2045 interactions among the up and down groups of genes respectively. Both of the up-group and down-group data were analyzed by CFinder to identify PPI dense regions. A total of 86 and 483 clusters of
k-community were obtained for the up and down groups respectively. These k-communities were compared with MIPS protein complexes records and their maximum JI
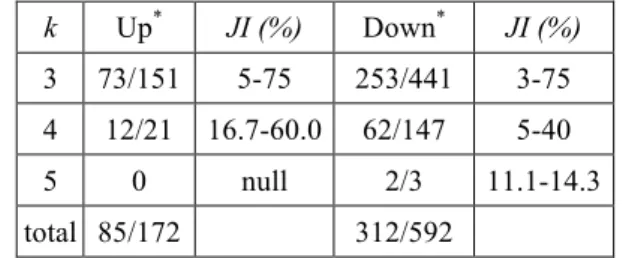
values were computed. The results are summarized in Table 1.
Table 1. Total number of k-community identified by CFinder
k Up* JI (%) Down* JI (%)
3 73/151 5-75 253/441 3-75 4 12/21 16.7-60.0 62/147 5-40
5 0 null 2/3 11.1-14.3
total 85/172 312/592
*
The first number before the slash ( / ) denotes the number of k-community match with the MIPS protein complexes records.
Among the 86 (483) communities identified by CFinder only 85 (312), i.e. 99% (65%), have non-zero JI values. The up-group data seems to have a higher coverage ratio than the down-group. In other words, a few down-group communities do not correspond to any real protein complexes. Nevertheless, the present data indicated that interaction dense regions represent protein complexes in most of the cases. Also, from Table 1, it was found that the
JI interval decreases as k increases, for instance, the JI
interval decreases from 72% to 3.2% for the down-group as
k increases from three to five.
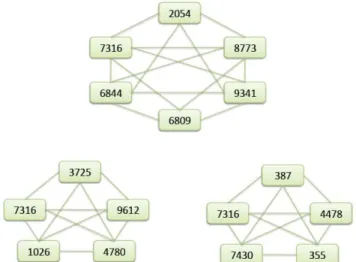
Fig. 2 depicts the results of the three down-group 5-community predicted by CFinder.
Proceedings of the International MultiConference of Engineers and Computer Scientists 2013 Vol I, IMECS 2013, March 13 - 15, 2013, Hong Kong
ISBN: 978-988-19251-8-3
ISSN: 2078-0958 (Print); ISSN: 2078-0966 (Online)
Fig 2. The results of the three down-group 5-community predicted by CFinder, where Entrez gene id is denoted by the number inside the box.
C. Enriched biological processes in PPI interaction
The functional annotation of k-community was given by implementing DAVID. Lists of up and down regulated genes were submitted to DAVID for clustering of the gene annotation terms. Thus, enriched biological processes and pathways related gene lists were obtained.
We performed the analysis using the highest classification stringency. For up-group PPI communities, 33 clusters are returned. In the first annotation cluster, the top over-represented biological processes are mainly enriched in (i) nuclear division, (ii) mitosis cell division (iii) M phase mitotic cell cycle, and (iv) organelle fission. The p-value for each process is smaller than 8x10-14.
The most significant three KEGG pathways returned by DAVID are cell cycle, DNA replication, and p53 signaling pathway. The p-value for each pathway is smaller than 6x10⁻⁶. The most significant three pathways returned by Reactome are (i) cell cycle checkpoint, (ii) cell cycle mitotic, and (iii) DNA replication. The p-value for each pathway is smaller than 10-7.
Table 2 summarized the most significant pathways given by the KEGG and Reactome databases.
Table 2. Summary of significant pathways returned by KEGG and Reactome.
database Up PPI group Down PPI group
KEGG
cell cycle DNA replication p53 signaling
focal adhesion regulation of actin cytoskeleton endocytosis Reactome
cell cycle checkpoint cell cycle mitotic DNA replication
Signalling by NGF Botulinum neurotoxicity Hemostasis
For down-group PPI communities, 105 clusters are returned. For the first annotation cluster, the top over-represented biological processes are mainly enriched in (i) hemopoiesis, (ii) hemopoletic or lymphoid organ development, and (iii) immune system development. The
p-value for each process is smaller than 4x10⁻⁶.
The most significant three KEGG pathways returned by DAVID are focal adhesion), regulation of actin cytoskeleton, and endocytosis. The most significant three
pathways returned by Reactome are (i) signalling by NGF, (ii) botulinum neurotoxicity, and (iii) hemostasis. The p-value for each pathway is smaller than 10-3.
IV. CONCLUSION
In this study, the Bioconductor package is adopted to identify DEGs for lung cancer from microarray data. Both up and down DEGs are identified. It is supposed that they are potential therapeutic targets. By integrating the DEG results with PPI data, it is found that DEGs can be classified into the up-regulated and down-regulated PPI communities. Lung cancer-related protein complexes are identified, suggesting these complexes can potentially play an oncogenic or tumor suppressor role in cancer. It is expected that the approach developed in the current work should be of value for future studies into understanding molecular mechanism of lung cancer formation and identify therapeutic drug targets.
There are several tasks are undergoing or to be completed in the near future. The first one is to perform GSEA and pathway analysis using another clustering service, i.e. ConsensusPathDB [22], to find enriched biological processes and pathways. The results will be cross validated with DAVID. The second task is to determine potential Food and Drug Administration (FDA)–approved drugs using STITCH [23].
REFERENCES
[1] A Jemal et al. “Cancer statistics”, CA Cancer J Clin, 58: pp. 71-96, 2008.
[2] Department of Health tEY. Cancer registry annual report in Taiwan area, Department of Health, Executive Yuan, ROC, 2007.
[3] Lan et al., “From NPC Therapeutic Target Identification to Potential Treatment Strategy," Mol Cancer Ther, 9(9), pp. 2511-2523, 2010. [4] http://www.ebi.ac.uk/arrayexpress
[5] B. Efron and R. Tibshirani, “Empirical bayes methods and false discovery rates for microarrays,” Genet Epidemiol, 23(1), pp.70-86, 2002.
[6] M. K. Kerr, C. A. Afshari, B. Lee, P. Bushel, J. Martinez, N. J. Walker et al., “Statistical analysis of a gene expression microarray experiment with replication,” Statistica Sinica, 12, pp.203-217, 2002. [7] V. Tusher, R. Tibshirani, and G. Chu, “Significance analysis of
microarrays applied to the ionizing radiation response,” Proc Natl Acad Sci, 98(9), pp.5116-5121, 2001.
[8] S. Zhang, “A comprehensive evaluation of SAM, the SAM R-package and a simple modification to improve its performance,” BMC Bioinfo, 8, 230, 2007.
[9] B. Efron, R. Tibshirani, J. Storey, and V. Tusher, “Empirical Bayes Analysis of a Microarray Experiment,” American Statistical Association Journal of the American Statistical Association, 96(456), pp.1151-1160, 2001.
[10] B. Efron, “Robbins, empirical Bayes and microarrays,” Annals of Statistics, 31(2), pp.366-378, 2003.
[11] http://www.bioconductor.org
[12] R. Irizarry, From CEL Files to Annotated Lists of Interesting Genes.In: Bioinformatics and Computational Biology Solutions using R & Bioconductor, pp.431-442, 2005.
[13] Shun-Tsung Chen, Hsing-Fang Wu, Ka-Lok Ng, “A platform for querying breast and prostate cancer-related microNA genes,”
International Conference on Bioinformatics and Biomedical Engineering (ICBBE 2012), 1(1), pp.271-274, 2012.
[14] A. D. King, N. Przulj and I. Jurisica, “Protein Complex Prediction Via Cost-based Clustering,” Bioinfo., 20(17), pp. 3013-3020, 2004. [15] Y. Qi, F. Balem, C. Faloutsos, K. S. Judith and B. J. Ziv, “Protein
Complex Identification by Supervised Graph Local Clustering,”
Bioinfo, 24(13), pp. 250-268, 2008.
[16] J. B. Pereira-Leal, E. D. Levy and S. A. Teichmann, “The Origins and Evolution of Functional Modules: Lessons from Protein Complexes,”
Philos Trans R Soc Lond B Biol Sci, 361(1467), pp.507-517, 2006. Proceedings of the International MultiConference of Engineers and Computer Scientists 2013 Vol I,
IMECS 2013, March 13 - 15, 2013, Hong Kong
ISBN: 978-988-19251-8-3
ISSN: 2078-0958 (Print); ISSN: 2078-0966 (Online)
[17] B. Adamcsek, G. Palla, I. J. Farkas, I. Derenyi and T. Vicsek, “CFinder: Locating Cliques and Overlapping Modules in Biological Networks,” Bioinfo, 22(8), pp. 1021-1023, 2006.
[18] P. Pagel, S. Kovac, M. Oesterheld, B. Brauner, I. Dunger-Kaltenbach, G. Frishman, et al., “The MIPS Mammalian Protein-Protein Interaction Database,” Bioinfo, 21(6), pp. 832-834, 2005.
[19] W. Huang da, B.T. Sherman, R.A. Lempicki, “Systematic and integrative analysis of large gene lists using DAVID bioinformatics resources,” Nature Protocols, 4, pp.44–57, 2009.
[20] Gene Ontology Consortium, “The Gene Ontology (GO) project in 2006,” Nucleic Acids Res, 34, D322–326, 2006.
[21] B.J. Breitkreutz, C. Stark, T. Reguly, I. Boucher, A. Breitkreutz, M. Livstone et al., “The BioGRID interaction database: 2008 update,”
Nucleic Acids Res, 36, D637–640, 2008.
[22] A. Kamburov, C. Wierling, H. Lehrach, R. Herwig, “ConsensusPathDB - a database for integrating human functional interaction networks,” Nucleic Acids Res, 37, D623–8, 2009. [23] M. Kuhn, C. von Mering, M. Campillos, L.J. Jensen, P. Bork P,
“STITCH: interaction networks of chemicals and proteins,” Nucleic Acids Res, 36, D684–688, 2008.
Proceedings of the International MultiConference of Engineers and Computer Scientists 2013 Vol I, IMECS 2013, March 13 - 15, 2013, Hong Kong
ISBN: 978-988-19251-8-3
ISSN: 2078-0958 (Print); ISSN: 2078-0966 (Online)