Gene expression pro
fi
ling analysis of lung
adenocarcinoma
H. Xu
1,2, J. Ma
1, J. Wu
1, L. Chen
1, F. Sun
1, C. Qu
1, D. Zheng
1and S. Xu
11Department of Thoracic Surgery, Harbin Medical University Cancer Hospital, Harbin, Heilongjiang, China 2Laboratory of Medical Genetics, Harbin Medical University, Harbin, Heilongjiang, China
Abstract
The present study screened potential genes related to lung adenocarcinoma, with the aim of further understanding disease pathogenesis. The GSE2514 dataset including 20 lung adenocarcinoma and 19 adjacent normal tissue samples from 10 patients with lung adenocarcinoma aged 45-73 years was downloaded from Gene Expression Omnibus. Differentially expressed genes (DEGs) between the two groups were screened using the t-test. Potential gene functions were predicted using functional and pathway enrichment analysis, and protein-protein interaction (PPI) networks obtained from the STRING database were constructed with Cytoscape. Module analysis of PPI networks was performed through MCODE in Cytoscape. In total, 535 upregulated and 465 downregulated DEGs were identified. These includedATP5D,UQCRC2,UQCR11and genes encoding nicotinamide adenine dinucleotide (NADH), which are mainly associated with mitochondrial ATP synthesis coupled electron transport, and which were enriched in the oxidative phosphorylation pathway. Other DEGs were associated with DNA replication (PRIM1, MCM3, and
RNASEH2A), cell surface receptor-linked signal transduction and the enzyme-linked receptor protein signaling pathway (MAPK1,
STAT3,RAF1, andJAK1), and regulation of the cytoskeleton and phosphatidylinositol signaling system (PIP5K1B,PIP5K1C, and
PIP4K2B). Ourfindings suggest that DEGs encoding subunits of NADH, PRIM1, MCM3, MAPK1, STAT3, RAF1, and JAK1 might be associated with the development of lung adenocarcinoma.
Key words: Lung adenocarcinoma; Pathogenesis; Differentially expressed genes; Protein-protein interaction; Network module
Introduction
Lung cancer is the leading cause of cancer deaths among men and women worldwide. The incidence of lung cancer has shown a rising trend in China, with an average annual growth of 1.63% (1). Pathologically, lung cancer can be divided into small cell and the more common non-small cell histological types. The survival prognosis of non-small cell lung cancer (NSCLC) patients is extremely poor, with an average annual 5-year survival rate of less than 15% (2).
The development of lung adenocarcinoma is a multi-factor and multistage process, with genetic instability con-sidered to be the key cause. In recent years, important progress has been made in understanding the molecular mechanism of lung adenocarcinoma. Kris et al. (3) reported that 60% (252/422) of lung adenocarcinoma tissues harbor a driver mutation, including those in genes encoding Kirsten rat sarcoma viral oncogene (KRAS; 25%), epidermal growth factor receptor (EGFR; 23%), anaplastic lymphoma kinase (ALK; 6%) and proto-oncogene B-Raf (BRAF; 3%). Among these, the EGFR pathway is the main signaling pathway of lung cancer, and the mutation rate of its genes reaches 70%-80% (4). EGFR mutations are usually heterozygotic because the mutant allele is also coupled with gene
amplification. The kinase activity increase of EGFR can lead to the hyperactivation of downstream signal pathways that enhance cell survival. KRAS mutations account for 30%–35% of lung adenocarcinoma genetic variation (5). Around 97% ofKRASmutations in NSCLC occur in codons 12 or 13 (6), and Mills et al. (7) have shown that the sensitive detection ofKRAScodon 12 mutations in bronchoalveolar lavage can help diagnose lung cancer. ALK fusions are observed inB4% of NSCLC patients (8), resulting from an
inversion of EML4 and ALK gene on the short arm of chromosome 2 which constitutively activates the kinase and protein oligomerization (9).
As well as the above genes and pathways, other molecular changes can bring about lung adenocarcinoma, such as mutations inROS(10,11),ERCC1(12),RB(13),
AKT(14),PTEN(15), andMAP2K1(16). Stearman et al. (17) compared orthologous gene expression between human pulmonary adenocarcinoma and a urethane-induced murine model, and identified 409 gene classifiers that showed significant (Po0.0001) and positive correlation in expression
between the two species. Moreover, the detection of prosta-cyclin synthase was found to have a significant prognostic
Correspondence: S. Xu:<[email protected]>
value in patient survival. However, no further investigations have been carried out into changes in metabolic pathways or genes involved in human lung adenocarcinoma.
In this study, therefore, we aimed to obtain an improved insight into lung adenocarcinoma by searching microarray data for differentially expressed genes (DEGs) between lung adenocarcinoma and adjacent normal tissue samples. We also constructed a protein-protein interaction (PPI) network, and performed functional and pathway enrichment analyses of network modules.
Material and Methods
Affymetrix microarray data
The expression profile data of GSE2514 were obtained from a public functional genomics data repository Gene Expression Omnibus (GEO) database (http://www.ncbi.nlm. nih.gov/geo/) (17), which was based on the platform of the Affymetrix Human Genome U95 Version 2 Array. A total of 39 human tissue samples were available for further analysis, of which 20 were lung adenocarcinoma samples and 19 were adjacent normal tissue samples from five males and five females with lung adenocarcinoma, aged 45–73 years. All patients participating in this study were enrolled in a protocol approved by the local Colorado Multiple Institu-tional Review Board for the use of remnant tissues with anonymization and analysis of specimens and clinical data. Tumors were histologically classified according to World Health Organization guidelines and staged according to the tumor-node-metastasis classification. With the exception of two stage III tumors, most tumors were low stage and low to intermediate grade.
Affymetrix CELfiles and probe annotation files were downloaded, and gene expression data of all samples were preprocessed using the GeneChip Robust Multi Array algorithm in the Affy software package (18).
DEG screening
The t-test was used to identify genes that were significantly differentially expressed between lung tumor samples and adjacent normal tissue samples. The raw P-value was adjusted by the Benjamin and Hochberg method (19), and only genes following the cut-off criteria of [log2FC (fold change)]40.5 and adjusted Po0.05 were
selected as DEGs.
Gene ontology (GO) and pathway enrichment analyses
The Database for Annotation, Visualization and Inte-grated Discovery (DAVID) gene functional classification database now provides a set of comprehensive functional annotation tools for investigators to comprehend the biolog-ical meanings behind many genes. Kyoto Encyclopedia of Genes and Genomes (KEGG) pathway enrichment analysis (20) was conducted to identify significant pathways for DEGs. A Po0.05 was used as the cut-off criterion for GO
and KEGG pathway enrichment analyses using default parameters by DAVID.
PPI network construction
The Search Tool for the Retrieval of Interacting Genes (STRING) database provides both experimental and pre-dicted interaction information. This database was used to analyze PPIs for DEGs by calculating their Required Confidence score; a score40.4 was chosen as the cut-off criterion. PPI networks of upregulated and downregulated DEGs were then respectively visualized by Cytoscape (http://cytoscape.org/), which is an open source software for visualizing complex networks and integrating them with any type of attribute data. Hub proteins (essential high-degree proteins in PPI networks) (21,22) were found by counting the connectivity degree of each network node based on the scale-free property of interaction networks. The connectivity degree of each node repre-sents the number of interactions the node has with other nodes.
Screening and analysis of network modules
Network modules were obtained based on the MCODE analysis of original PPI networks. Default parameters (Degree Cutoff: 2, Node Score Cutoff: 0.2, K-Core: 2, Max. Depth: 100) were used as the cut-off criteria for network module screening.
To obtain a better understanding at the molecular level of gene function and to identify pathways closely associated with DEGs, the functional annotation and pathway enrich-ment analysis of network modules with higher MCODE scores were performed using online DAVID software with a threshold of Po0.05.
Results
DEGs between lung tumor and healthy lung tissue cells
After data preprocessing, 11,551 probes were obtained. Based on the cut-off criteria, 1000 DEGs including 535 that were upregulated and 465 downregulated were screened.
GO and KEGG pathway enrichment analyses of upregulated and downregulated DEGs
GO terms of upregulated DEGs were significantly related to RNA processing (P=3.89E-09), RNA splicing (P=3.27E-07), oxidative phosphorylation (P=3.51E-07), and the electron transport chain (P=6.76E-07; Supplementary Table S1). GO terms of downregulated DEGs were mainly related to the regulation of cell motion (P=7.21E-05), morphogenesis of a branching structure (P=8.02E-05), and lung development (P=7.37E-04; Supplementary Table S2).
were enriched in seven pathways, most significantly in vascular smooth muscle contraction (P=1.29E-03), axon guidance (P=3.80E-03), and focal adhesion (P=6.74E-03; Figure 1B).
Construction and analysis of PPI networks
PPI networks for upregulated and downregulated DEGs consisted of 1,591 and 661 pairs of PPIs, respectively (Figure 2A and B).
The connectivity degree of certain genes exceeded 20, including DHX15, NDUFS3, PSMC6, UBE2C, EIF4G1,
DHX9,PSMC3, andHNRNPA2B1 in the upregulated PPI network, andMAPK1,IL6,FN1,MAPK14,STAT3, andVWF
in the downregulated PPI network (Table 1).
Analysis of network modules
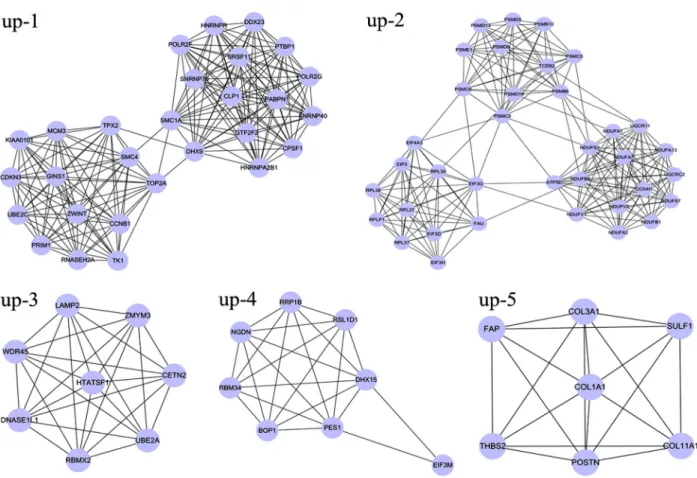
A total of 24 modules including 14 upregulated and 10 downregulated network modules were obtained using default criteria. Among these, five upregulated modules (up-1, up-2, up-3, up-4, and up-5) with nodes 45 and a MCODE score 46 (Figure 3), and six downregulated modules (d-1, d-2, d-3, d-4, d-5, and d-6) with nodes43 and a MCODE score 43 (Figure 4) were selected for enrichment analysis.
Functional enrichment analysis for two upregulated modules (up-1 and up-2) with a higher enrichment score showed that the genes in module up-1 (e.g., DHX9,
HNRNPA2B1,HNRNPR,GTF2F2, and SNRNP40) were mainly enriched in RNA splicing (P=1.53E-17) and mRNA
processing (P=3.94E-14) pathways. Genes in module up-2 (ATP5D, UQCRC2, NDUFS7, NDUFA2, UQCR11,
NDUFB8,NDUFV1,NDUFV2,NDUFA7,NDUFS3,NDUFA1, and NDUFB1) were mainly related to mitochondrial ATP synthesis coupled electron transport (P=1.12E-14), the electron transport chain (P=7.35E-14), and mitochondrial electron transport (P=9.94E-14; Table 2). There were no significant GO terms for genes in modules up-3 or up-4; moreover, the enrichment score of module up-5 was much lower than that of modules up-1 and up-2, so module up-5 GO terms are not listed in Table 2.
Because of their higher enrichment scores and gene numbers, modules up-1 and up-2 were selected for further pathway enrichment analysis. DEGs in module up-1, such asPOLR2G,POLR2F,DDX23,PRIM1,MCM3,TK1,
SNRNP40, SNRNP70, and RNASEH2A, were signifi -cantly enriched in three pathways of pyrimidine metabo-lism (P=1.15E-03), DNA replication (P=5.24E-03), and spliceosome (P=4.41E-02). DEGs in module up-2, such as
ATP5D, UQCRC2,NDUFA2, NDUFB8,NDUFA7,COX4I1,
NDUFA1,NDUFB1,NDUFS7,UQCR11,NDUFV1,NDUFV2, andNDUFS3, were enriched in the pathways of oxida-tive phosphorylation (P=3.31E-13), Parkinson’s disease (P=3.81E-13), Alzheimer’s disease (P=3.25E-11), and Huntington’s disease (P=7.35E-11; Table 3).
The enriched functions for genes in two downregulated modules (d-1 and d-5) with higher enrichment scores showed that genes in module d-1 (e.g.,MAPK1,MAPK14,
MITF, RAF1, JAK1, HBEGF, ROS1, and STAT3) were
related to cell surface receptor linked signal transduction (P=1.71E-03), and enzyme-linked receptor protein signal-ing pathway (P=2.02E-03); while genes in module d-5 (e.g.,PIP5K1B,PIP5K1C,PIP4K2B,CXCL12, andFN1) were mainly enriched in phosphatidylinositol metabolic processes (P=4.24E-04), glycerolipid metabolic processes
(P=1.88E-03), and cell morphogenesis (P=2.06E-02; Table 4). There were no significant GO terms for genes in modules d-2, d-3, d-4, or d-6.
Similarly, because of their higher enrichment scores and gene numbers, modules d-1 and d-5 were selected for further pathway enrichment analysis. Five pathways
Table 1. Differentially expressed genes with the top 10% connectivity degree in upregulated and downregulated protein-protein interaction networks.
Network ID Degree ID Degree ID Degree ID Degree
Upregulated DHX15 28 SRSF11 20 NDUFB8 18 RPL30 16
NDUFS3 26 GTF2F2 20 PAICS 18 PTBP1 16 PSMC6 25 CPSF1 20 UQCR11 18 MCM3 16 UBE2C 25 NDUFV1 19 PRIM1 18 ZWINT 16 EIF4G1 24 SNRNP70 19 HNRNPR 18 ATP5D 16 DHX9 23 PSMD10 19 EIF3G 17 SNRNP40 16 PSMC3 23 SMC1A 19 NDUFV2 17 PABPN1 16 HNRNPA2B1 22 CCNB1 19 COX4I1 17 TOP1 16 POLR2G 21 UQCRC2 18 EIF4A3 17 RNASEH2A 16
TOP2A 21 POLR2F 18 NDUFA1 17 PSMB6 21 DDX23 18 FAU 16
Downregulated MAPK1 41 CD34 19 RAF1 13 ELN 12
IL6 33 HBEGF 16 BCL6 13 ANGPT1 11 FN1 32 CAV1 16 ARRB2 13 MGP 11 MAPK14 25 ZHX2 15 RXRA 12 SMAD4 11 STAT3 22 CXCL12 14 JAK1 12 NR1H2 11 VWF 20 NCOR2 14 CDH5 12 SDC2 11
were enriched for genes in the module d-1 (MAPK1,MITF,
RAF1,JAK1, andSTAT3): pancreatic cancer (P=5.47E-04), melanoma (P=8.52E-03), melanogenesis (P=1.48E-02), acute myeloid leukemia (P=7.67E-03), and cancer pathways (P=3.69E-03). Four pathways were enriched for genes in module d-5 (e.g.,PIP5K1B,PIP5K1C,FN1, andPIP4K2B): regulation of the actin cytoskeleton (P=4.61E-03), inositol phosphate metabolism (P=1.56E-02), the phosphatidylinositol signaling system (P=2.90E-02), and Fc gamma R-mediated phagocytosis (P=4.57E-02; Table 5).
Discussion
In this study, 535 genes were identified as significantly upregulated and 465 as downregulated in lung adenocar-cinoma samples compared with normal adjacent tissue samples. Based on functional and pathway enrichment analyses of two upregulated modules, the identified DEGs (ATP5D,UQCRC2,NDUFA2,NDUFB8,NDUFA7,NDUFA1,
NDUFB1, NDUFS7, UQCR11, NDUFV1, NDUFV2, and
NDUFS3) were mainly related to mitochondrial ATP syn-thesis coupled electron transport, the respiratory electron
transport chain, and mitochondrial electron transport. These genes were therefore enriched in the oxidative phosphoryla-tion pathway.
DEGs such asNDUFA2,NDUFB8,NDUFA7,NDUFA1,
NDUFB1, NDUFS7, NDUFV1, NDUFV2, and NDUFS3
jointly encode subunits of nicotinamide adenine dinucleotide (NADH):ubiquinone oxidoreductase (complex I) (23). NADH is the entry enzyme of mitochondrial oxidative phosphor-ylation (24), which plays a key role in mitochondrial respira-tion. Mitochondrial respiration is thought to be vital to the bioenergetics of cancer cells, with breast, glioma, and cervical cancer cells shown to be highly reliant on mitochondrial respiration for ATP generation (25–27). It was also shown that mitochondrial respiration is substantially enhanced in NSCLC cells (28), while inhibition of mitochondrial electron transport prevents the growth of human lung cancer A549 cells (29).
NDUFS1is already considered to be a prognostic marker for NSCLC (30), so we predict that the DEGs NDUFA2,
NDUFB8,NDUFA7,NDUFA1,NDUFB1,NDUFS7,NDUFV1,
NDUFV2, andNDUFS3play an important role in lung adeno-carcinoma carcinogenesis, and may become diagnostic markers for lung cancer. However, this should be confirmed
in future in-depth studies. Similarly,UQCRC2and UQCR11
may contribute to the occurrence of lung adenocarcinoma. They encode the ubiquinol-cytochrome c reductase complex, which is responsible for carrying electrons from ubiquinol to cytochrome c in the mitochondrial respiratory chain (31).
Moreover,ATP5D, which encodes a subunit of mitochondrial ATP synthase, is associated with mitochondrial ATP synthesis coupled electron transport in lung adenocarcinoma cells (32). DEGs such as PRIM1, MCM3, and RNASEH2A, related to DNA replication, were also upregulated in lung
Table 2.Enriched functions for genes in upregulated modules with a higher enrichment score.
Module/Term Description Count P DEGs
up-1
GO:0000375 RNA splicing, via transesterification reactions
14 1.53E-17 PABPN1,POLR2G,DHX9,POLR2F,HNRNPA2B1, PTBP1,HNRNPR,DDX23,CLP1,GTF2F2y
GO:0000377 RNA splicing, via transesterification reactions with bulged adenosine as
nucleophile
14 1.53E-17 PABPN1,POLR2G,DHX9,POLR2F,HNRNPA2B1, PTBP1,HNRNPR,DDX23,CLP1,GTF2F2y
GO:0000398 Nuclear mRNA splicing, via spliceosome
14 1.53E-17 PABPN1,POLR2G,DHX9,POLR2F,HNRNPA2B1, PTBP1,HNRNPR,DDX23,CLP1,GTF2F2y
GO:0008380 RNA splicing 14 1.03E-14 PABPN1,POLR2G,DHX9,POLR2F,HNRNPA2B1, PTBP1,HNRNPR,DDX23,CLP1,GTF2F2y
GO:0006397 mRNA processing 14 3.94E-14 PABPN1,POLR2G,DHX9,POLR2F,HNRNPA2B1, PTBP1,HNRNPR,DDX23,CLP1,GTF2F2y
GO:0016071 mRNA metabolic process 14 2.19E-13 PABPN1,POLR2G,DHX9,POLR2F,HNRNPA2B1, PTBP1,HNRNPR,DDX23,CLP1,GTF2F2y
GO:0006396 RNA processing 14 7.55E-12 PABPN1,POLR2G,DHX9,POLR2F,HNRNPA2B1, PTBP1,HNRNPR,DDX23,CLP1,GTF2F2y
up-2
GO:0006119 Oxidative phosphorylation 12 3.69E-15 UQCRC2,ATP5D,NDUFS7,NDUFA2,UQCR11, NDUFB8,NDUFV1,NDUFV2,NDUFA7,NDUFS3y
GO:0042775 Mitochondrial ATP synthesis coupled electron transport
10 1.12E-14 NDUFS7,NDUFA2,UQCR11,NDUFB8,NDUFV1, NDUFV2,NDUFA7,NDUFS3,NDUFA1,NDUFB1 GO:0042773 ATP synthesis coupled electron
transport
10 1.12E-14 NDUFS7,NDUFA2,UQCR11,NDUFB8,NDUFV1, NDUFV2,NDUFA7,NDUFS3,NDUFA1,NDUFB1 GO:0022904 Respiratory electron transport chain 10 7.35E-14 NDUFS7,NDUFA2,UQCR11,NDUFB8,NDUFV1, NDUFV2,NDUFA7,NDUFS3,NDUFA1,NDUFB1 GO:0006120 Mitochondrial electron transport,
NADH to ubiquinone
9 9.94E-14 NDUFS7,NDUFA2,NDUFB8,NDUFV1,NDUFV2, NDUFA7,NDUFS3,NDUFA1,NDUFB1 GO:0045333 Cellular respiration 11 2.95E-13 UQCRC2,NDUFS7,NDUFA2,UQCR11,NDUFB8,
NDUFV1,NDUFV2,NDUFA7,NDUFS3,NDUFA1y
GO:0022900 Electron transport chain 11 3.41E-13 UQCRC2,NDUFS7,NDUFA2,UQCR11,NDUFB8, NDUFV1,NDUFV2,NDUFA7,NDUFS3,NDUFA1y
GO:0015980 Energy derivation by oxidation of organic compounds
11 2.93E-11 UQCRC2,NDUFS7,NDUFA2,UQCR11,NDUFB8, NDUFV1,NDUFV2,NDUFA7,NDUFS3,NDUFA1y
GO:0006091 Generation of precursor metabolites and energy
13 1.87E-10 ATP5D,UQCRC2,NDUFA2,NDUFB8,NDUFA7, COX4I1,NDUFA1,NDUFB1,NDUFS7,UQCR11y
GO:0055114 Oxidation reduction 11 6.10E-06 UQCRC2,NDUFS7,NDUFA2,UQCR11,NDUFB8, NDUFV1,NDUFV2,NDUFA7,NDUFS3,NDUFA1y
GO:0016310 Phosphorylation 12 3.35E-05 UQCRC2,ATP5D,NDUFS7,NDUFA2,UQCR11, NDUFB8,NDUFV1,NDUFV2,NDUFA7,NDUFS3y
GO:0006793 Phosphorus metabolic process 12 1.78E-04 UQCRC2,ATP5D,NDUFS7,NDUFA2,UQCR11, NDUFB8,NDUFV1,NDUFV2,NDUFA7,NDUFS3y
GO:0006796 Phosphate metabolic process 12 1.78E-04 UQCRC2,ATP5D,NDUFS7,NDUFA2,UQCR11, NDUFB8,NDUFV1,NDUFV2,NDUFA7,NDUFS3y
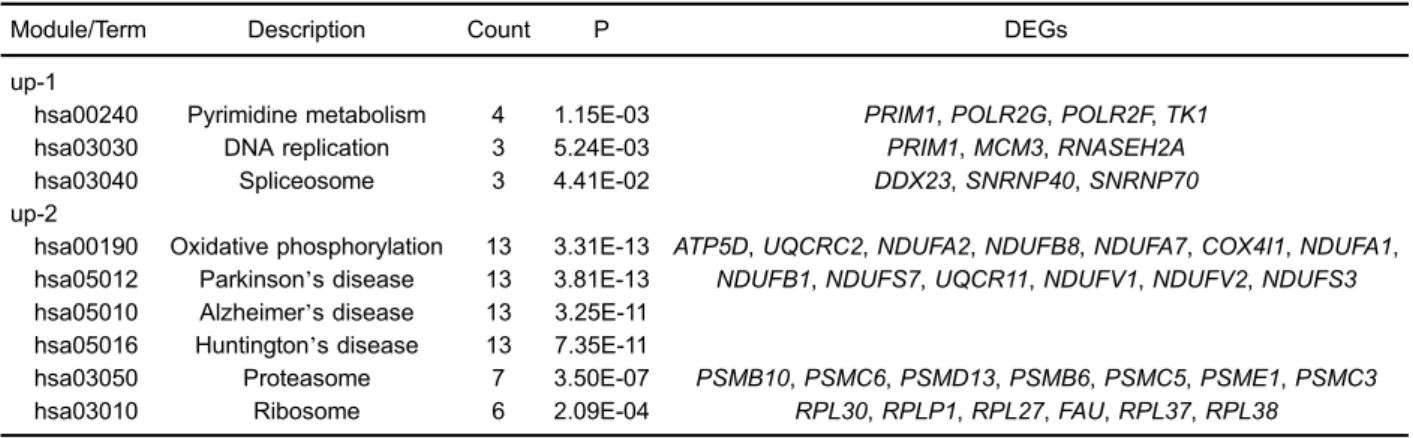
Table 3.Enriched KEGG pathways for genes in upregulated modules with a higher enrichment score.
Module/Term Description Count P DEGs
up-1
hsa00240 Pyrimidine metabolism 4 1.15E-03 PRIM1,POLR2G,POLR2F,TK1 hsa03030 DNA replication 3 5.24E-03 PRIM1,MCM3,RNASEH2A hsa03040 Spliceosome 3 4.41E-02 DDX23,SNRNP40,SNRNP70 up-2
hsa00190 Oxidative phosphorylation 13 3.31E-13 ATP5D,UQCRC2,NDUFA2,NDUFB8,NDUFA7,COX4I1,NDUFA1, hsa05012 Parkinson’s disease 13 3.81E-13 NDUFB1,NDUFS7,UQCR11,NDUFV1,NDUFV2,NDUFS3 hsa05010 Alzheimer’s disease 13 3.25E-11
hsa05016 Huntington’s disease 13 7.35E-11
hsa03050 Proteasome 7 3.50E-07 PSMB10,PSMC6,PSMD13,PSMB6,PSMC5,PSME1,PSMC3 hsa03010 Ribosome 6 2.09E-04 RPL30,RPLP1,RPL27,FAU,RPL37,RPL38
KEGG: Kyoto Encyclopedia of Genes and Genomes; DEGs: differentially expressed genes.
Table 4.Enriched functions for genes in downregulated modules with a higher enrichment score.
Module/Term Description Count P DEGs
d-1 (Enrichment score = 2.57)
GO:0007166 Cell surface receptor linked signal transduction
8 1.71E-03 MAPK1,MAPK14,MITF,RAF1,JAK1,HBEGF, ROS1,STAT3
GO:0007167 Enzyme linked receptor protein signaling pathway
5 2.02E-03 RAF1,JAK1,HBEGF,ROS1,STAT3
GO:0007169 Transmembrane receptor protein tyrosine kinase signaling pathway
4 5.64E-03 RAF1,HBEGF,ROS1,STAT3
d-1 (Enrichment score = 2.05)
GO:0007166 Cell surface receptor linked signal transduction
8 1.71E-03 MAPK1,MAPK14,MITF,RAF1,JAK1,HBEGF, ROS1,STAT3
GO:0007242 Intracellular signaling cascade 7 4.96E-03 ZFP36,MAPK1,DUSP1,MAPK14,RAF1,JAK1,STAT3 GO:0006793 Phosphorus metabolic process 6 9.78E-03 MAPK1,DUSP1,MAPK14,RAF1,JAK1,ROS1 GO:0006796 Phosphate metabolic process 6 9.78E-03 MAPK1,DUSP1,MAPK14,RAF1,JAK1,ROS1 GO:0006468 Protein amino acid phosphorylation 5 1.42E-02 MAPK1,MAPK14,RAF1,JAK1,ROS1 GO:0007265 Ras protein signal transduction 3 1.44E-02 MAPK1,MAPK14,RAF1 GO:0016310 Phosphorylation 5 2.54E-02 MAPK1,MAPK14,RAF1,JAK1,ROS1 d-5 (Enrichment score = 2.22)
GO:0046488 Phosphatidylinositol metabolic process
3 4.24E-04 PIP5K1B,PIP5K1C,PIP4K2B
GO:0046486 Glycerolipid metabolic process 4 1.88E-03 CAV1,PIP5K1B,PIP5K1C,PIP4K2B GO:0030384 Phosphoinositide metabolic process 3 5.23E-03 PIP5K1B,PIP5K1C,PIP4K2B GO:0006650 Glycerophospholipid metabolic process 3 1.38E-02 PIP5K1B,PIP5K1C,PIP4K2B GO:0006644 Phospholipid metabolic process 3 2.76E-02 PIP5K1B,PIP5K1C,PIP4K2B GO:0019637 Organophosphate metabolic process 3 3.12E-02 PIP5K1B,PIP5K1C,PIP4K2B d-5 (Enrichment score = 1.83)
GO:0032989 Cellular component morphogenesis 5 3.71E-03 MYH11,GJA1,PIP5K1C,CXCL12,FN1 GO:0031175 Neuron projection development 4 9.35E-03 IL6,GJA1,PIP5K1C,CXCL12 GO:0048666 Neuron development 4 1.90E-02 IL6,GJA1,PIP5K1C,CXCL12 GO:0000902 Cell morphogenesis 4 2.06E-02 GJA1,PIP5K1C,CXCL12,FN1 GO:0030030 Cell projection organization 4 2.16E-02 IL6,GJA1,PIP5K1C,CXCL12 GO:0030182 Neuron differentiation 4 3.39E-02 IL6,GJA1,PIP5K1C,CXCL12
adenocarcinoma cells in the present study. Lung adeno-carcinoma is a form of solid tumor, and its biological behavior including formation, development, and attack is closely related to abnormal cell proliferation, which includes DNA replication. PRIM1 encodes one of the subunits (p49) of the eukaryotic primase, which is a heterodimer consisting of a small and a large subunit that synthesizes RNA primers for the Okazaki fragments during discontinuous DNA replication (33). MCM3
encodes a major control factor in eukaryotic DNA repli-cation initiation and extension (34,35), whileRNASEH2A
codes for a subunit of the ribonuclease H2 complex which helps break down RNA from RNA-DNA hybrids formed during DNA replication (36). Therefore, these identified DEGs are thought to play important roles in lung adenocarcinoma.
Some DEGs in downregulated modules, such as MAPK1, STAT3, RAF1, and JAK1, are enriched in cell surface receptor linked signal transduction and the enzyme linked receptor protein signaling pathway. MAPK1 in the MAPK family is also known as extracellular signal-regulated kinase2 (ERK2), and is involved in cell proliferation. Moreover, the ERK pathway is known to be activated during the early stages of lung adenocarcinoma (37,38). RAF is a proto-oncogene, encoding a serine/threonine protein kinase that functions in the highly conserved Ras-Raf-MEK-ERK signal transduction pathway, and provides an important link between Ras and ERK signaling activation. RAF1 in the RAF family encodes Raf1 kinase, which is reported to be expressed abnormally in
human lung adenocarcinomas (39). Finally, the JAK/STAT3 signaling pathway plays an essential part in the formation of NSCLC (40). Hence, it appears that these genes might be involved in the formation and development of lung adenocarcinoma.
In conclusion, we have identified DEGs that might be involved in the pathogenesis of lung adenocarcinoma. In particular, the upregulated DEGs (e.g., PRIM1, MCM3,
RNASEH2A,UQCRC2,UQCR11I,ATP5D,PRIM1, MCM3,
RNASEH2A, and DEGs encoding subunits of NADH) and downregulated DEGs (e.g., MAPK1, STAT3, RAF1, and
JAK1) in network modules related to important functions and pathways might provide novel insights into the molecular mechanisms underlying lung adenocarcinoma and serve as therapeutic targets. However, our findings should be confirmed by further experiments, and lung adenocarcinoma at different stages should be investigated.
Supplementary Material
Click here to view [pdf]
Acknowledgements
We thank Harbin Medical University College of Bioinfor-matics Science and Technology for help with the analysis of biological information data. This study was funded by the Health and Family Planning Commission of Heilongjiang Province (Grant #2014-359).
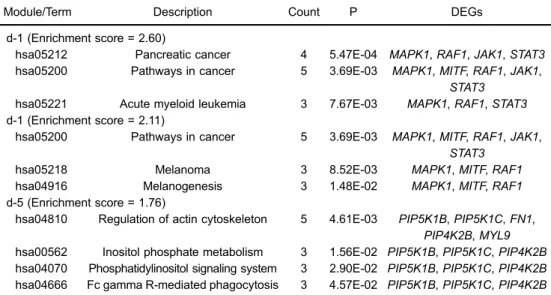
Table 5.Enriched KEGG pathways for genes in downregulated modules with a higher enrichment score.
Module/Term Description Count P DEGs
d-1 (Enrichment score = 2.60)
hsa05212 Pancreatic cancer 4 5.47E-04 MAPK1,RAF1,JAK1,STAT3 hsa05200 Pathways in cancer 5 3.69E-03 MAPK1,MITF,RAF1,JAK1,
STAT3 hsa05221 Acute myeloid leukemia 3 7.67E-03 MAPK1,RAF1,STAT3 d-1 (Enrichment score = 2.11)
hsa05200 Pathways in cancer 5 3.69E-03 MAPK1,MITF,RAF1,JAK1, STAT3
hsa05218 Melanoma 3 8.52E-03 MAPK1,MITF,RAF1 hsa04916 Melanogenesis 3 1.48E-02 MAPK1,MITF,RAF1 d-5 (Enrichment score = 1.76)
hsa04810 Regulation of actin cytoskeleton 5 4.61E-03 PIP5K1B,PIP5K1C,FN1, PIP4K2B,MYL9 hsa00562 Inositol phosphate metabolism 3 1.56E-02 PIP5K1B,PIP5K1C,PIP4K2B hsa04070 Phosphatidylinositol signaling system 3 2.90E-02 PIP5K1B,PIP5K1C,PIP4K2B hsa04666 Fc gamma R-mediated phagocytosis 3 4.57E-02 PIP5K1B,PIP5K1C,PIP4K2B
References
1. Chen WQ, Zhang SW, Zou XN. Estimation and projection of lung cancer incidence and mortality in China.Chin J Lung Cancer2010; 13: 488–493.
2. Parkin DM, Bray F, Ferlay J, Pisani P. Global cancer statistics, 2002.CA Cancer J Clin2005; 55: 74–108, doi: 10.3322/canjclin.
55.2.74.
3. Kris M, Johnson B, Kwiatkowski D, Iafrate A, Wistuba I, Aronson S, et al. Identification of driver mutations in tumor specimens from 1,000 patients with lung adenocarcinoma: The NCI’s Lung Cancer Mutation Consortium (LCMC). J Clin Oncol2011; 29 (15 Suppl).
4. Mollberg N, Surati M, Demchuk C, Fathi R, Salama AK, Husain AN, et al. Mind-mapping for lung cancer: towards a personalized therapeutics approach. Adv Ther 2011; 28: 173–194, doi: 10.1007/s12325-010-0103-9.
5. Van Damme N, Deron P, Van Roy N, Demetter P, Bols A, Van Dorpe J, et al. Epidermal growth factor receptor and K-RAS status in two cohorts of squamous cell carcinomas. BMC Cancer2010; 10: 189, doi: 10.1186/1471-2407-10-189. 6. Forbes S, Clements J, Dawson E, Bamford S, Webb T, Dogan
A, et al. COSMIC 2005.Br J Cancer2006; 94: 318–322, doi:
10.1038/sj.bjc.6602928.
7. Mills NE, Fishman CL, Scholes J, Anderson SE, Rom WN, Jacobson DR. Detection of K-ras oncogene mutations in bronchoalveolar lavagefluid for lung cancer diagnosis.J Natl Cancer Inst1995; 87: 1056–1060, doi: 10.1093/jnci/87.14.1056.
8. Zhang X, Zhang S, Yang X, Yang J, Zhou Q, Yin L, et al. Fusion of EML4 and ALK is associated with development of lung adenocarcinomas lacking EGFR and KRAS mutations and is correlated with ALK expression.Mol Cancer2010; 9: 188, doi: 10.1186/1476-4598-9-188.
9. Chapman PB, Hauschild A, Robert C, Haanen JB, Ascierto P, Larkin J, et al. Improved survival with vemurafenib in melanoma with BRAF V600E mutation.N Engl J Med2011; 364: 2507–2516, doi: 10.1056/NEJMoa1103782.
10. Takeuchi K, Soda M, Togashi Y, Suzuki R, Sakata S, Hatano S, et al. RET, ROS1 and ALK fusions in lung cancer.Nat Med2012; 18: 378–381, doi: 10.1038/nm.2658.
11. Jun HJ, Johnson H, Bronson RT, de Feraudy S, White F, Charest A. The oncogenic lung cancer fusion kinase CD74-ROS activates a novel invasiveness pathway through E-Syt1 phosphorylation.Cancer Res 2012; 72: 3764–3774,
doi: 10.1158/0008-5472.CAN-11-3990.
12. Friboulet L, Olaussen KA, Pignon JP, Shepherd FA, Tsao MS, Graziano S, et al. ERCC1 isoform expression and DNA repair in non-small-cell lung cancer.N Engl J Med2013; 368: 1101–1110, doi: 10.1056/NEJMoa1214271.
13. Kohno S, Kitajima S, Sasaki N, Muranaka H, Takahashi C. Abstract LB-130: The metabolic function of RB tumor suppressor gene. Cancer Research 2013; 73 (8 Supple-ment): LB-130, doi: 10.1158/1538-7445.AM2013-LB-130. 14. Heavey S, O’Byrne KJ, Gately K. Strategies for co-targeting
the PI3K/AKT/mTOR pathway in NSCLC.Cancer Treat Rev 2014; 40: 445–456, doi: 10.1016/j.ctrv.2013.08.006. 15. Minami D, Takigawa N, Takeda H, Takata M, Ochi N, Ichihara E,
et al. PTEN deficient lung cancer cells are sensitive to the combination of olaparib with cisplatin through suppressing DNA damage signaling.Cancer Research2013; 73 (8 Supple-ment): 2048, doi: 10.1158/1538-7445.AM2013-2048.
16. Marks JL, Gong Y, Chitale D, Golas B, McLellan MD, Kasai Y, et al. Novel MEK1 mutation identified by mutational analysis of epidermal growth factor receptor signaling pathway genes in lung adenocarcinoma.Cancer Res2008; 68: 5524–5528,
doi: 10.1158/0008-5472.CAN-08-0099.
17. Stearman RS, Dwyer-Nield L, Zerbe L, Blaine SA, Chan Z, Bunn PA Jr, et al. Analysis of orthologous gene expression between human pulmonary adenocarcinoma and a carcinogen-induced murine model.Am J Pathol2005; 167: 1763–1775, doi:
10.1016/S0002-9440(10)61257-6.
18. Wu Z, Irizarry R A, Gentleman R, Martinez-Murillo F, Spencer F. A model-based background adjustment for oligonucleotide expression arrays. J Amer Statist Assoc 2004; 99: 909–917, doi: 10.1198/016214504000000683.
19. Benjamini Y, Hochberg Y. Controlling the false discovery rate: a practical and powerful approach to multiple testing. J R Stat Soc Ser B Stat Methodol1995; 289–300. 20. Kanehisa M, Goto S. KEGG: kyoto encyclopedia of genes and
genomes.Nucleic Acids Res2000; 28: 27–30, doi: 10.1093/ nar/28.1.27.
21. Lamb J, Crawford ED, Peck D, Modell JW, Blat IC, Wrobel MJ, et al. The Connectivity Map: using gene-expression signatures to connect small molecules, genes, and disease. Science 2006; 313: 1929–1935, doi: 10.1126/science.1132939.
22. He X, Zhang J. Why do hubs tend to be essential in protein networks?PLoS Genet2006; 2: e88, doi: 10.1371/journal. pgen.0020088.
23. Emahazion T, Brookes AJ. Mapping of the NDUFA2, NDUFA6, NDUFA7, NDUFB8, and NDUFS8 electron trans-port chain genes by intron based radiation hybrid mapping. Cytogenet Cell Genet1998; 82: 114, doi: 10.1159/000015081. 24. Nakamaru-Ogiso E, Han H, Matsuno-Yagi A, Keinan E, Sinha SC, Yagi T, et al. The ND2 subunit is labeled by a photo-affinity analogue of asimicin, a potent complex I inhibitor. FEBS Lett2010; 584: 883–888, doi: 10.1016/j.febslet.2010. 01.004.
25. Guppy M, Leedman P, Zu X, Russell V. Contribution by different fuels and metabolic pathways to the total ATP turnover of proliferating MCF-7 breast cancer cells. Biochem J2002; 364: 309–315, doi: 10.1042/bj3640309.
26. Griguer CE, Oliva CR, Gillespie GY. Glucose metabolism heterogeneity in human and mouse malignant glioma cell lines.J Neurooncol2005; 74: 123–133, doi:
10.1007/s11060-004-6404-6.
27. Herst PM, Berridge MV. Cell surface oxygen consumption: a major contributor to cellular oxygen consumption in glyco-lytic cancer cell lines. Biochim Biophys Acta2007; 1767: 170–177, doi: 10.1016/j.bbabio.2006.11.018.
28. Hooda J, Cadinu D, Alam MM, Shah A, Cao TM, Sullivan LA, et al. Enhanced heme function and mitochondrial respiration promote the progression of lung cancer cells. PLoS One 2013; 8: e63402, doi: 10.1371/journal.pone.0063402. 29. Han YH, Kim SH, Kim SZ, Park WH. Antimycin A as a
mitochondrial electron transport inhibitor prevents the growth of human lung cancer A549 cells. Oncol Rep 2008; 20: 689–693.
31. Miyake N, Yano S, Sakai C, Hatakeyama H, Matsushima Y, Shiina M, et al. Mitochondrial complex III deficiency caused by a homozygous UQCRC2 mutation presenting with neonatal-onset recurrent metabolic decompensation.Hum Mutat2013; 34: 446–452, doi: 10.1002/humu.22257.
32. Chen G, Gharib TG, Huang CC, Thomas DG, Shedden KA, Taylor JM, et al. Proteomic analysis of lung adenocarci-noma: identification of a highly expressed set of proteins in tumors.Clin Cancer Res2002; 8: 2298–2305.
33. Copeland WC, Tan X. Active site mapping of the catalytic mouse primase subunit by alanine scanning mutagenesis.J Biol Chem1995; 270: 3905–3913, doi: 10.1074/jbc.270.8.3905.
34. Bell SP, Dutta A. DNA replication in eukaryotic cells.Annu Rev Biochem 2002; 71: 333–374, doi: 10.1146/annurev.
biochem.71.110601.135425.
35. Schwacha A, Bell SP. Interactions between two catalytically distinct MCM subgroups are essential for coordinated ATP hydrolysis and DNA replication.Mol Cell2001; 8: 1093–1104,
doi: 10.1016/S1097-2765(01)00389-6.
36. Crow YJ, Leitch A, Hayward BE, Garner A, Parmar R, Griffith E, et al. Mutations in genes encoding ribonuclease H2 subunits cause Aicardi-Goutieres syndrome and mimic
congenital viral brain infection.Nat Genet2006; 38: 910–916,
doi: 10.1038/ng1842.
37. Voisin L, Saba-El-Leil MK, Julien C, Fremin C, Meloche S. Genetic demonstration of a redundant role of extracellular signal-regulated kinase 1 (ERK1) and ERK2 mitogen-activated protein kinases in promotingfibroblast prolifera-tion. Mol Cell Biol 2010; 30: 2918–2932, doi: 10.1128/
MCB.00131-10.
38. Lopez-Malpartida AV, Ludena MD, Varela G, Garcia PJ. Differential ErbB receptor expression and intracellular signaling activity in lung adenocarcinomas and squamous cell carcinomas.Lung Cancer2009; 65: 25–33, doi: 10.1016/
j.lungcan.2008.10.009.
39. Powell CA, Spira A, Derti A, DeLisi C, Liu G, Borczuk A, et al. Gene expression in lung adenocarcinomas of smokers and nonsmokers.Am J Respir Cell Mol Biol2003; 29:157–162,
doi: 10.1165/rcmb.2002-0183RC.
40. Song L, Rawal B, Nemeth JA, Haura EB. JAK1 activates STAT3 activity in non-small-cell lung cancer cells and IL-6 neutralizing antibodies can suppress JAK1-STAT3 signaling. Mol Cancer Ther 2011; 10: 481–494, doi: