54
THE PROPOSAL MODEL OF RATIONAL WORKFORCE ASSIGNMENT
IN DOKUZ EYLUL UNIVERSITY BY ANALYTIC HIERARCHY
PROCESS BASED 0-1 INTEGER PROGRAMMING
Yılmaz GÖKŞEN1, Hakan AŞAN2, Onur DOĞAN3, Mustafa ÜNLÜ4, Osman PALA5
1Faculty of Business and Economics, Dokuz Eylül University, İzmir, Turkey,
yilmaz.goksen@deu.edu.tr
2İzmir Vocational School, Dokuz Eylül University, İzmir, Turkey, hakan.asan@deu.edu.tr 3İzmir Vocational School, Dokuz Eylül University, İzmir, Turkey, onur.dogan@deu.edu.tr
4Faculty of Business and Economics, Dokuz Eylül University, İzmir, Turkey,
mustafa.unlu@deu.edu.tr
5Faculty of Business and Economics, Dokuz Eylül University, İzmir, Turkey,
osman.pala@deu.edu.tr
Abstract: Production factors include labour, capital, nature and technology in traditional organization management. Nowadays, creativity, innovation and ability can be added to these. Competition is intense both in private and public sectors. Workforce can be said to be the main source enriching the organization and making it complex. What makes the organizational powerful is that talented personnel can make new ideas to be productive by using their creativity. From this point of view workforce productivity is important parameter in organizational efficiency.
Workforce productivity in organizations where there are too many employees is primarily related to employ the personnel in a right position. The appointment of employees to work in accordance with their capabilities increase efficiency. This situation makes the structure of the workforce and make the organization be capable of competing with the rivals. The Assignment model of the type of linear programming models is a mathematical method used to match the right person for the right job. The coefficients of the variables in the objective function of the assignment model constitute potential contributions of employees. Factors that make contributions in different types of jobs are different and expert opinion is needed for the evaluation of these factors. In this study, more than 1000 people who work for Dokuz Eylul University as drivers, food handlers, technicians, office workers, securities and servants are taken into consideration. Gender, level of education, the distance from working place, marital status, number of children and tenure of these employees have been included in the analysis. Analytical hierarchy process which is a method of multi-criteria decision-making model has been preferred as a method. Specific criteria have been determined for each occupational group depending on this method. Later, weighted average for these criteria in question have been found. With these values belonging to the personnel, a person’s contribution coefficients have been calculated. These values are used in the assignment model. This model has been solved and evaluated as 0-1 integer programming. Model outputs that have been solved again by using additional constraints like task type and disability conditions and these are compared with the previous figures.
Key words: Analytical Hierarchy Process, 0-1 integer programming, Assignment Model, Workforce Productivity
1.
INTRODUCTIONWorkers are one of the most important sources for all organizations. Organizations are places where there is a workforce having different characteristics. It is very important for establishments to work with suitable workforce to reach their targets. Having optimal number of workers is important but there are other things that must be managed. These are workforce productivity, employee motivation, right occupation for right person, the management of workforce in the direction of targets of the organization and so forth.
Directors should answer three questions before they judge the performances of their employees. The three questions are these; Are the employees are employed according to their education? Do they have the necessary equipment that they need?, and are all the physical conditions, heat and light present for the work that has to be done? All these three questions must be answered “yes”. But if there are some negative outputs, manager can judge the workforce and decides what to do about them.
Workforce is an input factor that must be managed scientifically. Manager must be supplied with the most correct information before they make a decision. In order to manage the workforce correctly, they can be evaluated. The data obtained on the basis of what has just been mentioned above by quantitative measurement and solutions must be given to the manager.
In this study, analytic hierarchy process (AHP) method has been based upon on the focus of 0-1 integer programming. At this point workforce matrixes, have been formed. And in order to give the right worker to the right work an appointing algorithm has been created.
2. LITERATURE REVIEW
Li and Li (2000) presented multi-objective integer programming formulae for labour force problem in a health foundation. Demand of assignments each category composed sum of appointment and non-appointment costumers. Every duty performing firstly by a class of personnel. But it also can carry out by other personnel with lower productivity. This study aims determining proper mix of labour force that achieving the balance of return and costs of Personnel’s flexibility.
Daskalaki et al. (2004) developed a mathematical model for scheduling lectures problem of an university. They tried to minimize the function which describes the costs of assignments of lectures in that model.
Lin, Lai and Hung (2000) build an integrated labour force management system for 24 hours emergency service. They used a regression or a simulation to associate with hourly required personnel and target unemployment proportion. Then it transformed into daily requirement of senior and subordinate employees by a complicated integer programming approach. They improved Burns and Carter’s algorithm for monthly schedule. Compared to the results made by hand, it was observed that provide a greater degree of constraint satisfaction and considerable time saving.
Ismayilova et al.(2007) developed a multi-objective 0-1 integer linear programming model which considers both teachers and directors preferences. AHP and analytical network process are used for determining the weights of objective function.
56
In 1981, Balachandran and Zoltners developed an integer linear programming model which would provide optimization in audit task planning.
Dodin and Chan (1991) developed integer linear programming to be used in assigning the auditors in a complicated real life audit sphere. Dodin and Elimam (1998) used integer linear programming model in choosing the optimal auditor to be assigned. Gungor et al.(2009) applied fuzzy AHP model for personnel selection problem. They converted all pairwise comparisons into triangular fuzzy numbers and considered criteria as follows: general factors such as work experience, level of foreign language, education, analytical thinking of integrated systems, as basic computer skills, complementary factors such as decision making, team work, and individual factors as age, culture, and appearance. Daneshvar and Erkan (2012) used fuzzy AHP to select academics staff. They used triangular fuzzy numbers as well.
3. THEORETICAL BACKGROUND
Making right decisions for encountered process is important for both individuals and organizations. Many definitions can be made for decision making. Yetim (2003) defines it as “selection of most appropriate in a set of options for at least one goal or criteria”. Briefly, decision making is determining available most appropriate option. Multi-criteria decision making can be handled as a subtitle of problem of decision making. Multi-Attribute (Criteria) Decision Making is the most well-known branch of decision making. It is a branch of a general class of Operations Research (OR) models which deal with decision problems under the presence of a number of decision criteria (Triantaphyllou, 1998).
According to Xu and Yang (2001), Multiple criteria decision making (MCDM) refers to making decisions in the presence of multiple, usually conflicting, criteria. MCDM problems are common in everyday life. In personal context, a house or a car one buys may be characterised in terms of price, size, style, safety, comfort, etc. In business context, MCDM problems are more complicated and usually of large scale.
And also we should add that, there are some MCDM problems also for non-profit organizations (e.g. universities like the case that we are going to handle) and these problems could be complex and challenging.
There is a great number of multi-criteria decision making methods in the literature. We will use AHP and integer programming together in this study.
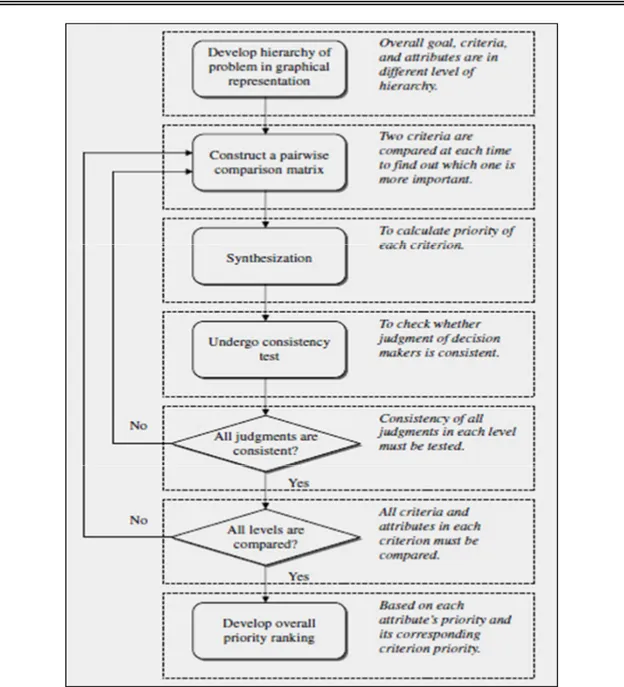
The AHP, which is developed by Saaty (1980), has been used in almost all the applications related with MCDM. And we should note that, AHP is a technique that easy to use integrated with the other techniques.
Fig. 1. The Flowchart of The Analytic Hierarchy Process (Ho Et Al., 2006)
Linear programming model is in the form that it can be used for solving almost every problem of an operation. But in the practice, there are some difficulties arising from type of production or structure of problem. We always face off against impartibility of inputs and outputs in economic life. Such problems can be handled by integer programming (Öztürk, 2002:167).
In the method of integer programming, some or all variables takes integer values.
Generally, integer linear programming (ILP) model could be represent as follows; (Öztürk, 2002: 167);
∑ (3.1)
subject to
∑ 1,2, … , , (3.2)
58
! "" 1,2, … ,
In this study, integrated AHP and ILP models are going to use to solve the workforce productivity problem in Dokuz Eylul University
4. METHODOLOGY
Within Dokuz Eylül University, there are total 1643 personnel which serves as drivers, food handlers, technicians, securities, office personnel and servants. It is planning that re-appointment of these personnel, with faithfully to job descriptions, to faculties, institutes and administrative units of university which placed 10 different campuses. The aim of this re-appointment is to provide maximum two-sided utility with considering both personnel necessities, priorities and also administrator’s priorities, preferences for the positions.
Six type of assignment that mentioned above will be handled in separate models. Because personnel can only employ in positions which agree with their service descriptions. For instance, a personnel which serves as a driver currently can only serve as a driver after the re-appointment. Equality of number of personnel and number of staff won’t be changed after the re-appointment.
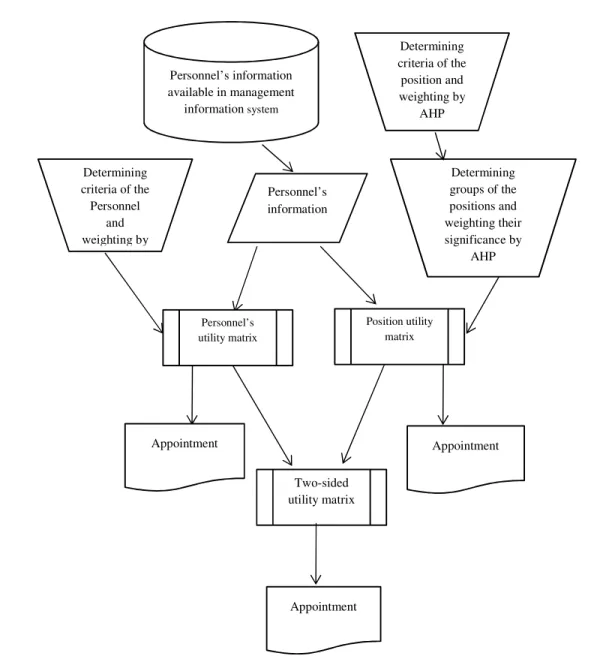
Personnel’s necessities and priorities changes for different types of assignments. After taking expert opinions and collecting information from personnel, we defined necessity and priority criteria for every assignment. Then we weighted these criteria by AHP method. Personnel’s utility matrix obtained by summing of multiplied normalized information with their corresponding weights. Elements of this utility matrix are used as coefficients of 0-1 integer programming appointment model and the results are compared with current situation.
Administrators priorities and preferences for the positions depends on both the unit which the position related to and type of assignment. After taking expert opinions and collecting information from administrators, we defined necessity and priority criteria for every assignments. Then we weighted these criteria by AHP method. Position utility matrix obtained by summing of multiplied normalized information with their corresponding weights. Elements of this utility matrix are used as coefficients of 0-1 integer programming appointment model and the results are compared with current situation.
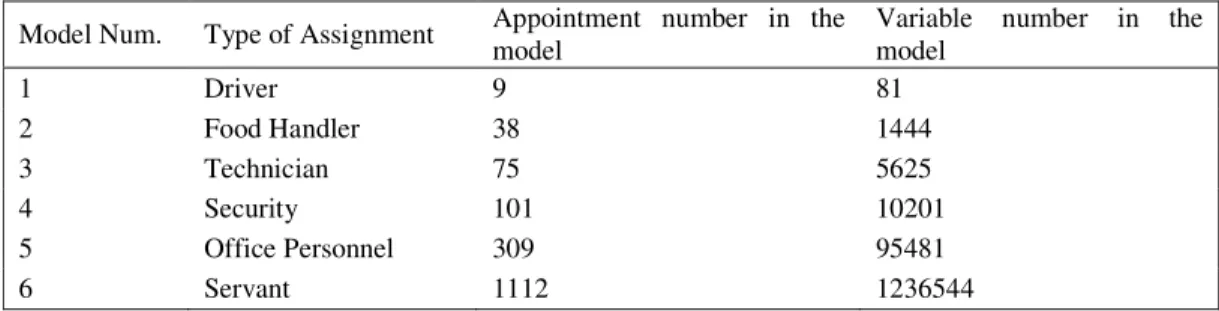
Personnel and position utility matrices are normalized in the next step. Then two-sided utility matrix obtained by summing these two matrices. Appointment model results are compared with current situation. The flow chart of this study can be seen on figure 2. We use six different specific model for each assignment type. Appointments are made in similar ways. Model results are given in Table 1.
Table 1: Models for different assignment
Model Num. Type of Assignment Appointment number in the model Variable number in the model
1 Driver 9 81
2 Food Handler 38 1444
3 Technician 75 5625
4 Security 101 10201
5 Office Personnel 309 95481
Fig. 2: Flow Chart of Appointment Model
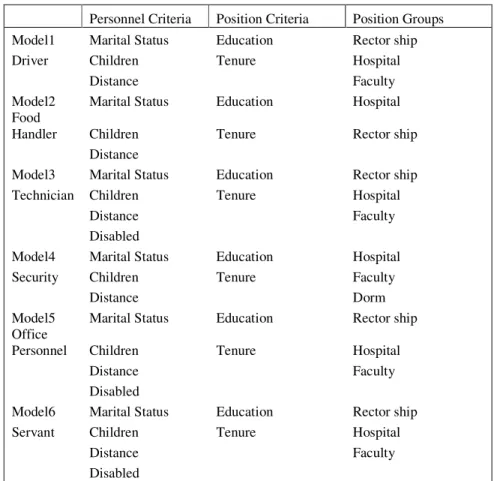
We determine different criteria for each model based on expert and administrator opinions in order to satisfy at maximum level personnel’s necessities, priorities and administrators’ priorities, preferences for the positions. Criteria for model 1 which maximizes total utility are defined as marital status, number of children and distance. Years of education and tenure are criteria for the position in model 1.
Positions are grouped as rector ship, hospital and faculties. Criteria and groups of all models are given in table 2, as follows:
Two-sided utility matrix Personnel’s information
available in management
information system
Personnel’s information Determining
criteria of the Personnel
and weighting by
Determining criteria of the
position and weighting by
AHP
Determining groups of the positions and weighting their significance by
AHP
Appointment
Appointment
Appointment
Personnel’s utility matrix
60
Table 2: Criteria and Groups of All Models
Personnel Criteria Position Criteria Position Groups Model1 Marital Status Education Rector ship Driver Children Tenure Hospital
Distance Faculty
Model2 Marital Status Education Hospital Food
Handler Children Tenure Rector ship
Distance
Model3 Marital Status Education Rector ship Technician Children Tenure Hospital
Distance Faculty
Disabled
Model4 Marital Status Education Hospital Security Children Tenure Faculty
Distance Dorm
Model5 Marital Status Education Rector ship Office
Personnel Children Tenure Hospital
Distance Faculty
Disabled
Model6 Marital Status Education Rector ship Servant Children Tenure Hospital
Distance Faculty
Disabled
We determine different criteria for each model based on expert and administrator opinions in order to satisfy at maximum level personnel’s necessities, priorities and administrators priorities, preferences for the positions. Criteria for model 1 which maximizes total utility are defined as marital status, number of children and distance. Years of education and tenure are criteria for the position in model 1. Positions are grouped as rector ship, hospital and faculties.
After determining criteria and hierarchical structure, we calculate the weights of criteria that maximizes personnel’s utility by AHP. Pairwise comparison matrix for model 1 given by Table 3.
Table 3: Pairwise Comparison of Personnel’s Utility Criteria of Model 1
CR=0.01 Marital Status Number of
Children Distance Marital Status 1 1/3 1/7 Number of Children 3 1 1/3
Distance 7 3 1
After obtaining this matrix, personnel’s utility criteria’s weights are found such; WMarital Status=0.088, WChildren=0.243, WDistance=0.669.
composed of resides of personnel. Greater distance values are undesirable. So we calculate distances as negative.
Table 4: Model 1Transformation of Personal Data
Personal Data Numerical Data Normalized Data AHP Weighted Data Marital
Status
Number of Children
Marital Status
Number of Children
Marital Status
Number of Children
Marital Status
Number of Children Married 2 1 2 0.166667 0.153846 0.014667 0.037385 Married 4 1 4 0.166667 0.307692 0.014667 0.074769
Single 0 0 0 0 0 0 0
Married 3 1 3 0.166667 0.230769 0.014667 0.056077 Married 1 1 1 0.166667 0.076923 0.014667 0.018692
Single 0 0 0 0 0 0 0
Married 1 1 1 0.166667 0.076923 0.014667 0.018692
Single 0 0 0 0 0 0 0
Married 2 1 2 0.166667 0.153846 0.014667 0.037385
Table 5: Model 1 Weighted Distance Utility Values
Districts Karşıyaka Karabağlar Karabağlar Bayraklı Balçova Balçova Urla Urla Gaziemir
Balçova 0.032408 0.10417 0.10417 0.050349 0.161463 0.161463 0 0 0.054978 Balçova 0.032408 0.10417 0.10417 0.050349 0.161463 0.161463 0 0 0.054978 Balçova 0.032408 0.10417 0.10417 0.050349 0.161463 0.161463 0 0 0.054978 Balçova 0.032408 0.10417 0.10417 0.050349 0.161463 0.161463 0 0 0.054978 Balçova 0.032408 0.10417 0.10417 0.050349 0.161463 0.161463 0 0 0.054978 Balçova 0.032408 0.10417 0.10417 0.050349 0.161463 0.161463 0 0 0.054978 Balçova 0.032408 0.10417 0.10417 0.050349 0.161463 0.161463 0 0 0.054978 Balçova 0.032408 0.10417 0.10417 0.050349 0.161463 0.161463 0 0 0.054978 Balçova 0.032408 0.10417 0.10417 0.050349 0.161463 0.161463 0 0 0.054978
We transformed data in table 4 into a matrix and sum them with data in Table 5 and obtained personnel utility matrix. We express them in table 6 as coefficients of appointment model.
Table 6: Model 1 Personnel’s Utility Matrix/ Personnel’s Priority Based Assignment Model Coefficients
Work
\Personnel 1 2 3 4 5 6 7 8 9
62
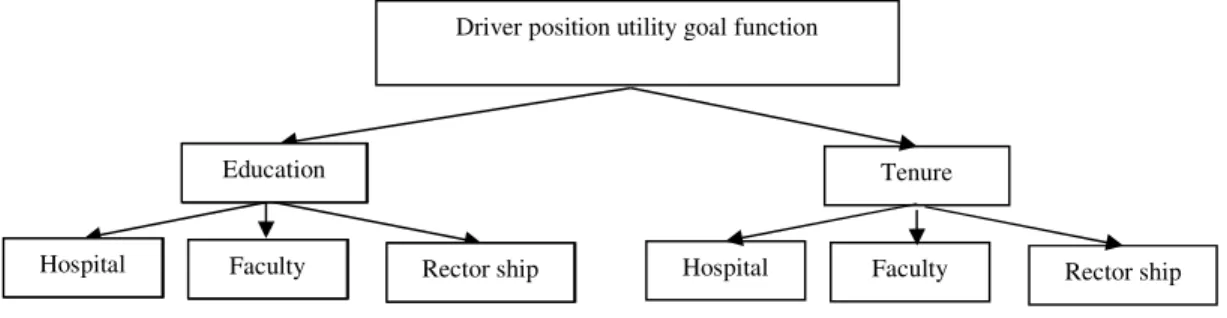
Position utility criteria and groups are defined for administrator and hierarchical structure is given in figure 3. Group 1 is defined as rector ship, group 2 as hospital and group 3 defined as faculties. Positions grouped for model 1.
Figure 3: Model 1 Position Utility Hierarchy
Pairwise comparisons of criteria that reflecting preferences priorities along with maximizes position’s utility are given by Table 7.
Table7: Model 1 Pairwise Comparisons for the Position Priorities.
Goal Position Priority Education Years of Tenure
Years of Education 1 1/3
CR1=0 Tenure 3 1
Years of Education Group 1 Group 2 Group 3
Criteria Group 1 1 3 5
Group 2 1/3 1 3
CR2=0.04 Group 3 1/5 1/3 1
Tenure Group 1 Group 2 Group 3
Criteria Group 1 1 3 5
Group 2 1/3 1 4
CR3=0.08 Group 3 1/5 1/4 1
Contributions of education and tenure for the position utility are WEducation=0.25, WTenure=0.75, respectively. Position Group’s priorities and contribution values are given in Table 8.
Table 8: Model 1 Position Priority and Contribution Values
Priority 0.25 0.75
Years of
Education Tenure Group 1 0.637 0.627 Group 2 0.258 0.28 Group 3 0.105 0.094
Position priority weights multiplied with normalized data of education and tenure for all personnel. Then position group priorities are used for weighting corresponding groups.
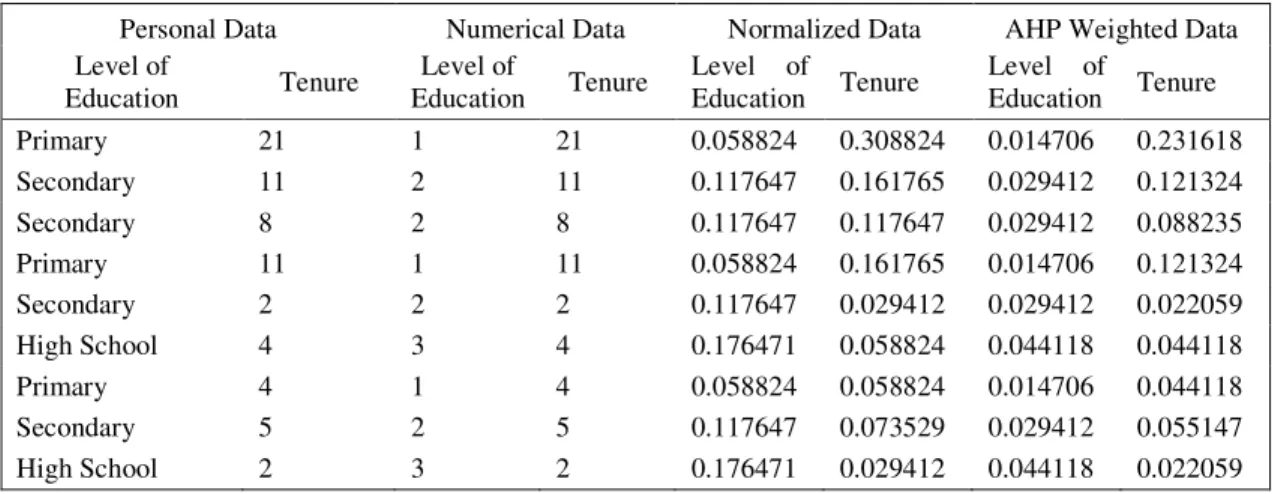
We first examine personal data of personnel and digitize them. Then we normalized that data. General utility of personnel is obtained by multiplying normalized data with AHP significance levels. Transformed data for model 1 is given by table 9. After all, position utility matrix is obtained by multiplying each group’s significance weights with weighted personal data.
Hospital Faculty Rector ship
Tenure
Hospital Faculty Rectorship Education
Driver position utility goal function
Hospital Faculty Rector ship
Rows of position utility matrix are composed of assignments and columns of the matrix are composed of personnel and it also contains group information of assignments.
Table 9: Model 1 Transformation for the Position Information Management Utility
Personal Data Numerical Data Normalized Data AHP Weighted Data Level of
Education Tenure
Level of
Education Tenure
Level of
Education Tenure
Level of
Education Tenure Primary 21 1 21 0.058824 0.308824 0.014706 0.231618 Secondary 11 2 11 0.117647 0.161765 0.029412 0.121324 Secondary 8 2 8 0.117647 0.117647 0.029412 0.088235 Primary 11 1 11 0.058824 0.161765 0.014706 0.121324 Secondary 2 2 2 0.117647 0.029412 0.029412 0.022059 High School 4 3 4 0.176471 0.058824 0.044118 0.044118 Primary 4 1 4 0.058824 0.058824 0.014706 0.044118 Secondary 5 2 5 0.117647 0.073529 0.029412 0.055147 High School 2 3 2 0.176471 0.029412 0.044118 0.022059
Position utility matrix of model 1 is obtained and given in table 10, as follows:
Table 10: Model 1 Position Utility Matrix
Group Assign
ment/
Worker 1 2 3 4 5 6 7 8 9
2 1 0.068647 0.041559 0.032294 0.037765 0.013765 0.023735 0.016147 0.023029 0.017559
2 2 0.068647 0.041559 0.032294 0.037765 0.013765 0.023735 0.016147 0.023029 0.017559
2 3 0.068647 0.041559 0.032294 0.037765 0.013765 0.023735 0.016147 0.023029 0.017559
2 4 0.068647 0.041559 0.032294 0.037765 0.013765 0.023735 0.016147 0.023029 0.017559
2 5 0.068647 0.041559 0.032294 0.037765 0.013765 0.023735 0.016147 0.023029 0.017559
2 6 0.068647 0.041559 0.032294 0.037765 0.013765 0.023735 0.016147 0.023029 0.017559
3 7 0.023316 0.014493 0.011382 0.012949 0.005162 0.008779 0.005691 0.008272 0.006706
3 8 0.023316 0.014493 0.011382 0.012949 0.005162 0.008779 0.005691 0.008272 0.006706
1 9 0.154592 0.094805 0.074059 0.085438 0.032566 0.055765 0.037029 0.053313 0.041934
Two-sided utility matrix which given by table 11 is obtained by summing with equal weights personnel utility matrix which given by Table 6 and position utility matrix in Table 10.
Table 11: Model 1 Two-Sided Utility Matrix
Work\
Pers. 1 2 3 4 5 6 7 8 9
1 0.153107 0.235164 0.136464 0.158857 0.208586 0.185198 0.049506 0.023029 0.124588
2 0.153107 0.235164 0.136464 0.158857 0.208586 0.185198 0.049506 0.023029 0.124588
3 0.153107 0.235164 0.136464 0.158857 0.208586 0.185198 0.049506 0.023029 0.124588
4 0.153107 0.235164 0.136464 0.158857 0.208586 0.185198 0.049506 0.023029 0.124588
5 0.153107 0.235164 0.136464 0.158857 0.208586 0.185198 0.049506 0.023029 0.124588
6 0.153107 0.235164 0.136464 0.158857 0.208586 0.185198 0.049506 0.023029 0.124588
7 0.107776 0.208098 0.115552 0.134041 0.199984 0.170242 0.03905 0.008272 0.113736
8 0.107776 0.208098 0.115552 0.134041 0.199984 0.170242 0.03905 0.008272 0.113736
64 Solution of Assignment:
Assignment Model:
∑ ∑
= =
9
1 9
1
.
i j ij ij
x
c
=
z
max
(4.1)Constraints;
1
9
1 =
∑
= i ij
x j=1…9 (4.2)
1
9
1
=
∑
=
j ij
x
i=1…9 (4.3)ij
x
є {0,1} (4.4)ij
x
variables on (4.1) represents appointment of i-th personnel to j-th assignment.ij
c
coefficient of objective function express the amount of contribution to total utility wheni-th personnel appointed to j-th assignment.
Constraints on (4.2) allows only one personnel appointment to j-th assignment. Constraints on (4.3) allows only i-th personnel appointment to only one assignment. With constraints on (4.4), variables take only 0-1 integer values.
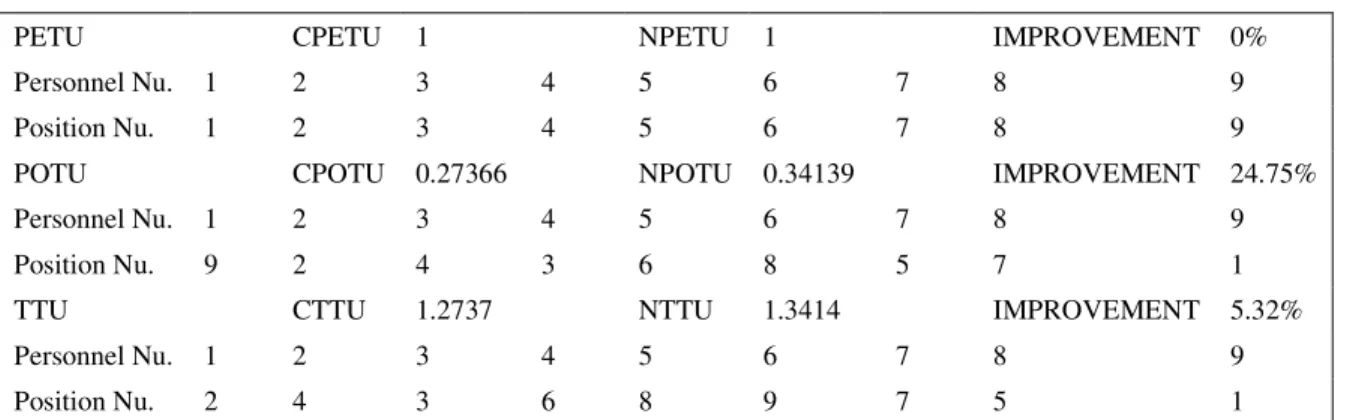
MATLAB software used for finding solution of the model by Hungarian Assignment Algorithm. Personnel’s total utility (PETU), position total utility (POTU) and two-sided total utility (TTU) solutions for model 1 is given by Table 12.
Table 12: Model 1 Assignment Solution Values
PETU CPETU 1 NPETU 1 IMPROVEMENT 0% Personnel Nu. 1 2 3 4 5 6 7 8 9 Position Nu. 1 2 3 4 5 6 7 8 9 POTU CPOTU 0.27366 NPOTU 0.34139 IMPROVEMENT 24.75% Personnel Nu. 1 2 3 4 5 6 7 8 9 Position Nu. 9 2 4 3 6 8 5 7 1 TTU CTTU 1.2737 NTTU 1.3414 IMPROVEMENT 5.32% Personnel Nu. 1 2 3 4 5 6 7 8 9 Position Nu. 2 4 3 6 8 9 7 5 1
Positions didn’t change after appointment by PETU for model 1. The reason of that situation is 9 positions located in same place and a change of that will not contribute to total utility. Current personnel total utility (CPETU)=1 and new personnel total utility (NPETU)=1 is obtained. After appointment by POTU, current position total utility (CPETU)=0.27366 and new position total utility (NPETU)= 0.34139 is obtained. Improvement occurs with 24.75%. After appointment by TTU, current two-sided total utility (CTTU)= 1.2737 and new two-sided total utility (NTTU)= 1.3414 is obtained. Improvement occurs with 6.77%.
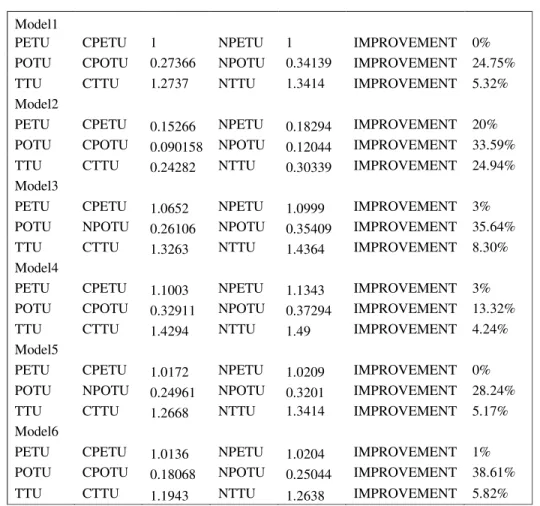
Table 13: Solutions of all models
Model1
PETU CPETU 1 NPETU 1 IMPROVEMENT 0% POTU CPOTU 0.27366 NPOTU 0.34139 IMPROVEMENT 24.75% TTU CTTU 1.2737 NTTU 1.3414 IMPROVEMENT 5.32%
Model2
PETU CPETU 0.15266 NPETU 0.18294 IMPROVEMENT 20% POTU CPOTU 0.090158 NPOTU 0.12044 IMPROVEMENT 33.59% TTU CTTU 0.24282 NTTU 0.30339 IMPROVEMENT 24.94%
Model3
PETU CPETU 1.0652 NPETU 1.0999 IMPROVEMENT 3% POTU NPOTU 0.26106 NPOTU 0.35409 IMPROVEMENT 35.64% TTU CTTU 1.3263 NTTU 1.4364 IMPROVEMENT 8.30%
Model4
PETU CPETU 1.1003 NPETU 1.1343 IMPROVEMENT 3% POTU CPOTU 0.32911 NPOTU 0.37294 IMPROVEMENT 13.32% TTU CTTU 1.4294 NTTU 1.49 IMPROVEMENT 4.24%
Model5
PETU CPETU 1.0172 NPETU 1.0209 IMPROVEMENT 0% POTU NPOTU 0.24961 NPOTU 0.3201 IMPROVEMENT 28.24% TTU CTTU 1.2668 NTTU 1.3414 IMPROVEMENT 5.17%
Model6
PETU CPETU 1.0136 NPETU 1.0204 IMPROVEMENT 1% POTU CPOTU 0.18068 NPOTU 0.25044 IMPROVEMENT 38.61% TTU CTTU 1.1943 NTTU 1.2638 IMPROVEMENT 5.82%
As seen above, model results show that all types of utility values are improved, excluding model 1 PETU value. All types of utility values of model 2 are improved above 20%. The most improved utility value is POTU of model 6 which has 38.61% improvement rate.
When comparing PETU values of all models, the most improved model 2 has 20% improved rate, all other models improvement rates are between 0% and 3%. According to this results all employees are working at their best positions for themselves with the exception of model 2.
When comparing POTU values of all models, the least improved model 4 has 13.32% improved rate, all other models improvement rates are between 24.75% and 38.61%. With reference to this results there should be new assignment for better position utility values to upgrade the quality of works.
Last but not least, TTU values which are essential to both employees and manager for work satisfaction, are compared. Model 2 has the highest improvement rate which is 24.94%, all other models improvement rates are between 4.24% and 8.30%.
5. RESULTS AND DISCUSSION
66
Personnel and position utility criteria and position groups are evaluated with AHP method. The pairwise comparison is made by the specialist who has knowledge of both AHP method and problem.
In this study AHP method based 0-1 Integer Programming Model are used for solving assignment problem. Results show that AHP method is suitable for evaluating coefficients of utility functions.
The utility function values of current and new assignments are compared. Improvement rates show that new assignments should be considered as soon as possible. New assignments would provide better quality of works.
Following studies can focus on personnel demands and judgements by directly to get better results for coefficients of utility functions.
REFERENCES
1. Balachandran, B.V. and Zoltners, A.A., An Interactive Audit-Staff Scheduling Decision Support System, The Accounting Review, 56(4), 801-812. 1981.
2. Daneshvarand, B., and Erkan, T. E., Selection of Academic Staff Using the Fuzzy Analytic Hierarchy Process, Tehničkivjesnik, pp. 923-929. 2012.
3. Daskalaki, S.,Birbas, T., and Housos, E., An Integer Programming Formulation for a Case Study in University Timetabling, European Journal of Operational Research”, 153, No 1, 117-135. 2004. 4. Dodin, B. and Chan, K.H.,.Application of Production Scheduling Methodsto External and Internal
Audit Scheduling, European Journal of OperationalResearch, 52(3), 267-279. 1991.
5. Dodin, B., Elimam, A.A. and Rolland, E., Tabu Search in Audit Scheduling, European Journal of Operational Research, (106), 373-392. 1998.
6. Gungor, Z., Serhadlioglu, G. and Kesen, S.E., A fuzzy AHP approach to personel selection problem. Applied Soft Computing, pp. 641-646. 2009.
7. Harden, B. and Fraher, E., Workforce Planning In The Context Of Service Redesign, Workforce Migration And Changing Demographics, International Journal Of Therapy And Rehabilitation, 17(4), 195-202. 2010.
8. Ho, W., Dey, P.K., Higson, H.E., Multiple criteria decision making techniques in higher education, International Journal of Educational Management 20 (5), 319–337. 2006
9. Ismayilova, N. A., Sağır, M., and Gasimov, R. N., A Multi objective Faculty–Course–Time Slot Assignment Problem with Preferences, Mathematical and Computer Modelling, 46, No 7, 1017-1029. 2007.
10.LI, N. and Li, L., Modeling Staffing Flexibility: A Case of China, European Journal of Operational Research ,124, 255–266. 2000.
11.LIN, C.K.Y., LAI, K.F. and HUNG, S.L., Development of a Workforce Management System for a Customer Hotline Service, Computers & Operations Research, 27, 987-1004. 2000.
12.Öztürk, A., Yöneylem Araştırması, 8. Baskı, Ekin Kitabevi Yayınları, Bursa, s. 167. 2002.
13.Triantaphyllou, E., Shu, B., Nieto Sanchez, S. and Ray, T., Multi-Criteria Decision Making: An Operations Research Approach, Encyclopedia of Electrical and Electronics Engineering, (J.G. Webster, Ed.), John Wiley & Sons, New York, NY, Vol. 15, pp. 175-186. 1998.
14.William, H., Integrated analytic hierarchy process and its applications – A literature review, European Journal of Operational Research. 186(211–228). 1998.