Mef2a, Nkx2.5, Srf, Histone Modifications, and
MicroRNAs
Jenny Schlesinger1,2., Markus Schueler1,3., Marcel Grunert1., Jenny J. Fischer1., Qin Zhang1,4
, Tammo Krueger1, Martin Lange1, Martje To¨njes1, Ilona Dunkel1, Silke R. Sperling1*
1Group Cardiovascular Genetics, Department of Vertebrate Genomics, Max Planck Institute for Molecular Genetics, Berlin, Germany,2Department of Biology, Chemistry, and Pharmacy, Free University Berlin, Berlin, Germany,3Department of Computational Molecular Biology, Max Planck Institute for Molecular Genetics, Berlin, Germany,
4Shaanxi Key Laboratory of Molecular Biology for Agriculture, College of Animal Sciences and Technology, Northwest A & F University, Yangling, China
Abstract
The transcriptome, as the pool of all transcribed elements in a given cell, is regulated by the interaction between different molecular levels, involving epigenetic, transcriptional, and post-transcriptional mechanisms. However, many previous studies investigated each of these levels individually, and little is known about their interdependency. We present a systems biology study integrating mRNA profiles with DNA–binding events of key cardiac transcription factors (Gata4, Mef2a, Nkx2.5, and Srf), activating histone modifications (H3ac, H4ac, H3K4me2, and H3K4me3), and microRNA profiles obtained in wild-type and RNAi–mediated knockdown. Finally, we confirmed conclusions primarily obtained in cardiomyocyte cell culture in a time-course of cardiac maturation in mouse around birth. We provide insights into the combinatorial regulation by cardiac transcription factors and show that they can partially compensate each other’s function. Genes regulated by multiple transcription factors are less likely differentially expressed in RNAi knockdown of one respective factor. In addition to the analysis of the individual transcription factors, we found that histone 3 acetylation correlates with Srf- and Gata4-dependent gene expression and is complementarily reduced in cardiac Srf knockdown. Further, we found that altered microRNA expression in Srf knockdown potentially explains up to 45% of indirect mRNA targets. Considering all three levels of regulation, we present an Srf-centered transcription network providing on a single-gene level insights into the regulatory circuits establishing respective mRNA profiles. In summary, we show the combinatorial contribution of four DNA–binding transcription factors in regulating the cardiac transcriptome and provide evidence that histone modifications and microRNAs modulate their functional consequence. This opens a new perspective to understand heart development and the complexity cardiovascular disorders.
Citation:Schlesinger J, Schueler M, Grunert M, Fischer JJ, Zhang Q, et al. (2011) The Cardiac Transcription Network Modulated by Gata4, Mef2a, Nkx2.5, Srf, Histone Modifications, and MicroRNAs. PLoS Genet 7(2): e1001313. doi:10.1371/journal.pgen.1001313
Editor:Dirk Schu¨beler, Friedrich Miescher Institute for Biomedical Research, Switzerland
ReceivedJune 1, 2010;AcceptedJanuary 18, 2011;PublishedFebruary 17, 2011
Copyright:ß2011 Schlesinger et al. This is an open-access article distributed under the terms of the Creative Commons Attribution License, which permits unrestricted use, distribution, and reproduction in any medium, provided the original author and source are credited.
Funding:This work was supported by the European Community’s Sixth Framework Program contract (‘‘HeartRepair’’) LSHM-CT-2005-018630 and Seven Framework Program contract (‘‘CardioGeNet’’) 2009-223463, by a PhD scholarship to QZ by the German Academic Exchange Service (DAAD), and by a PhD scholarship to MT by the Studienstiftung des Deutschen Volkes. The funders had no role in study design, data collection and analysis, decision to publish, or preparation of the manuscript.
Competing Interests:The authors have declared that no competing interests exist. * E-mail: sperling@molgen.mpg.de
.These authors contributed equally to this work.
Introduction
It is long known that an evolutionary conserved orchestra of transcription factors controls cardiac development and function. More recently the contribution of epigenetic and post-transcrip-tional mechanisms has been identified. Many successful studies have focused on these different aspects independently, but it is still an open question, how these molecular regulatory mechanisms interact. The ability of transcription factor binding to DNA is highly influenced by the chromatin status and epigenetic mechanisms play an important role in establishing and maintain-ing transcriptional programs. This layer of control comprises posttranslational modification of histones, DNA methylation and chromatin remodeling. To understand networks directing gene expression, the interplay between different transcription and epigenetic factors has to be considered. Furthermore, recent
studies have started to unveil powerful roles for microRNAs (miRNAs) in regulating and fine-tuning mRNA profiles via either translational repression or mRNA degradation. It should be noted that gene expression profiles as obtained by standard microarrays or next-generation sequencing reflect mRNA profiles, which depend on the gene transcription as well as the decay of mRNA. In line with this, we present a study integrating mRNA profiles with transcription factor-DNA interaction data, histone modifica-tion marks and posttranscripmodifica-tional regulamodifica-tion by miRNAs.
and impaired myocyte differentiation [4].Srf-nullmice show severe defects in the contractile apparatus of cardiomyocytes and die at the gastrulation stage [5,6]. However, Gata4, Mef2a, Nkx2.5 and Srf not only display independently a central role for cardiac development and function, they also regulate each other’s expression [7–10]. Despite their impact, we still have limited understanding of the global cardiac transcription networks driven by these factors in a direct and indirect manner.
Moreover, we lack knowledge to which extent epigenetic marks such as histone modifications interfere with the regulation of downstream targets. The N-terminal histone tails serve as targets for a variety of reversible posttranslational modifications including acetylations or methylations. Both have a main impact on chromatin structure and represent binding sites for transcriptional regulators [11–13], thus promoting or inhibiting transcription. They are put in place by specific enzyme families and are removed by others [14,15]. Hence histone acetylation is a dynamic process and for instance, mice lacking histone deacetylases 5 and 9 (HDAC5 and 9) show cardiac defects typical for abnormalities in growth and maturation of cardiomyocytes [16]. A superactivation of Mef2 based on its interaction with HDACs is proposed [17]. However, our understanding of the underlying molecular mechanisms is still premature.
It was reported that only 5–15% of differentially expressed genes in short interference RNA (siRNA) knockdown experiments are also direct transcription factor targets identified by chromatin immunoprecipitation (ChIP) and vice versa [18–23]. There is considerable evidence, that cascades of transcriptional regulators form networks. Loss of one factor will directly affect a few genes, but among those genes are other transcriptional regulators whose function is now altered, affecting a further set of downstream genes. In addition, it has to be considered that a significant proportion of downstream effects mediated by DNA-binding transcription factors is promoted via downstream miRNAs or other regulators. For example Srf regulates the transcription of miRNAs such as the smooth muscle relevant 143 and
miR-145 [24]. Feedback loops between Srf/Mef2 and muscle-specific miR-133/miR-1 have been described, and both miRNAs are expressed throughout heart development and play important roles in muscle proliferation and differentiation [25–28]. Furthermore, miR-1 promotes myogenesis by targeting HDAC4 [26], a transcriptional repressor of muscle gene expression, and thus represents an interface to histone acetylation.
Taken the above, we investigated the transcription network driven by Gata4, Mef2a, Nkx2.5 and Srf in cardiomyocytes in a genome-wide approach. First, we focused on the direct down-stream targets by evaluating in-vivo DNA-binding sites of the respective factors and correlated these binding events with the expression level of related genes. Second, we investigated the functional consequence of the proposed regulation in knockdown experiments and built respective transcription networks. Third, we analyzed if co-occurrence with activating histone modifications could impact on gene expression levels of direct targets. Fourth, we studied the modulation of mRNA levels by miRNA alterations seen in knockdown experiments. Finally, we integrated the three levels regulating mRNA profiles and generated a comprehensive transcription network centered on Srf. Based on our analysis we argue that transcription networks have a comparable dependency on transcription factor binding, modulation by histone modifica-tions as well as regulation by miRNAs. In addition to the global perspective, our networks provide distinct information on the regulation of individual genes especially with regard to cardiac function.
Results
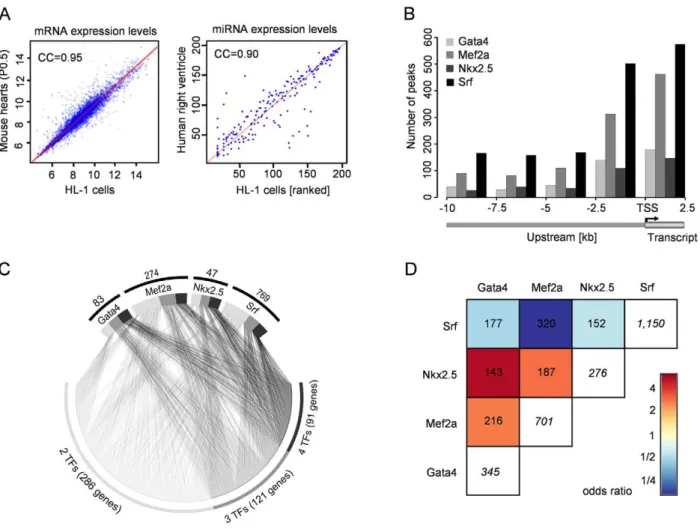
We used the cardiomyocyte cell line HL-1 to study the global transcription network driven by the DNA-binding transcription factors Gata4, Mef2a, Nkx2.5 and Srf. The mRNA as well as miRNA expression profiles of beating HL-1 cells are highly comparable to the one observed in mouse hearts at P0.5 (Pearson correlation coefficient of 0.95, Figure 1A left) and human right ventricle (Pearson correlation coefficient of 0.90, Figure 1A right; data unpublished). The use of a cell line enabled us to cope with the technical limitations of our different approaches (ChIP-chip/ seq, miRNA-seq, siRNA knockdown, microarrays) and supported a single cell-type specific study. We validated the key findings in a time-course of mouse hearts during the cardiac adaptation and maturation period around birth at E18.5, P0.5 and P4.5.
Cardiac Transcription Regulated by Gata4, Mef2a, Nkx2.5, and Srf
We developed a custom two-array set (26385K) with Nimble-Gen using a tilling approach for promoter and enhancer regions (10kb upstream), and first exon and intron sequences of 12,625 transcripts (65% of all RefSeq promoters). This enabled the analysis of sequence regions beyond standard promoter arrays. We selected 89Mbp of the mouse genome related to transcripts of 13 data sources (Table S1), which included all known expressed skeletal, smooth and cardiac muscle genes in human and mouse. Using ChIP-chip analyses we identified several hundreds of transcription factor binding sites (TFBS) for Gata4 (447), Mef2a (999), Nkx2.5 (383) and Srf (1,335) in mouse HL-1 cardiomyo-cytes, which were related to 345 Gata4, 701 Mef2a, 276 Nkx2.5 and 1,150 Srf target genes (Table S15). Figure 1B shows the distribution of observed binding sites relative to the transcriptional start site (TSS). An average of 24% of TFBS were localized in potential enhancer regions with a distance between 2.5kb to 10kb upstream from any transcriptional start site.
Author Summary
The respective target genes of the studied transcription factors included 42 known targets (Table S2), substantiating the reliability of the system. In addition, we found several genes previously shown to be deregulated in mutants as direct targets of the respective transcription factor. For example, Gata4 and Nkx2.5
levels are decreased in cells depleted of Mef2 [8] and both genes show binding of Mef2a at their promoters in our data.
To gain further insights into the transcription factor function-ality, we investigated which Gene Ontology (GO) terms were significantly overrepresented among target genes of each factor when compared to all genes represented on the array. The significant GO terms (p,0.001) show a stronger than expected association with heart development and function and are highly related to the phenotypes reported for the respective transcription factor (Tables S3, S4, S5, S6). For example, the GO terms ‘muscle cell differentiation’ and ‘heart looping’ are significantly
overrep-resented among Mef2a and Nkx2.5 targets, respectively, and both are key features of corresponding knockout mouse models [3,4].
We investigated the sequences underlying the transcription factor binding sites in more detail and searched for TRANSFAC [29] motifs within the presumably bound sequences. The TRANSFAC matrices used for motif search are listed in Table S7. For Gata4, Nkx2.5 and Mef2a 84–94% of all ChIP binding events harbored respective binding motifs. For Srf, the fraction of ChIP binding events with predicted motifs was very small (169 out of 1,335 binding sites). However, Srf is well-known to bind the CArG-box CC(A/T)6GG [30], which is only partially represented by TRANSFAC motifs. Using a pattern matching approach we found the CArG-box in 1,063 (approximately 80%) Srf binding events. Furthermore, more than every second binding event of the studied factors occurred at sequence sites containing at least two times the respective transcription factor motif or pattern. Figure 1. Binding site location and co-occurrence of Gata4, Mef2a, Nkx2.5, and Srf.HL-1 mRNA and miRNA expression profiles are highly comparable to the ones observed in human and mouse hearts. (left) Gene expression levels obtained from HL-1 cells and P0.5 of C57/BL6 mouse heart. (right) Rank-transformed miRNA expression levels in HL-1 cells and human right ventricle. (B) Positional distribution of transcription factor binding sites relative to the transcription start site (TSS). The y-axis shows the number of transcription factor binding sites per transcription factor as bar plots in 2.5kb windows. Most binding sites (,75%) are located within close proximity to the TSS. (C) Gata4, Mef2a, Nkx2.5 and Srf frequently bind together. Shown is the combinatorial binding of all four transcription factors to 498 common target genes. 91 target genes were bound by all four factors (black), 121 target genes were bound by three (dark gray) and 286 target genes were bound by two transcription factors (gray). The total number of genes solely bound by a single TF are indicated above the respective TF. (D) Odds ratios of pair-wise contingency tables of the occurrence of transcription factor binding sites at one gene. Total numbers of pair-wise occurrences are given. The numbers in white boxes represent the total number of bound genes for the respective transcription factor. Red indicates positive, blue negative correlation. Gata4 and Nkx2.5 had the lowest number of targets (345 for Gata4, 276 for Nkx2.5) but we observed co-binding to 143 genes and their occurrence is therefore highly correlated. Although Mef2a and Srf bind at 320 genes together, they each have a much higher number of target genes.
We studied the cross-species conservation of binding motifs and found in,10% complete sequence conservation between human and mouse. In 27% the binding sites were localized in regions conserved across 18 vertebrate species based on PhastCons elements [31]. Thus, by focusing only on conserved sequence regions a priori more than two-third of the binding sites would be missed.
Combinatorial Regulation by Multiple Transcription Factors
The investigated transcription factors are known to co-regulate targets and pairwise physical interaction has been described between several of these factors [32,33]. Nevertheless, it is unknown how frequently this co-binding occurs in-vivo. Conse-quently, we investigated the assignment of Gata4, Nkx2.5, Mef2a and Srf to the same gene. We observed frequent co-regulation by more than one transcription factor, where Gata4 and Nkx2.5 shared 143 targets (41% and 52%, respectively) and Mef2a and Srf shared 320 target genes (46% and 28%, respectively) (Figure 1C and 1D). For 91 genes co-binding of all four transcription factors was observed and in 85 cases the binding was observed at close proximity within a 500bp window. These data underline the complexity and cooperative regulation of gene regulation shown in our model of four DNA-binding transcription factors.
Functional Consequences of Transcription Factor Binding
We investigated whether the transcription factors act mainly as activators or repressors in a wildtype situation. We carried out genome-wide expression array analysis of the contracting HL-1 cardiomyocytes and classified all transcripts as expressed or non-expressed. We found that for each of the four transcription factors approximately 80% of the target genes were expressed and their expression levels were significantly enhanced compared to non-targets (p,0.005).
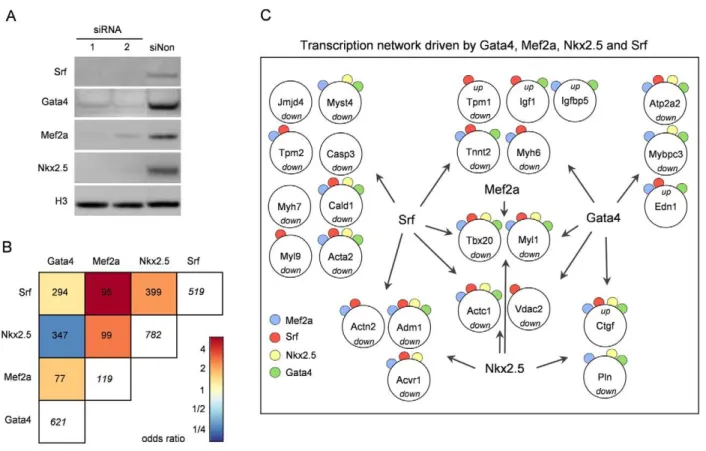
Considering the cooperative co-binding of the investigated transcription factors, we were interested in the functional consequence of significantly reducing the quantity of each of the factors. Therefore, we used siRNA technique to reduce the protein levels of investigated transcription factors by more than 70% and studied its consequence for gene transcription. The reduction at mRNA and protein level was monitored by quantitative PCR and Western Blot analysis (Figure S1 and Figure 2A) and the genome-wide effects on transcript levels were measured by expression array analysis (Table S17). All data were based on a total of 4 replicate experiments using duplicates of two different siRNAs per transcription factor. The majority of deregulated transcripts were downregulated in the siRNA treated samples, confirming a primarily activating function of the transcription factors. Perform-ing Annexin assays and Tryptophan Blue stainPerform-ing, we observed an
Figure 2. RNAi–induced knockdown of Gata4, Mef2a, Nkx2.5, and Srf.(A) Knockdown efficiency of Gata4, Mef2a, Nkx2.5 and Srf in HL-1 cells using two different siRNAs was analyzed on protein level by Western Blot 48h after transfection. Histone 3 (H3) served as loading control. In independent experiments similar knockdown efficiencies were obtained. (B) Odds ratios of pair-wise contingency tables of differentially expressed transcripts after RNAi knockdown of the respective transcription factor. Total numbers of pair-wise occurrences are given. The numbers in white boxes represent the total number of deregulated transcripts. Red indicates positive, blue negative correlation. Mef2a shows the lowest number of differentially expressed transcripts (119) probably due to buffering effects of the other Mef2 family members. Despite this fact, Mef2a shares a high number of deregulated transcripts with the other transcription factors. Of note, transcription factors having a high number of common binding targets (see Figure 1D) share only a small number of co-regulated genes in RNAi knockdown. (C) Transcription factor network showing a selection of cardiac relevant genes bound in ChIP-chip and/or ChIP-seq, and significantly differentially expressed in RNAi knockdown experiments of the respective factor. Up- and downregulation of genes is depicted and occurrence of ChIP binding marked by color-coded circles.
increased apoptosis and cell death in particular when Gata4 or Srf were knocked down (Figure S2), which is in line with previous data [34–36].
Analogous to our analyses of common downstream targets based on transcription factor binding events, we studied common differentially expressed genes. The different factors share a compa-rable proportion of differentially expressed genes when knocked down (Figure 2B). An opposing effect for targets regulated by several transcription factors was only observed in two cases:MyocdandTpm1. Figure 2C shows the combinatorial regulation of a selection of heart and muscle relevant, directly bound and differentially expressed genes. This includes genes coding for structural proteins likeActc1,
Actn2,Tnnt2,Mybpc3orMyh6; growth factors likeIgf1or apoptosis factors like Casp3. The transcription factor Tbx20 represents an example for a gene that is bound and regulated by all four factors. A broad panel of differentially expressed genes was further confirmed by quantitative real-time PCR (Table S8).
Finally, we compared the differentially expressed genes in siRNA knockdown experiments to the direct target genes identified by ChIP. Analyzing the overlap focusing on the functional role of the respective genes, we found that both datasets share the Gene Ontology terms reflecting heart and muscle development and function. For example, muscle cell differentia-tion, muscle contraction and heart development are the main functional roles for direct targets of Srf as well as the respective differentially expressed genes. However, only a small fraction of direct target genes (,10%) was also differentially expressed, pointing to the combinatorial nature of gene regulation. In accordance, we found that genes bound by multiple transcription factors were significantly less likely differentially expressed (x2-test p,0.001). Likewise transcription factors having a high number of common binding targets share only a small number of co-regulated genes in RNAi knockdown (correlation shown in Figure 2B is inverse to the correlation in Figure 1D). In addition, binding in a poised state or buffering by epigenetic mechanisms such as histone modifications which interfere with the accessibility of the DNA should be considered. It has to be kept in mind that transcription factor binding depends on binding affinity and accessibility of binding sites. The regulatory potential of several factors has been reported to be strongly dosage dependent (e.g. Tbx5 [37] and Gata4 [38]). Furthermore, a significant proportion of differentially expressed genes in RNAi are likely to be regulated in an indirect manner. Recent studies show the powerful roles for miRNAs in controlling mRNA profiles largely by silencing target genes, via either translational repression or mRNA degradation.
Histone 3 Acetylation Correlates with the Activating Potential of Transcription Factors
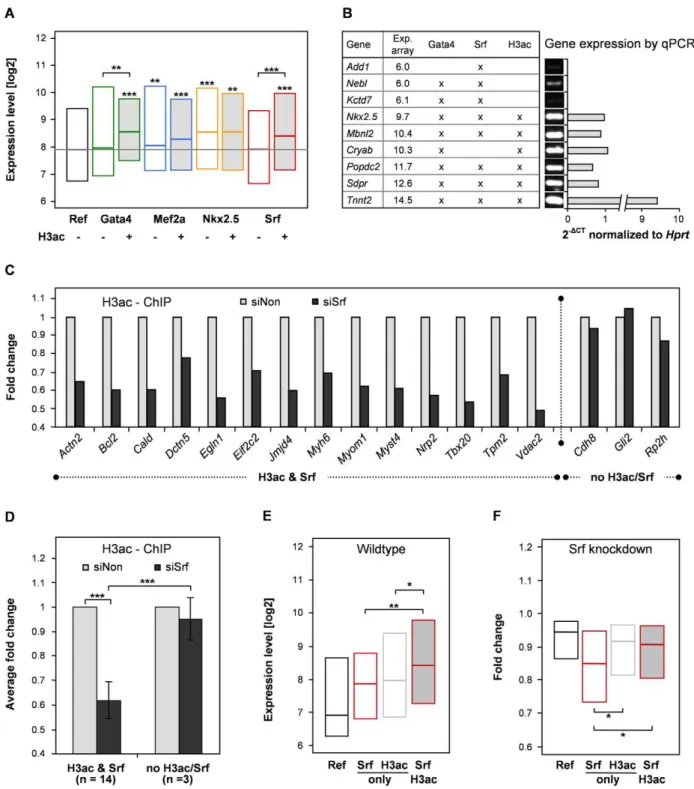
To explore the influence of histone modifications as an epigenetic mechanism to modulate gene expression, we analyzed our transcription factor binding data in the context of co-occurring histone marks. In a previous study we investigated the localization of four histone modifications, which are known to promote an open chromatin state (H3K9K14ac, H4K5K8K12K16ac, H3K4me2 and H3K4me3) [39]. We found that ,80% of the respective transcription factor binding events are marked by one or more of these histone modifications, whereas in a randomized simulation only 23% are expected to co-occur (Figure S3). We consequently investigated whether the presence of any of these marks correlates with higher expression levels of direct target genes and found a significant impact for histone 3 acetylation (H3ac) only (Figure 3A and Figure S4). For Nkx2.5 and Mef2a the expression levels of direct targets were significantly higher than the reference group, independent of whether H3ac was present or not.
Genes showing neither transcription factor binding nor H3ac were used as a reference. In case of Gata4 and Srf the expression levels of direct targets were only significantly increased when binding sites were additionally marked by H3ac. The enhanced expression levels depending on H3ac co-occurrence is further depicted in Figure 3B, which shows confirmation experiments of nine genes using quantitative PCR. In conclusion, our data provide evidence that acetylation of histone 3 supports the activating function of Gata4 and Srf, which might be mediated via p300. The histone acetyl transferase p300 not only acetylates lysine residues on histone 3 but also on Gata4, thereby enhancing the DNA-binding and activating potential of this transcription factor [40]. The Srf cofactor Myocardin has been reported to recruit p300 to Srf binding sites whereby histone 3 acetylation is induced and gene expression enhanced [41]. Finally, we studied the change of H3ac marks as a consequence of Srf knockdown using ChIP followed by qPCR. Strikingly, we found complementary alterations of H3ac in a panel of relevant promoter regions (Figure 3C and 3D).
Histone 3 Acetylation Correlates with Srf Target Gene Activation
To validate and further investigate the correlation of H3ac with Srf target gene expression, we performed genome-wide ChIP-seq experiments in HL-1 cardiomyocytes (Table S16). We found a synergistic effect of H3ac and Srf binding when compared to non-bound genes or genes solely non-bound by either of both (Figure 3E). The influence of H3 acetylation marks was further substantiated by RNAi knockdown of Srf in HL-1 cells (Figure 3F). In accordance to its mainly activating function, we found a significant decrease in expression levels of genes bound by Srf. However, this decrease was significantly reduced in genes additionally marked by H3ac in the wild-type.
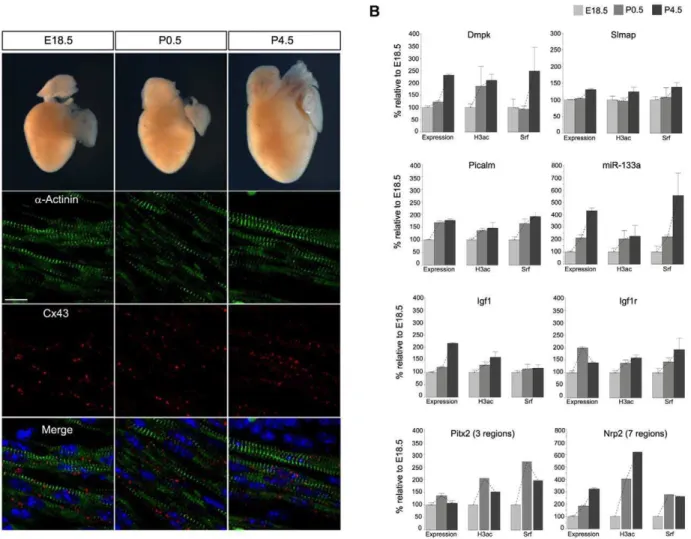
In a further attempt to confirm our results gathered in cell culture, we studied Srf and H3ac binding and their influence on gene expression in mouse hearts in a time-series during cardiac maturation at three developmental stages E18.5, P0.5 and P4.5 around birth. From the fetal to the postnatal stage, the heart adapts to the body circulation and cardiomyocytes mature. During this process the heart increases in size (Figure 4A), the cells elongate, myofibrils align and cell-cell contacts become bipolar. Immunostaining of a-Actinin-1 and Connexin 43 illustrates hypertrophy of cardiomyocytes, assembly of the sarcomeric z-discs and development of gap junction [42]. Based on ChIP-chip/ seq results for Srf and H3ac in HL-1 cells, we analyzed promoter binding regions of genes and miRNAs relevant for this process using ChIP followed by quantitative real-time PCR. The selection comprises (Figure 4B): Dmpk (kinase of myogenin), Slmap
(sarcomeric protein), Picalm (clathrin assembly protein), miR-133a (cardiac and muscle-specific miRNA), the growth factorIgf1
and its receptorIgf1r,Pitx2c(cardiac transcription factor), andNrp2
(interactor of Vegf). We found a high correlation between the changes of Srf and H3ac binding and the gene expression levels over time. In case ofPitx2candNrp2we identified multiple binding events in HL-1 cells by ChIP-chip/seq of which their functionality could be confirmed by common changes over time in the mouse model (Figure 4B). Taken together, these data support an important role for the co-occurrence of Srf and H3ac in the regulation of the cardiac maturation process and underline the influence of histone modifications.
Studying the Impact of miRNAs on the Srf-Driven Transcription Network
Figure 3. Histone 3 acetylation correlates with target gene expression of Srf and Gata4.(A) For each transcription factor the binding sites were categorized into two groups depending on co-occurrence with histone 3 acetylation (H3ac) in ChIP-chip. Genes marked by Mef2a or Nkx2.5 show significant increased expression levels compared to non-marked genes (Ref) independent of co-occurring H3ac. In contrast, expression levels of genes bound by Gata4 or Srf were only increased when H3ac marks co-occurred. (B) Confirmation of selected target genes of Srf and Gata4 with H3ac dependent expression level. HL-1 Illumina expression levels were confirmed using same amount of cDNA for semi-quantitative PCR (30 cycles) followed by gel electrophoresis and quantitative real-time PCR (40 cycles). Used primer had PCR efficiencies between 1.8–2.0. (C, D) Srf knockdown in HL-1 cells leads to complementary alterations in H3ac marks at Srf binding sites. H3ac-ChIP enrichments after Srf knockdown (siSrf) compared to control siRNA (siNon) were measured with qPCR for two groups of promoter regions (H3ac & Srf binding and no H3ac/Srf). The H3ac enrichment was normalized to Input and IgG controls. Fold changes show significant decrease in H3ac enrichment after Srf knockdown. (E) Confirmation of H3ac dependent expression of Srf target genes by ChIP-seq. Shown are expression levels of transcripts with H3ac and/or Srf binding close to the transcriptional start site (TSS,1.5kb). (F) H3ac reduces downregulation of Srf target genes in its knockdown. Shown are fold changes relative to siNon of downregulated transcripts after Srf knockdown with H3ac and/or Srf binding (TSS,1.5kb). Expression levels (A, E) and fold changes (F) are represented as box plots. Genes showing neither binding of investigated transcription factors nor H3ac are used as reference. The resulting p-values are indicated: p,0.001 (***), p,0.01 (**) and p,0.05 (*).
of the respective transcription factors, we were interested in studying the impact of miRNAs as secondary effectors (Figure 5A, 5B). Again we focused on the transcription factor Srf, which is known to regulate cardiac relevant miRNAs like miR-1 and miR-133 [26,43]. We investigated Srf binding using ChIP-seq technology to map Srf binding sites potentially regulating miRNAs. We found 22 miRNAs from the miRNA database miRBase with Srf binding within a region of 10kb. This includes the previously described miR-208 Srf binding site, as well as other well-known muscle relevant miRNAs like miR-1, miR-125b, miR-133, miR-143 and miR145 (Table S9). Second, we performed Srf knockdown using two different siRNAs and quantified the miRNA expression levels by miRNA-seq (Table S10 and Table S18). We observed 42 miRNAs (49 loci) to be differentially expressed in both siRNA experiments, including miR-208, miR-125b and miR-21. The analysis revealed that most of the miRNAs were downregulated (78%) supporting the role of Srf as an miRNA activator (Figure 5A).
To explore the potential effect of the differentially expressed miRNAs on the Srf network, we assigned confirmed and predicted
targets to each miRNA. We found 192 miRNA targets to be also differentially expressed in Srf knockdown, with a higher fraction of upregulated genes (57% of all upregulated genes) compared to downregulated genes (44% of all downregulated genes, Figure 5A). The majority of these dysregulated target genes had 39UTR target sequences for a panel of our differentially expressed miRNAs (median of 3). The differential expression of miRNAs potentially impacts up to 45% of all differentially expressed genes by Srf knockdown, a higher proportion of genes than expected (Fisher’s exact test, p = 1.77e-5), and provides a feasible explanation for the observed consequences on the transcriptional portrait (Figure 5B). A representative example is shown in Figure 5C. It comprises the three genes Igfbp5 (insulin-like growth factor binding protein 5), Nfic (nuclear factor I/C) and Ctnnal1 (catenin alpha-like 1). None of these factors has a direct Srf binding site in ChIP-chip/seq but all are found to be upregulated in the Srf siRNA knockdown experiment. Using miRNA target prediction a number of downregulated miRNAs were found that provide a possible explanation for this indirect regulation (see Table S11).
Figure 4. The impact of Srf and H3ac on gene expression in mouse hearts during cardiac maturation.(A) Cardiomyocyte maturation over three developmental stages around birth (E18.5, P0.5 and P4.5) with respect to alignment of myofibrils and cell-cell contacts. Paraffin sections of mouse hearts double labeled with antibodies againsta-Actinin and Connexin 43 (Cx43) and examined under the confocal microscope. Thea-Actinin stained myofibrils (in green, second panel) elongate and assemble throughout the maturation process while Cx43 (in red, third panel) forms distinct punctuations, which become larger and brighter. Nuclei are visualized in blue by DAPI counterstaining and merged pictures are shown in the lower panel. Scale bar 10mm. (B) Confirmation of the dependency of expression levels on H3ac and Srf binding in mouse hearts using the time-series E18.5,
P0.5 and P4.5. Expression levels as well as ChIP enrichment were analyzed by quantitative real-time PCR and normalized toHprt and Input, respectively. Shown changes of expression levels as well as Srf and H3ac binding over time are in general significant. Values are given in percentages relative to E18.5. For Pitx2 and Nrp2 the additive effect of several measured genomic regions is shown.
Confirmation of Novel Transcription Factor Binding Sites
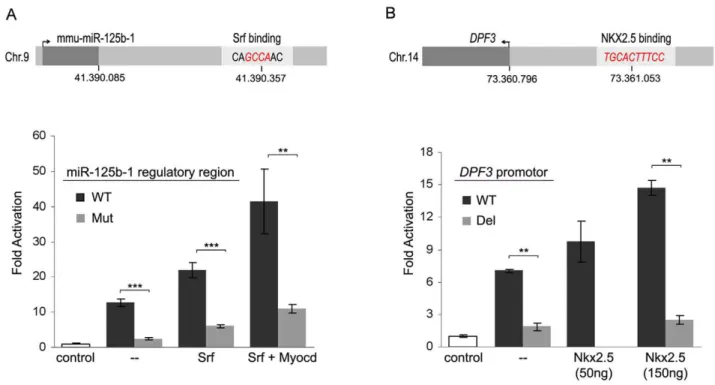
We confirmed a panel of observed transcription factor binding sites by qPCR (Figure S5). Using luciferase reporter gene assays, we validated an Srf binding site in the regulatory region of mouse miR-125b-1 as well as an Nkx2.5 binding element in the core promoter region of humanDPF3. Mmu-miR-125b-1 is known to be deregulated in heart diseases [44] and was found to be differentially expressed in Srf siRNA knockdown. Figure 6A shows the Srf binding motif and respective Srf ChIP-seq peak within the regulatory region of miR-125b-1. Luciferase reporter gene assays with wildtype and mutated fusion constructs confirm its function-ality. Mutation of the potential Srf binding sequence (CAGC-CAACRCATAGTAC) significantly reduced the transcriptional activity of the reporter gene. DPF3 is a novel epigenetic regulator of heart and skeletal muscle development [13]. Within the 1.2kbp promoter region we found three Mef2 matrices and one Nkx2.5 matrix using TRANSFAC MATCH [45]. In case of Mef2a, all three potential binding sites can drive reporter gene expression as reported [13]. Figure 6B shows the binding of Nkx2.5 to the human DPF3 core promoter. Subsequently, co-transfection of reporter construct and increasing amounts of Nkx2.5 expression vector revealed a dose-dependent transcriptional activation by Nkx2.5. In line with this, deletion of the potential Nkx2.5 binding element (TCCACTTTCC) showed that transcriptional activity was indeed mediated through this motif, as activation was lost in the mutated construct.
Srf-Centered Transcription Network Integrating Srf-Binding Events, H3ac, miRNAs, and Differential Expression in Srf Knockdown
In addition to a genome-wide perspective, our analysis also provides useful information on the level of individual genes. We conducted an extensive literature search and built an Srf centered cardiac transcription network, where we subsequently integrated our findings from the Srf and histone 3 acetylation ChIP and Srf siRNA-mediated knockdown experiments (Figure 7). Thus our data add regulatory content to the nodes, which are connected by
referenced interactions. The network depicts common regulation by Srf and H3ac as well as the impact of the posttranscriptional modulation of expression levels by miRNAs. Target genes important in the cardiovascular context are arranged to their biological roles like regulation in muscle contractility or cardiac growth and conduction. As an example the apoptotic machinery is regulated at all three levels (Srf, H3ac and miRNAs) through several pathways involving pro-apoptotic (Casp3, miR-320, Hsp20/a8/a5, Bax) as well as anti-apoptotic (miR-21, Bcl2, Mcl1) genes.
Discussion
We present a systematic in-vivo analysis of three levels regulating cardiac mRNA profiles, namely regulation of gene transcription by epigenetic and genetic factors and posttranscrip-tional regulation by short noncoding RNAs. We performed genome-wide profiling of the DNA occupancy of four key cardiac transcription factors (Gata4, Nkx2.5, Mef2a and Srf) and studied their co-occurrence with four activating histone modifications (H3ac, H4ac, H3K4me2 and H3K4me3) as well as the potential regulatory impact of miRNAs. We combined these data with mRNA expression profiles in wildtype and RNAi mediated knockdown cells and finally confirmed key conclusions in a time-course of cardiac maturation in mouse around birth.
In human and mouse,2,000 transcription factors, more than 100 different modifications of histone residues and,700 miRNAs modulate the mRNA profiles corresponding to ,23,000 genes. Major insights have been gained into the regulation of the transcription process by DNA-binding transcription factors [46– 48]. The role of histone modifications in establishing and maintaining the chromatin status and their function as protein interaction partners has been discovered [12,13,49]. More recently, the high impact of miRNAs on mRNA profiles and their function as inhibitors of the translation process has emerged [43,50–52]. However, we lack data showing the interaction between these three levels of regulation. The initial insights were Figure 5. miRNAs and their impact on the Srf-driven transcription network.(A) RNAi knockdown of Srf in HL-1 cardiomyocytes results in 42 differentially expressed miRNAs (49 loci) (Table S10). Target prediction of these mostly downregulated miRNAs revealed 192 differentially expressed genes, with a higher fraction of upregulated genes (57% of all upregulated genes) compared to downregulated genes (44% of all downregulated genes). (B) Direct Srf targets represent only a small fraction of all differentially expressed genes in Srf knockdown (orange and blue). Targets of differentially expressed miRNAs impact 45% (dark grey) with a partial overlap of direct Srf targets (orange). Approximately 50% of differential expression is driven by other secondary effects (light grey). (C) Exemplary network of indirect gene regulation by miRNAs. The genes Igfbp5, Nfic and Ctnnal1, which are not directly bound by Srf, are predicted targets for a set of downregulated miRNAs and are found to be upregulated in the Srf knockdown.
obtained by focusing on the different levels independently, and it was long thought that transcription factors are the main driving force. We feel that it is a fine-tuned balance and our data favor a comparable impact for all three levels with a high degree of interdependency. Our data indicate that histone 3 acetylation is involved in the regulation of Srf as well as Gata4 dependent cardiac genes and moreover potentially compensates the loss of transcriptional activation in Srf knockdown. Vice versa histone modifying enzymes represent an important group of direct downstream targets of Srf (e.g. histone demethylases containing a Jumonji domain such as Jmjd1c, Jmjd2b, Jmjd3, Jmjd4 and Jmjd5, see Figure 7). A similar picture emerges for the relationship of miRNAs and Srf such that the Argonaute proteins Eif2c2 (Ago2) and Eif2c3 (Ago3), which are direct Srf targets, play a key role for miRNA mediated-mRNA cleavage via the RISC complex [53]. In line with this, we found a panel of miRNAs deregulated in Srf knockdown, explaining three times more differentially expressed genes than Srf binding events alone could do. We are convinced that these data reflect the high degree of interdepen-dency between the different levels. In addition, our data underline the high potency of compensatory regulation between DNA-binding transcription factors. We show that genes regulated by multiple transcription factors were significantly less likely differ-entially expressed in RNAi knockdown of one respective factor. So far, it had been postulated that members of a gene family (e.g. Mef transcription factors [4,54,55]) or factors with redundant paralogs could buffer each others dysfunction [18]. Our data extend these
findings to primarily unrelated transcription factors, which share common targets.
The observed correlation of histone 3 acetylation with Srf and Gata4 target gene activation underlines the beneficial effects seen for HDAC inhibitors for a variety of disease states [17]. Further, we favor the view that modulation of the histone modification status might be a plausible explanation for incomplete penetrance or phenotypic diversity as frequently observed in mouse models with identical genetic background or in human disease such as congenital heart disease. Here, a distinct gene mutation can lead to a broad portfolio of phenotypes, such as mutations in Cited-2 [56,57]. Environmental factors are potentially causative for these observation and recent reports show a link between environment and alterations of histone modifications. Thus, the change of the phosphorylation status and thereof the activity of histone modifying enzymes mediated for example via the calcium/calmodulin-dependent protein kinase II (CaMKII) could represent a mechanistic explanation [58–60].
In accordance with others, we found that the overwhelming proportion of differentially expressed genes in our RNAi experiments were indirect targets of the respective transcription factor. Computational studies suggest that up to 30% of all human genes are regulated by miRNAs, while each miRNA may control hundreds of gene targets [61,62]. Our in-vivo data highlight the global impact of miRNAs on expression profile alterations seen in transcription factor loss-of-function studies. Differentially ex-pressed miRNAs in Srf knockdown potentially explain up to 45% of the altered mRNA profile in our study.
Figure 6. Promoter analysis of miR-125b-1 andDPF3.(A) Srf ChIP-seq analysis revealed an Srf binding region downstream of mmu-miR-125b-1. Shown are the positions of mmu-miR-125b-1 and the Srf binding motif with its core sequence in red. The Srf ChIP-seq peak region was cloned as mmu-miR-125b-1 promoter into the pGL3basic vector for luciferase reporter gene assay. Srf alone and in combination with its cofactor Myocardin (Myocd) significantly increases the activation of the luciferase beyond activation driven by endogenous Srf. Mutation of the core sequence (GCCARTAGT) of the Srf binding motif (Mut) abolished activation by Srf and Myocd compared to the wildtype (WT). (B) ChIP-chip showed binding of Nkx2.5 to an evolutionary human-mouse conserved region of theDPF3core promoter. Depicted is the Nkx2.5 binding element, which were deleted for luciferase reporter gene assays (red). TheDPF3core promoter fused to luciferase alone and in combination with increasing amounts of Nkx2.5 expression vector showed dose-dependent activation by Nkx2.5 beyond the endogenous Nkx2.5 activation. Deletion of the Nkx2.5 binding element (red) abolished activation by Nkx2.5 compared to the wildtype (WT). The empty pcDNA3.1 expression vector and the empty pGL3basic luciferase reporter vector served as controls for transcription factors and reporter constructs, respectively. The resulting p-values are indicated: p,0.001 (***), p,0.01 (**).
In summary, our data indicate that the different levels regulating mRNA profiles have a high degree of interdependency. The different nodes of the regulatory network have the potential to modulate each other and should therefore be viewed in context. Further functional tests will be required to evaluate regulatory circuits on a single gene basis. It will be of interest to study how the interdependency of the different factors stabilizes the overall function of given networks, and how it contributes to the resistance to external disturbances as well as to the impact of novel therapeutic tools such as HDAC inhibitors or antagomirs.
Materials and Methods
All methods are abbreviated and additional information is provided in the online supplement.
Ethics Statement
Human cardiac tissue was obtained from the German Heart Center with ethical approval by the responsible institutional review committee (Charite´ 129/2000) and informed consent of patients [63].
Cell Culture and Cardiac Samples
HL-1 cells were provided by Prof. William C. Claycomb (Departments of Biochemistry and Molecular Biology and Cell Biology and Anatomy, Louisiana State University Medical Center, New Orleans, LA 70112) and cultured as described [64]. The cells were used for experiments at their maximum contraction. HEK293T cells were cultivated according to standard protocols. Mouse hearts at the indicated stages of CD1 and C57/Bl6 strain were dissected in cold PBS from the rest of the body. For Figure 7. Srf-centered transcription network integrating Srf binding events, H3ac, miRNAs, and differential expression in Srf knockdown.The shown transcription network is based on an extensive literature search [7,26,41,43,79–120] and integration of our findings. Our data add the regulatory content to the nodes, which are connected by referenced interactions. It illustrates the common regulation by Srf and histone 3 acetylation (H3ac) as well as the impact of the posttranscriptional modulation of expression levels by miRNAs. Data based on Illumina expression array, ChIP-chip/seq, miRNA-seq and qPCR. Srf binding and H3ac occurrence are depicted in small boxes and up- (red) or downregulation (green) in Srf knockdown is further indicated.
subsequent RNA isolation heart samples were directly snap frozen in liquid nitrogen and stored at 280uC. For ChIP or histology experiments heart samples were fixed with formaldehyde or paraformaldehyde, respectively.
siRNA and Cell Transfection
For RNAi knockdown HL-1 cells were transfected with two different siRNAs (Qiagen) per transcription factor (Table S12) using two biological replicates each (4 replicates in total). As a control, the cells were transfected with an unspecific siRNA (siNon). Cells were grown to 70–80% confluence for at least two days without addition of antibiotics. 36105cells were seeded into 6-well plates with 2ml media resulting in 70–80% confluence after 4h. The mixture of 9ml (20mM) siRNA in 270ml of DMEM media and 16ml Lipofectamine 2000 (Invitrogen) in 470ml DMEM media was incubated for 20min at room temperature and added drop wise to the cells. The cell culture media was changed after 24h and cells were harvested for protein extraction or RNA preparation after 48h. For reporter gene assays HEK293T cells were transfected with Transfast (Promega) according to manufacturer’s instruction.
mRNA Expression Analysis in Wild-Type and siRNA– Treated Cells
Total RNA of cultured cells and heart tissues was isolated using TRIzol reagent (Invitrogen) followed by DNase digest (Promega) and ethanol precipitation according to standard protocols. Reverse transcription reactions were carried out via AMV-RT (Promega) with random hexamers (Amersham Pharmacia Biotech). Illumina array analysis was performed by Integragen (France). For each set of experiments two biological and two technical replicates were analyzed using Illumina Mouse-6 v1.1 genome-wide microarrays. To verify transcript expression levels of HL-1 cells and mouse hearts, quantitative real-time PCR measurements were performed using SYBR Green PCR Master Mix (ABgene) and the ABI PRISM 7900HT Sequence Detection System. Gene expression was calculated using theDCT method with normalization to the housekeeping geneHprt. Primer sequences and additional results are given in Tables S8 and S13 and Figure S1.
Analysis of mRNA Expression Data in Wild-Type and siRNA–Treated Cells
The raw and transformed data of the Illumina expression microarrays (Mouse-6 v1.1 genome wide arrays) were deposited in the ArrayExpress database at the EBI (accession code E-TABM-376). Probe intensities were obtained from Integragen (France). Probes were filtered according to the detection score given by the Illumina array analysis software BeadStudio. Only probes with a detection score greater or equal to 0.95 in at least one experiment were retained. Probe intensities were qspline normalized and probes assigned to one transcript (Ensembl v46, mm8) were normalized using the median polish procedure. Differential expression was determined using the limma package [65] of Bioconductor 2.0 [66] and p-values were corrected for multiple testing according to Benjamin and Yekutieli [67]. Only transcripts with p-value smaller or equal to 0.05 in both siRNA-mediated knockdowns when compared to siNon-treated cells were consid-ered to be significantly differentially expressed.
MicroRNA Expression Analysis
Small RNAs were isolated from total RNA of HL-1 cells and prepared for miRNA sequencing using Illumina Kit FG-102-1009 according to manufacturer’s protocol. For quantification of
miR-133a-1 in mouse hearts stem-loop qPCR (primer sequence: GTTGGCTCTGGTGCAGGGTCCGAGGTATTCGCACCA-GAGCCAACCAGCTG) and TaqMan qPCR (forward primer: 59ATTAATTTGGTC CCCTTCAAC, reverse primer:59GT-GCAGGGTCCGAGGT, TaqMan probe 21 (Roche)) were performed as described elsewhere [68,69].
MicroRNA-seq Data Analysis
Small RNAs were sequenced by Illumina/Solexa next-genera-tion (single-end) sequencing technology. The small RNA-seq data were deposited in the Gene Expression Omnibus (GEO) database at the NCBI (accession code GSE26397). In two independent siRNA-mediated knockdowns of Srf (Srf-si1 & Srf-si2) and an unspecific siRNA we retrieved 14,911,499 (Srf-si1), 14,518,157 (Srf-si2) and 14,742,382 (siNon) unfiltered 36bp reads, which yielded 5,634,650 (Srf-si1), 5,503,661 (Srf-si2) and 5,674,429 (siNon) unique (i.e. non-redundant) read sequences. These reads were mapped to the mouse reference genome (NCBI v37, mm9) using MicroRazerS [70] allowing at most 20 equally-best hits for each read and using a seed length of 16 bases with at most one mismatch. For Srf-si1 96.7%, for Srf-si2 96.2% and for siNon 96.5% of all unique sequences could be mapped to the mouse genome. In total 402 miRNAs were identified, corresponding to 450 different loci. To annotate the aligned sequence reads with miRNAs, we checked for overlaps with miRNA positions (http:// www.miRBase.org/, release 14.0). We tested for differential expression between the Srf-si1/2 and siNon libraries using Fisher’s exact test with FDR correction for multiple testing (p#0.05). For all miRNAs identified as significantly differentially expressed in at least one siRNA knockdown of Srf (but both either up- or downregulated) compared to negative control we did target gene predictions using the miRanda v3.0 algorithm [71]. Finally, the target prediction revealed 192 of 429 differentially expressed genes. Using a fisher exact test we found the number to be statistical significant when compared to a prediction based on all versus differentially expressed genes (p = 1.77e-5).
miRNA Expression Levels in HL-1 Cells Compared to Human Right Ventricle
The number of unfiltered 36bp reads for wildtype HL-1 was 14,440,535, while the human heart samples produced 14,475,968 1, normal heart (NH)), 16,270,049 2), 12,940,172 (NH-3) and 14,890,970 (NH-4) unfiltered reads, respectively, yielding 5,541,954 (HL-1), 5,176,852 (NH-1), 7,189,852 (NH-2), 3,397,365 (NH-3) and 5,075,129 (NH-4) unique reads. Mapping to mouse and human reference genomes (mm9, NCBI v37 and hg18, NCBI v36) was performed by MicroRazerS [70] allowing at most one mismatch and 20 equally-best hits per read with a seed length of 16 (mouse) and 18 (human), respectively. 97% (HL-1) and 87–91% (NH-1-4) of all unique sequences could be mapped to the corresponding reference genome. In total 196 common, 107 mouse-specific and 180 human-specific miRNA families were found (http://www.miRBase.org, release 14.0). To account for cross-species differences in the specific-expression levels, we used rank-transformed miRNA expression levels for comparison.
Chromatin Immunoprecipitation
hybridized according to NimbleGen standard procedure. Sample preparation for ChIP-seq of HL-1 cells was performed according the Illumina library preparation procedure. Two pooled biological replicates for Srf and H3ac were sequenced using Illumina/Solexa next-generation (single-end) sequencing technology. ChIP-chip and ChIP-seq data were confirmed by quantitative real-time PCR using the SyberGreen I PCR Master Mix (Abgene) and the ABI PRISM 7900HT Sequence Detection System or using the RealTime ready DNA Probes Master with the Universal ProbeLibrary and the LightCycler 1536 (Roche). Results of ChIP-qPCR experiments are given in Figure S5 and primer sequences for verifications in Table S13. ChIP after siRNA knockdown of Srf in Hl-1 cells was performed using the LowCell ChIP Protein A Kit from Diagenode according to the manufac-ture’s instructions.
ChIP-chip Data Analysis
The raw and transformed data of the ChIP-chip experiments and the array design were deposited in the ArrayExpress database (accession code E-TABM-378 and A-MEXP-893). We designed a set of two 385k NimbleGen arrays to represent enhancer and promoter regions of 12,625 transcriptional start sites based on a broad panel of muscle relevant data source (Table S1) [13]. The arrays represented 89Mbp of the mouse genome build mm8 and contained 740,000 probes with a tiling of 110bp (50–60bp gap between probes). This included conserved regions (based on PhastCons [31] score thresholds of 0.2) within 10kb upstream, the full sequence within 2kb upstream and the first exon and intron of the corresponding transcript.
The array intensities of each channel were normalized and log-transformed using VSN [73]. Log-ratio enrichment levels for each probe were calculated by subtraction of log Cy3 (Input) from log Cy5 (ChIP sample). The signal of transcription factors were smoothed by calculating a median over the probes inside a sliding window of 600bp. To distinguish enriched probes a z-score and empirical p-value for each probe on the null hypothesis that these z-scores have a symmetric distribution with mean zero was calculated. Significant probe positions (corrected for multiple testing [74], FDR,0.1), with a distance less than 210bp were combined into transcription factor binding sites. The histone binding sites were identified as described previously [39].
ChIP-seq Data Analysis
The ChIP-seq data were deposited in the GEO database (accession code GSE26397). Of the initial 6,967,318 and 8,364,328 sequence reads obtained in the Srf and H3ac ChIP-seq experiment, respectively, 4,543,634 (65.2%) for Srf and 6,141,144 (73.4%) for H3ac could be mapped to the mouse reference genome (NCBI v37, mm9) using the read mapping tool RazerS [75]. Only uniquely mapped 36nt reads with at most two mismatches were retained. To identify enriched regions we used the CisGenome software [76]. For Srf we used a window size of 100bp, a step size of 25bp and a read count level of 10 (FDR = 1.6%). For H3ac we applied a window size of 250bp, a step size of 50bp and a read count level of 10 (FDR = 4.7%). After peak localization the found Srf and H3ac peaks were filtered (see Text S1) identifying 2,190 Srf and 10,486 H3ac ChIP-seq peaks.
TFBS Conservation Analysis
The occurrence of transcription factor binding motifs within observed peaks was analyzed with TRANSFAC MATCH program [45] by using 6250bp sequence surrounding the peak center and position weight matrices corresponding to the studied factors obtained from TRANSFAC [29]. The TRANSFAC
matrices used for motif search are listed in Table S7. Presence of the CArG-box was determined by searching the pattern CC(A/ T)6GG with two errors at most. The degree of conservation of respective motifs was studied using PhastCons conserved elements [31]. In addition 100% conservation between human and mouse was defined using 100bp windows.
Occurrence and Co-Occurrence of TFBS
Identified ChIP-chip or ChIP-seq binding sites were assigned to transcriptional start sites if located within 10kb upstream or in the transcribed region. General co-regulation of a gene by two or more transcription factors was defined irrespective of the distance between the binding sites. In addition, co-occurrence between transcription factors or histone modifications was defined if the centers of the peaks had a distance below6500bp.
Gene Ontology Associations to Gene Groups
The association of gene groups to Gene Ontology (GO) terms [77] was assessed as described previously [78] (conditional hypergeometric test, p,0.001). To analyze the association of differentially expressed transcripts with GO categories, transcripts were mapped to genes. Overrepresentation was tested against all genes represented on the ChIP and siRNA array, respectively.
Data Analysis
Standard bioinformatic analysis was carried out using R and Bioconductor packages [66] as well as Perl and its BioPerl modules. If not mentioned otherwise, p-values given are based on Student’s t-test.
Protein Extraction and Western Blot
Specific or non-specific siRNA treated HL-1 cardiomyocytes were used for Western Blot analysis to monitor the knockdown efficiency at protein level. HL-1 cells were treated with lysis buffer (20mM Tris-HCl pH 7.4, 150nM NaCl, 1mM EDTA, 1% Triton, 1mM DTT, 0.1mM PMSF, 16Protease Inhibitor Cocktail, 1mM
NaVO4) for protein extraction. Western Blot was performed according to standard protocols. All antibodies with their respective dilution are given in Table S14.
Reporter Gene Assays and Site-Directed Mutagenesis
Reporter constructs were made by cloning the 385bp long human DPF3 minimal promoter (chr14:72.430.563–72.430.943, NCBI36/hg18) and the 485bp long regulatory region downstream of mmu-miR-125b-1 (chr9:41.390.238–41.390.700, NCBI37/ mm9) into the pGL3 basic vector (Promega). Transient co-transfections were carried out in triplicates in 96-well plates in HEK293T cells by transfecting 50ng of reporter vector, 5ng of Firefly luciferase vector for internal normalization of transfection efficiency and 50–150ng of the respective expression vectors. Activity was measured by Dual-Luciferase assay (Promega) after 48 hours. Site-directed mutagenesis of DNA was carried out using the QuikChange site-directed mutagenesis kit (Stratagene) accord-ing to manufacturer’s instructions. Oligonucleotides for mutagen-esis were designed to introduce deletions or mutations of the potential Nkx2.5 or Srf binding sites. Mutagenesis was confirmed by plasmid sequencing carried out at MWG Biotech.
Immunocytochemistry
acid buffer (pH 6). Blocking was carried out in 5% normal goat serum in PBS for 1h at room temperature. Primary and secondary antibodies were applied in the same buffer for 2h at room temperature, each followed by three washes in PBS and a DAPI counterstaining. Antibodies with their respective dilution are listed in Table S14. The sections were mounted in Flouromount G (Electron Microscopy Science) and examined on a Zeiss LSM 510 META confocal microscope (Carl Zeiss).
Supporting Information
Figure S1 RNAi induced knockdown of Gata4, Mef2a, Nkx2.5 and Srf. Knockdown efficiency of two different siRNAs per transcription factor in HL-1 cells was analyzed on protein level by (A) Western Blot and (B) quantitative real-time PCR 48h after transfection. Histone 3 served as loading control. mRNA expression levels are normalized toHprtand relative to unspecific siRNA.
Found at: doi:10.1371/journal.pgen.1001313.s001 (0.12 MB TIF)
Figure S2 Influence of RNAi knockdown of Srf, Gata4, Mef2a and Nkx2.5 on cell death 48h after transfection. (A) Cell viability study. (B) Annexin apoptosis assay.
Found at: doi:10.1371/journal.pgen.1001313.s002 (0.12 MB TIF)
Figure S3 Co-occurrence of transcription factor binding sites with histone modifications. Transcription factor binding sites of Gata4, Mef2a, Nkx2.5 and Srf co-occur in ,80% with one or more histone marks. The overlap of the transcription factor binding events and the respective histone modification H3ac, H3K4me2, H3K4me3 and H4ac is 55% on average. The expected percentage overlap would be 23–38% based on 100times random distribution of transcription factor binding sites on genomic sequences.
Found at: doi:10.1371/journal.pgen.1001313.s003 (0.06 MB TIF)
Figure S4 The activating potential of Srf in relation to accompanying histone modifications. Srf binding sites were classified into five classes: ‘Srf only’ (only binding of Srf, no histone modification is observed), H3ac, H3K4me2, H3K4me3 and H4ac (histone modification in addition to Srf binding). Boxplots representing the distribution of expression levels of transcripts assigned to these binding sites are shown. The number of transcripts belonging to each group are indicates in brackets below the group name. A single transcript can belong to multiple groups if it has multiple histone modifications. Estimated coefficients for the influence of individual histone modifications on target gene expression and their associated p-values are derived by a linear model using least square estimation and F statistics. The ‘Srf only’ group was taken as reference.
Found at: doi:10.1371/journal.pgen.1001313.s004 (0.09 MB TIF)
Figure S5 ChIP-chip confirmation by qPCR. Known and novel binding sites of Gata4 (A), Mef2a (B), Nkx2.5 (C) and Srf (D) were confirmed by quantitative real-time PCR.
Found at: doi:10.1371/journal.pgen.1001313.s005 (0.08 MB TIF)
Table S1 Source considered for array design.
Found at: doi:10.1371/journal.pgen.1001313.s006 (0.23 MB PDF)
Table S2 ChIP-chip confirmation by literature. Conformation of 42 genes, which were previously described to be directly or indirectly regulated by Gata4, Mef2a, Nkx2.5 or Srf as pointed out in the given publication.
Found at: doi:10.1371/journal.pgen.1001313.s007 (0.29 MB PDF)
Table S3 GO term analysis of genes bound by Gata4. Statistical analysis of overrepresented ‘Biological process’ GO term
associ-ation of genes regulated by Gata4 in HL-1 cells according to ChIP-chip data.
Found at: doi:10.1371/journal.pgen.1001313.s008 (0.24 MB PDF)
Table S4 GO term analysis of genes bound by Mef2a. Statistical analysis of overrepresented ‘Biological process’ GO term associ-ation of genes regulated by Mef2a in HL-1 cells according to ChIP-chip data.
Found at: doi:10.1371/journal.pgen.1001313.s009 (0.24 MB PDF)
Table S5 GO term analysis of genes bound by Nkx2.5. Statistical analysis of overrepresented ‘Biological process’ GO term association of genes regulated by Nkx2.5 in HL-1 cells according to ChIP-chip data.
Found at: doi:10.1371/journal.pgen.1001313.s010 (0.23 MB PDF)
Table S6 GO term analysis of genes bound by Srf. Statistical analysis of overrepresented ‘Biological process’ GO term associ-ation of genes regulated by Srf in HL-1 cells according to ChIP-chip data.
Found at: doi:10.1371/journal.pgen.1001313.s011 (0.24 MB PDF)
Table S7 TRANSFAC identifier. Transcription factor binding matrices which were used for motif search.
Found at: doi:10.1371/journal.pgen.1001313.s012 (0.23 MB PDF)
Table S8 Genes deregulated in RNAi knockdown of Gata4, Mef2a, Nkx2.5 and Srf. Deregulation of gene expression for a subset of genes was determined using quantitative real-time PCR. Fold changes are calculated in relation to unspecific siRNA treated cells.
Found at: doi:10.1371/journal.pgen.1001313.s013 (0.27 MB PDF)
Table S9 MiRNAs with Srf binding events. ChIP-seq analysis reveals 22 miRNAs with at least one Srf binding event within a genomic region of610kb. Srf-ChIP peaks and miRNA positions based on mouse genome NCBIv37 (mm9).
Found at: doi:10.1371/journal.pgen.1001313.s014 (0.23 MB PDF)
Table S10 Significantly deregulated miRNAs in Srf knockdown. 42 miRNAs (49 loci) were differentially expressed in Srf knockdown compared to control miRNA loci based on mouse genome NCBIv37 (mm9). Matched reads to mature and star miRNA sequence based on miRBase annotations (release 14.0). Found at: doi:10.1371/journal.pgen.1001313.s015 (0.32 MB PDF)
Table S11 Predicted miRNA targets (corresponding to Figure 5C). Igfbp5, Nfic and Ctnnal1 represent up-regulated genes with predicted miRNA target sites of down regulated miRNAs in Srf knockdown.
Found at: doi:10.1371/journal.pgen.1001313.s016 (0.24 MB PDF)
Table S12 siRNAs sequences. Sequences of siRNAs used in RNAi experiments of Gata4, Mef2a, Nkx2.5 and Srf in HL-1 cells. Found at: doi:10.1371/journal.pgen.1001313.s017 (0.23 MB PDF)
Table S13 Oligonucleotide sequences. Primer sequences used for qPCR expression measurements and ChIP-chip verification and TaqMan Assays used for ChIP-qPCR measurements are listed.
Found at: doi:10.1371/journal.pgen.1001313.s018 (0.28 MB PDF)
Table S14 Antibodies. Antibodies used in ChIP, Immunocyto-chemistry and Western Blot and their respective amount used in the experiments are given.
Found at: doi:10.1371/journal.pgen.1001313.s019 (0.24 MB PDF)
(mm8). Peaks were subsequently assigned to genes if they lay less than 10 kb upstream or inside a gene (Ensembl v45).
Found at: doi:10.1371/journal.pgen.1001313.s020 (0.41 MB XLS)
Table S16 Srf and H3ac enriched ChIP-seq peaks according to CisGenome software. Sequence reads were mapped to mouse genome NCBIv37 (mm9) using RazerS. Peaks were subsequently assigned to genes if they lay less than 10 kb upstream or inside a gene (Ensembl v54).
Found at: doi:10.1371/journal.pgen.1001313.s021 (1.62 MB XLS)
Table S17 Gata4, Mef2a, Nkx2.5, and Srf differentially expressed genes (Ensembl v45) using duplicates of two different siRNAs.
Found at: doi:10.1371/journal.pgen.1001313.s022 (0.21 MB XLS)
Table S18 List of miRNAs and target genes of differentially expressed miRNAs in HL-1 cells treated with Srf siRNAs. MiRNA loci based on mouse genome NCBIv37 (mm9). Matched reads to mature and star miRNA sequence based on miRBase annotations (release 14.0). For all miRNAs (in total 77) identified as significantly differentially expressed in at least one siRNA
knockdown of Srf (Srf-si1/Srf-si2, but both either up- or downregulated) compared to negative control target gene predictions using the miRanda v3.0 algorithm were performed. For prediction the mature miRNA sequences and the 39UTR sequences from all differentially expressed genes were used. Found at: doi:10.1371/journal.pgen.1001313.s023 (0.10 MB XLS)
Text S1 Additional supporting Materials and Methods. Found at: doi:10.1371/journal.pgen.1001313.s024 (0.31 MB PDF)
Acknowledgments
We thank the Huber Lab and the Vingron Lab for fruitful discussions, Julia Kofent and the next-generation sequencing service group of Bernd Timmermann for technical contributions. We gratefully acknowledge the support of the LightCycler 1536 by Roche Applied Science. We thank the German Heart Center (Roland Hetzer, Felix Berger) and patients for their cooperation.
Author Contributions
Conceived and designed the experiments: JJF SRS. Performed the experiments: JS JJF QZ ML MT ID. Analyzed the data: MS MG TK SRS. Wrote the paper: JS MS MG SRS.
References
1. Molkentin JD, Lin Q, Duncan SA, Olson EN (1997) Requirement of the transcription factor GATA4 for heart tube formation and ventral morphogen-esis. Genes Dev 11: 1061–1072.
2. Kuo CT, Morrisey EE, Anandappa R, Sigrist K, Lu MM, et al. (1997) GATA4 transcription factor is required for ventral morphogenesis and heart tube formation. Genes Dev 11: 1048–1060.
3. Lyons I, Parsons LM, Hartley L, Li R, Andrews JE, et al. (1995) Myogenic and morphogenetic defects in the heart tubes of murine embryos lacking the homeo box gene Nkx2-5. Genes Dev 9: 1654–1666.
4. Naya F, Black B, Wu H, Bassel-Duby R, Richardson J, et al. (2002) Mitochondrial deficiency and cardiac sudden death in mice lacking the MEF2A transcription factor. Nat Med 8: 1303–1309.
5. Niu Z, Yu W, Zhang SX, Barron M, Belaguli NS, et al. (2005) Conditional mutagenesis of the murine serum response factor gene blocks cardiogenesis and the transcription of downstream gene targets. J Biol Chem 280: 32531–32538. 6. Miano JM, Ramanan N, Georger MA, de Mesy Bentley KL, Emerson RL, et al. (2004) Restricted inactivation of serum response factor to the cardiovascular system. Proc Natl Acad Sci USA 101: 17132–17137.
7. Balza RO Jr., Misra RP (2006) Role of the serum response factor in regulating contractile apparatus gene expression and sarcomeric integrity in cardiomy-ocytes. J Biol Chem 281: 6498–6510.
8. Karamboulas C, Dakubo GD, Liu J, De Repentigny Y, Yutzey K, et al. (2006) Disruption of MEF2 activity in cardiomyoblasts inhibits cardiomyogenesis. J Cell Sci 119: 4315–4321.
9. Searcy RD, Vincent EB, Liberatore CM, Yutzey KE (1998) A GATA-dependent nkx-2.5 regulatory element activates early cardiac gene expression in transgenic mice. Development 125: 4461–4470.
10. Spencer JA, Misra RP (1996) Expression of the serum response factor gene is regulated by serum response factor binding sites. J Biol Chem 271: 16535–16543.
11. Kouzarides T (2007) Chromatin modifications and their function. Cell 128: 693–705.
12. Ruthenburg AJ, Li H, Patel DJ, Allis CD (2007) Multivalent engagement of chromatin modifications by linked binding modules. Nat Rev Mol Cell Biol 8: 983–994.
13. Lange M, Kaynak B, Forster UB, Tonjes M, Fischer JJ, et al. (2008) Regulation of muscle development by DPF3, a novel histone acetylation and methylation reader of the BAF chromatin remodeling complex. Genes Dev 22: 2370–2384. 14. Thorne JL, Campbell MJ, Turner BM (2009) Transcription factors, chromatin
and cancer. Int J Biochem Cell Biol 41: 164–175.
15. Wang Z, Zang C, Cui K, Schones DE, Barski A, et al. (2009) Genome-wide mapping of HATs and HDACs reveals distinct functions in active and inactive genes. Cell 138: 1019–1031.
16. Chang S, McKinsey TA, Zhang CL, Richardson JA, Hill JA, et al. (2004) Histone deacetylases 5 and 9 govern responsiveness of the heart to a subset of stress signals and play redundant roles in heart development. Mol Cell Biol 24: 8467–8476.
17. Haberland M, Montgomery RL, Olson EN (2009) The many roles of histone deacetylases in development and physiology: implications for disease and therapy. Nat Rev Genet 10: 32–42.
18. Gitter A, Siegfried Z, Klutstein M, Fornes O, Oliva B, et al. (2009) Backup in gene regulatory networks explains differences between binding and knockout results. Mol Syst Biol 5: 276.
19. Yu M, Riva L, Xie H, Schindler Y, Moran T, et al. (2009) Insights into GATA-1-Mediated Gene Activation versus Repression via Genome-wide Chromatin Occupancy Analysis. Molecular Cell 36: 682–695.
20. Phuc Le P, Friedman JR, Schug J, Brestelli JE, Parker JB, et al. (2005) Glucocorticoid receptor-dependent gene regulatory networks. PLoS Genet 1: e16. doi:10.1371/journal.pgen.0010016.
21. Kwon Y-S, Garcia-Bassets I, Hutt KR, Cheng CS, Jin M, et al. (2007) Sensitive ChIP-DSL technology reveals an extensive estrogen receptor alpha-binding program on human gene promoters. Proc Natl Acad Sci USA 104: 4852–4857. 22. Hu Z, Killion PJ, Iyer VR (2007) Genetic reconstruction of a functional
transcriptional regulatory network. Nat Genet 39: 683–687.
23. Harbison C, Gordon D, Lee T, Rinaldi N, Macisaac K, et al. (2004) Transcriptional regulatory code of a eukaryotic genome. Nature 431: 99–104. 24. Cordes KR, Sheehy NT, White MP, Berry EC, Morton SU, et al. (2009) miR-145 and miR-143 regulate smooth muscle cell fate and plasticity. Nature 460: 705–710.
25. Kwon C, Han Z, Olson EN, Srivastava D (2005) MicroRNA1 influences cardiac differentiation in Drosophila and regulates Notch signaling. Proc Natl Acad Sci U S A 102: 18986–18991.
26. Chen JF, Mandel EM, Thomson JM, Wu Q, Callis TE, et al. (2006) The role of microRNA-1 and microRNA-133 in skeletal muscle proliferation and differentiation. Nat Genet 38: 228–233.
27. Niu Z, Li A, Zhang SX, Schwartz RJ (2007) Serum response factor micromanaging cardiogenesis. Curr Opin Cell Biol 19: 618–627.
28. Zhao Y, Ransom JF, Li A, Vedantham V, von Drehle M, et al. (2007) Dysregulation of cardiogenesis, cardiac conduction, and cell cycle in mice lacking miRNA-1-2. Cell 129: 303–317.
29. Knuppel R, Dietze P, Lehnberg W, Frech K, Wingender E (1994) TRANSFAC retrieval program: a network model database of eukaryotic transcription regulating sequences and proteins. J Comput Biol 1: 191–198. 30. Miano JM, Long X, Fujiwara K (2007) Serum response factor: master regulator
of the actin cytoskeleton and contractile apparatus. Am J Physiol Cell Physiol 292: C70–81.
31. Siepel A, Bejerano G, Pedersen J, Hinrichs A, Hou M, et al. (2005) Evolutionarily conserved elements in vertebrate, insect, worm, and yeast genomes. Genome Res 15: 1034–1050.
32. Akazawa H, Komuro I (2005) Cardiac transcription factor Csx/Nkx2-5: Its role in cardiac development and diseases. Pharmacol Ther 107: 252–268. 33. Clark KL, Yutzey KE, Benson DW (2006) Transcription factors and congenital
heart defects. Annual Review of Physiology 68: 97–121.
34. Kobayashi S, Lackey T, Huang Y, Bisping E, Pu WT, et al. (2006) Transcription factor gata4 regulates cardiac BCL2 gene expression in vitro and in vivo. Faseb J 20: 800–802.