i
POLITICIZATION OF NON-POLITICAL EVENTS:
A Geospatial Analysis of Twitter Content During
The 2014 FIFA World Cup
ii
POLITICIZATION OF NON-POLITICAL EVENTS:
A Geospatial Analysis of Twitter Content
During The 2014 FIFA World Cup
Dissertation supervised by
PhD Marco Painho,
PhD Edzer Pebesma,
PhD Sven Casteleyn
iii
ACKNOWLEDGMENTS
First of all, I would like to express my gratitude and appreciation to EU educational bodies, particularly EACEA and MSGT consortium, which made this study possible for me and many people from different countries.
I wish to acknowledge the help provided by Dr. Painho, who initially raised my interest to geoinformatics, being a teacher, and then kindly agreed to be my thesis supervisor. His guidance was enthusiastic and patient at the same time, making our work a great pleasure for me. My co-supervisors from WWU and UJI, Dr. Pebesma and Dr. Casteleyn, have provided valuable suggestions and additional points of view on the problem, helping me to clarify things where necessary.
I would like to give special thanks to Dr. Alan Glennon who was helping me with the main idea of this thesis topic that’s made things much easier than they could be for me.
iv
POLITICIZATION OF NON-POLITICAL EVENTS:
A Geospatial Analysis of Twitter Content
During The 2014 FIFA World Cup
ABSTRACT
Spatial analysis and social network analysis typically take into consideration social
processes in specific contexts of geographical or network space. The research in
political science increasingly strives to model heterogeneity and spatial dependence.
To better understand and geographically model the relationship between “non -political” events, streaming data from social networks, and political climate was the primary objective of the current study. Geographic information systems (GIS) are
useful tools in the organization and analysis of streaming data from social networks.
In this study, geographical and statistical analysis were combined in order to define
the temporal and spatial nature of the data eminating from the popular social
network Twitter during the 2014 FIFA World Cup. The study spans the entire globe
because Twitter’s geotagging function, the fundamental data that makes this study possible, is not limited to a geographic area. By examining the public reactions to an
inherenlty non-political event, this study serves to illuminate broader questions
about social behavior and spatial dependence. From a practical perspective, the
analyses demonstrate how the discussion of political topics fluсtuate according to
football matches. Tableau and Rapidminer, in addition to a set basic statistical
methods, were applied to find patterns in the social behavior in space and time in
different geographic regions. It was found some insight into the relationship
between an ostensibly non-political event – the World Cup - and public opinion
transmitted by social media. The methodology could serve as a prototype for future
studies and guide policy makers in governmental and non-governmental
v
KEYWORDS
GIS Applications
Geographical Information Systems
Spatial Decision Support Systems
Politics
Spatial analysis
Geo-social analysis
Clustering
Distribution
PostGIS
R
Terms
English language
Spanish language
German language
Portuguese language
Russian language
RapidMiner
vi
INDEX OF THE TEXT
ACKNOWLEDGMENTS ... iii
ABSTRACT ... iv
KEYWORDS ... v
INDEX OF TABLES ... viii
INDEX OF FIGURES ... ix
1. INTRODUCTION ... 1
1.1. Theoretical Framework ... 1
1.2. The Intersection of Twitter and Politics in Related Literature ... 2
1.3. Objectives ... 4
1.4. Research questions ... 5
1.5. Hypotheses ... 5
1.6. Methodology ... 6
1.7. Thesis Organization ... 8
2. RESEARCH DATA DESCRIPTION AND ORGANIZATION ... 9
2.1. Data description ... 9
2.2. Data limitations ... 11
2.3. Data preparation ... 12
3. ANALYZING GEOTAGGED SOCIAL DATA... 14
3.1. Analysis of term “non-political event” ... 14
3.2. Extracting information from tweets ... 16
3.3. Exploratory analysis ... 22
3.4. Spatial analyses ... 35
3.5. Geosocial analysis ... 43
4. CONCLUSION AND FUTURE WORK ... 46
4.1. Conclusion ... 46
4.2. Future work ... 47
vii
ANNEX 1: DATA STRUCTURE TABLES ... 52
ANNEX 2: DIFFERENT DATA SETS OF KEYWORDS IN FINAL DATABASE SORT BY 64
SMALL EVENTS. ... 54
viii
INDEX OF TABLES
Table 1. An example of data in the results database. ... 10
Table 2. Set of keywords showing strong connection with topics about football. ... 18
Table 3. Set of keywords showing strong connection with topics about football and politics. ... 19
Table 4. Set of keywords showing strong connection with topics about politics. ... 19
Table 5. Statistical analysis on a set of Tweets. ... 23
Table 6. Statistical analysis on a set of English Tweets... 24
Table 7. Statistical analysis on a set of Spanish Tweets. ... 25
Table 8. Statistical analysis on a set of Portuguese Tweets. ... 27
Table 9. Statistical analysis on a set of German Tweets. ... 28
Table 10. Statistical analysis on a set of Russian Tweets. ... 29
Table 11. Statistical analysis on a set of Tweets containing keyword “Power”. ... 31
Table 12. Statistical analysis on a set of Tweets with keyword “Changes”. ... 32
Table 13. Statistical analysis on a set of Tweets containing keyword “Elections”. ... 33
Table 14. Statistical analysis on a set of Tweets with keyword “Politic”. ... 34
Table 15. Main keywords for each stage of the World Cup in selected languages. .... 34
ix
INDEX OF FIGURES
Figure 1. Thesis Workflow ... 6
Figure 2. Language groups proportionally represented. ... 13
Figure 3. Basic aspects of event description (Westermann, 2007). ... 14
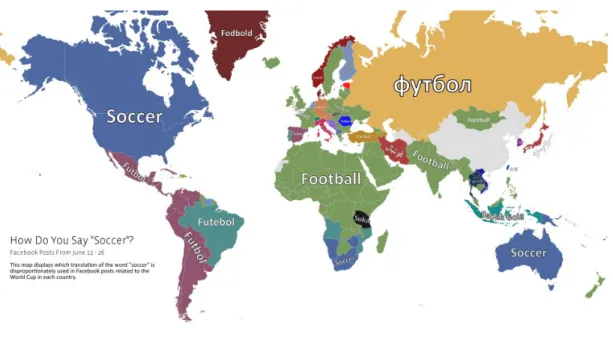
Figure 4. Data analysis explores how people around the world refer to “soccer”
on Facebook. ... 16
Figure 5. The result of applying k-means for the database visuliased in Tableau... 18
Figure 6. Different data sets of keywords in final database sort by 64 small events. . 19
Figure 7. Different data sets of keywords represent in different language groups:
a) English, b) Spanish, c) Portuguese, d) German, e) Russian, f) Total
amount of geotagged tweets. ... 20
Figure 8. The proportion of total Tweets in language groups ... 21
Figure 9. Plot showing the amount of Tweets contains political keywords per day ... 22
Figure 10. Plot showing the amount of Tweets contains political keywords per day
(in English language). ... 24
Figure 11. Plot showing the amount of Tweets contains political keywords per day
(in Spanish language). ... 25
Figure 12. Plot showing the amount of Tweets contains political keywords per day
(in Portuguese language). ... 26
Figure 13. Plot showing the amount of Tweets contains political keywords per day
(in German language). ... 28
Figure 14. Plot showing the amount of Tweets contains political keywords per day
(in Russian language). ... 29
Figure 15. Plot showing the amount of Tweets contains political keywords chosen
x
Figure 16. Plot showing the amount of Tweets, which include keyword “Power”
from the third data set. ... 31
Figure 17. Plot showing the amount of Tweets, which include keyword “Changes” from the third dataset. ... 32
Figure 18. Plot showing the amount of Tweets, which include keyword “Elections” from the third data set. ... 33
Figure 19. Plot showing the amount of Tweets, which include keyword “Politics” from the third data set. ... 33
Figure 20. Dot distribution map of tweets during the 2014 FIFA World Cup. ... 35
Figure 21. Proportional Circle Map of tweet locations during The 2014 FIFA World Cup. ... 36
Figure 22. Proportional Circle Map of English tweets location. ... 37
Figure 23. Proportional Circle Map of Spanish tweets location. ... 38
Figure 24. Proportional Circle Map of Portuguese tweets location. ... 39
Figure 25. Proportional Circle Map of German tweets location. ... 39
Figure 26. Proportional Circle Map of Russian tweets location. ... 40
Figure 27. Proportional Circle Map of Location tweets contain word “Politic”. ... 41
Figure 28. Proportional Circle Map of tweets containing the word “Power”. ... 42
Figure 29. Proportional Circle Map of Location tweets contain word “Elections”. .... 42
Figure 30. Proportional Circle Map of Location tweets contain word “Changes”. ... 43
Figure 31. Map of Average of A Polarity in using political terms during The 2014 FIFA World Cup. ... 44
1
1. INTRODUCTION
1.1.
Theoretical Framework
Advances in modern science, represented by geographic information systems (GIS),
can be applied as a powerful tool for performing an accurate geography-based
analysis of objective data in the domain of political practice (Somers, 2004).
New technologies have created a powerful paradigm shift for new political
campaigning (Spiller & Bergner, 2010). Recently, both political “technologies”,
which can produce an immediate effect, and those technologies which are based on
accurate scientific calculations, have been practiced. This combination allows one to
actively apply the power of information systems to political life and substantiate
political decisions with hard data, rather than subjective suppositions, improving
decision-making efficiency.
In the modern context, geographic information systems are already widely used for
the analysis of voting results and campaign planning. Governmental employees are
one of the largest users of all these opportunities (Ye et al, 2014). The “visualization”
of election results has been practiced for decades. GIS is also useful in the creation of
election districts that give opportunities for local groups to elect preferred
candidates (Clemens, 2015). In fact, an election campaign looks much like a battle
map in the sense that it is important to follow all events and use it in campaigns as
we can see from best practices of numerous earlier campaigns.
Any election campaign implies certain relations between ruling authorities, mass
media and “non-political” events. The nature of these relations varies from country
to country, depending on mass media agencies in question, the particular
government in power, problems that are in the spotlight, the global and domestic
situations and many other things.
Using a variety of thematic maps, business analysis software, and lifestyle mapping
systems, users can quickly determine new areas for development (ESRI, 2007). As we
2
growth in the economic sector, at the same time bringing together different cultures
and promoting trade (Li, 2013). Through such events, domestic political groups and
international campaigns in other countries can easily advertise their strategy over
whole world (Harris et al, 2005).
Because marketers, governmental employees, and researchers use IT systems to
store and analyze large amounts of data, there is concern about the ethics of their
use, especially in regard to personal privacy (Reynolds, 2007). For this purpose, a GIS
must be developed long before the event or study it is intended for, rather than at
the last minute. The results will make sense and be of practical use in this case only.
The World Cup has developed into one of the most significant international sporting
events (Kim, W. et all, 2015). The rising number of cities bidding to host it and the
rising number of investments in the event show that local leaders consider it an
opportunity to improve economic and social aspects of a region or country. As
a result, there has been increased interest on the impact of the World Cup on the
socio-economic and political life of the host city, region, country and world.
1.2.
The Intersection of Twitter and Politics in Related Literature
Some studies have implemented geospatial technologies for geo-social and political
analysis while other studies have focused on detection techniques that retrieve
information about specific topics and terms expressed by a community in real-time
(Palacio, 2015).
As stated by Hanewicz, a great deal of convergence has occurred between wireless
devices, location technologies, and spatial management and analysis tools with the
outcome that many politicians can now manage information in real time in
a seamless manner (2012). "Political marketing" has asserted itself across all
countries, even in small municipalities. According to Wring, political marketing as
“the party or candidate’s use of opinion research and environmental analysis to produce and promote a competitive offering which will help realize organizational
3
Political analysis using social media is drawing the attention of many researchers to
understand public opinion and social trends. With the boom of the online
community, people are expressing their likes and dislikes towards different subjects
in blogs, microblogs and social networking sites like Twitter and Facebook (Singhal et
al, 2015).
This relatively new digital technology has made the exchange of user-generated
content on the internet possible and turned the web into a very popular social
medium. Facebook alone has over one billion active users and overall, people spend
more than one third of their waking hours consuming social media content (Habibi,
2014).
Twitter is a microblogging website where users read and write short messages on
various topics. Analyzing these expressions of short colloquial text can yield vast
information about the behavior of the people, and can be helpful in many other
fields of information technologies (Blenn, 2012). Twitter is currently the second most
popular social media site (eBizMBA, 2015). With the torrential streams of Twitter
updates (or tweets), there's an emerging demand to sieve signals from noises and
harvest useful information.
It has been argued that social networks are a good resource for detecting and
analyzing events (Li, Rui et al, 2012). As a tweet is often associated with spatial and
temporal information, we can detect when and where an event happens. In the
paper "Tedas: A twitter-based event detection and analysis system", a novel system
was proposed. The study focused on Crime and Disaster-Related Events (CDE), such
as shootings, car accidents, or tornadoes. It detects and analyzes by exploring rich
information from Twitter with three functions: detecting new events, ranking them
according to their importance, and generating temporal and spatial patterns for
timeline of events. As the system aims to identify important CDEs for the query,
those tweets are ranked according to their importance. To extract spatial and
temporal patterns for the query, a clustering model groups similar tweets into
different geographic regions or temporal ranges. The results are sent to the
4
Prior to that, Cataldi et al provided a different method to extract specific topics by
analyzing social networks in real-time by the terms expressed by the community
(2010). They based their study on a five steps process.
First step is extraction and formalization of the user-generated content expressed by
the tweets as vectors of terms with their relative frequencies. After they define
a directed graph of the active authors based on their social relationships, their
authority was calculated by relying on the Page Rank algorithm. The third step is
modeling life cycle according to a novel aging theory that leverages the user’s
authority. After researcher can select a set of emerging terms by ranking the
keywords depending on their life status. The last step is the creation of a navigable
topic graph which link the extracted terms with their relative concurrent terms
in order to obtain a set of emerging topics. This study integrates aspects of Cataldi’s
five-step process.
There are also many useful web applications to analyze Twitter, Facebook and other
social streams for serve specific purpose. Trendistic and Twopular represent two
examples from which it is possible to analyze the trends of some keywords along
a timeline specified by the user (Cataldi M. et al, 2013). Users can sift through these
streams, aggregate and rank data, make a decision based on extracted information
and create new knowledge for future works. For the best observation of spatial
components in data set, it is better to use a combination of analytic tools.
1.3.
Objectives
The objective of this study is to detect changes in discussion topics during the 2014
FIFA World Cup in different regions of the world according to political terms.
The impact of this event on public reactions was then interpreted based on the
dynamics of terminology.
Understanding this influence and the lack of research aiming to reveal the
relationship between social event and political campaign were the main motivation
5
The demand for such studies is going to increase, provided that timely conclusions
on campaigning results are made, showing the ability of GIS to influence
decision-making, which unquestionably demonstrated their effectiveness.
1.4.
Research questions
The initial step in defining non-political events is to consider them within the field of
all possible non-political events and to determine into which category they fall
(e.g. commercial, cultural, and corporate). Therefore, the key issue to be addressed
is the identification of criteria by which events are defined. In other words, the first
question in our research is: "What differentiates non-political events from political
events?"
Politics affecting the host country naturally play a vital role in the organization of the
World Cup. Since the staging of the event usually requires large-scale construction
projects of sporting facilities, infrastructure projects such as road, accommodation
facilities, stadiums, and renovation of the host city buildings. Based on this
information the second questions we can ask is: “How is a non-political event
politicized when it is carried out?”
The last interesting part deals with huge and time-sensitive text contents and the
analysis of trends across space. The real-time social content can be seen as a sensor
that shows what is happening in the world. The general rule is that a topic can be
analyzed only with in a specific time frame – in our case it is the duration of the main
stage of the World Cup. It is important how a specific content about event behaves
over time in politics. As a consequence, the last questions is: “In which locations
were political topics discussed?”
1.5.
Hypotheses
It is hypothesized that non-political events become politicized through social media.
The second hypotheses is that social media data has certain statistical and spatial
characteristics, which provide the researcher clues about public opinion in a given
6
1.6.
Methodology
The main steps of research were developed relying heavily on related studies,
including the definition of political vs. non-political events, extraction of
user-generated content, data processing, spatial and statistical analysis, and finally
sentiment analysis.
Figure 1. Thesis Workflow
First step contains analysis of term “non-political event” by the review of official
definitions of political events in different regions.
The second step is extraction and formalization of the user-generated content
expressed by the social posts - tweets using Twitter Streaming API. English, German,
Portuguese, Spanish, Russian were chosen as the research languages.
The next step is data processing with special statistical software to select a limited
set of relevant terms that exist in the considered time interval and particular location
7
Statistical analysis has to be done to determine the common topics, as vectors of
political and event terms with their relative frequencies with information about time
and location using during non-political event in different regions. Spatial analysis
needs to evaluate where content related with event and politic, bring about reaction
from society. Sentiment analysis determines the behavior of the politically oriented
tweets. It is a field of natural language processing which focuses on extraction of
objective and subjective information from a natural language sentence.
Chen C.C. et al proposed a metaphor where each term is seen as a living organism;
in contrast to the approach proposed in, analyze the terms life cycles by
distinguishing among different time intervals in order to highlight when a term
becomes important in the community (2003). The analysis process showed on
Figure 1 starts with the real-time extraction of the relevant keywords from the
Twitter stream. The importance of the source, from which political topics were
analyzed, is basically counting knowledge where the contents constitute the entire
semantics for extraction political facts. Different classification strategies and
data-mining techniques cannot be applied in our research because they usually ignore the
temporal and spatial relationships of tweets related to a political event situation
(Shaheen M. et al, 2013).
The first step for the selection of political terms depends on a user-specified parameter. The original assumption is based on the idea that two keywords with
very high frequency values can be measured as political or not depending on the
user evaluation. The second step takes into account the idea that an automatic
model does not involve any user interaction. The dependence on the temporal
context could be necessary to set other the threshold value.
One of the last steps, evaluate the impact of techniques in the retrieved topics by
analyzing the real-time information. The main stage is analyzing the influence of
events on politics, the reaction from society and how it changed trends in political
topics. The results of the study could be helpful for policy makers and for
government by contributing to decision-making and to visualize who is using political
8
1.7.
Thesis Organization
The thesis is organized according to the following methodology. In the first chapter,
an overview of literature on social network analysis in geographical contexts, as well
as GIS applications in politics, is presented. In the second chapter, data description,
preparation, and limitations of this study are described. The third chapter is
dedicated to the analysis of geotagged social data: data processing, spacial and
geo-social analysis. This includes the statistical analyses of the most referenced political
terms and insights about common ways political topics are used during non-political
events in different regions. The fourth chapter highlights conclusions and future
work expectations. There are three annexes which contain an example of a code
9
2. RESEARCH DATA DESCRIPTION AND ORGANIZATION
2.1.
Data description
The study area of the thesis comprises the main stage of the 20th FIFA World Cup,
which took place in different cities across Brazil. When the decision to carry out this
tournament was announced in 2003, the reactions immediately followed.
According to Barreto, the 2014 World Cup was marked by fears that the stadiums
and infrastructure would not be ready in time, street protests against government
expenditures to finance the event sprang up. The elections and federal budget were
topics that dominated in the news through all pre-selection period (2012).
The group stage of the 2014 FIFA World Cup took place in Brazil from 12 June 2014
to 26 June 2014: each team from 32 countries played three games. Worldwide,
several games have qualified as the most-watched sporting events in their country in
2014, including 42.9 million people in Brazil for the opening game between Brazil
and Croatia and the 34.1 million in Japan who saw their team play against Ivory
Coast (Godfrey, 2014).
The two official hashtags of the World Cup - #WorldCup and #Brasil2014 – were
announced. This event broke records on Facebook and Twitter in terms of the
amount of posts. For example, the game between Brazil and Chile generated 16.4
million tweets in two hours. The tournament also racked up an unprecedented 1
billion Facebook interactions by 29 June, with two weeks left to the final (Billings et
al, 2014).
We aimed to detect real-world events on a global scale, in a given monitored
geographic area and to conduct the experiments described in this paper with
German, English, Spanish, Russian and Portuguese tweets connected with political
topics from the countries all around the world. English and Spanish languages were
chosen because of their popularity in Twitter. Portuguese language was selected
10
German team won the tournament. Russian was chosen because the 2018 FIFA
World Cup will take place in Russia.
For all these purposes the different data sets were used. The collection of
information about the 2014 FIFA World Cup began with the World Cup JSON project.
JSON is a JavaScript Object Notation, in other words, it is a syntax for storing and
exchanging data (Hope, 2014). World Cup in JSON is an API that gets match results
for the World Cup and retrieves information on the particular soccer matches,
matches for a given country, results for teams, and a list of all teams participating in
the World Cup, and data for all football matches. The first database RESULTS,
includes information about all matches held during this sport event. Table 1 shows
an example of the final database structure with the following fields: match number,
location (name of the stadium), date and time information, name of the country for
the home team and for the away team, goals of both teams and the winner name
with code.
№ Location Match time HT country HT code HT goals AT country AT code AT
goals Winner
Winner code
1 Arena de Sao Paulo
6/12/2014
20:00 Brazil BRA 3 Croatia CRO 1 Brazil BRA
2 Estadio das Dunas
6/13/2014
16:00 Mexico MEX 1
Camero
on CMR 0 Mexico MEX
Table 1. An example of data in the results database.
Another important step was the real-time extraction of the data from the stream of
social network - Twitter. Twitter Streaming API provided opportunity to continuously
listen to a stream of tweets (Chinthala S. et al, 2015).
A R Script was written to collect tweets through Twitter Search API. The data were
collected between June 6th and July 14th and stored in the file DATA.csv.
It includes 82 341 764 tweets. The selection was based on the official World Cup
hashtags (#WorldCup and #Brasil2014). The structure of the main database
represents following information about each tweet: unique ID number, creation
date, text data of the tweet, user nickname, and special mark about retweet, and
11
2.2.
Data limitations
Free, geographic and semantically rich datasets derived from the harvesting of social
media sites en masse should continue to be of great and growing interest to all
spatial analysts (Goodchild, 2007). Data quality remains a serious concern for all such
research. The sheer diversity and sporadic nature of the data poses new challenges
to researchers accustomed to relatively clean official datasets.
Several limitations stem from the data itself, including the limited amount of
geotagged data and the high proportion of retweets which lack geographic data.
Furthermore, there is uncertainty associated with the social behavior of users who
did not put hashtags on their messages and it must be noted that only a small
portion of World Cup spectators are Twitter users. Therefore, it is difficult to make
generalizations or model future behavior based on the experimental data from this
study.
When Twitter applications access GPS devices and/or cellular location info, their
coordinates are broadcast as metadata attached to every tweet. These data are
generated automatically, and we can be fairly confident in their accuracy. But
according to Leetaru et al., only about 1.6 percent of users have this functionality
turned on (2012). This presents a huge gap in the potential data to be analyzed. Due
to privacy concerns, Twitter offers it on an opt-in basis, which partly explains the low
level of uptake.
The broader problem of wide semantic diversity can be partially tackled by
intelligent filtering, using search terms that capture only messages that can be
confidently attributed to the topic of interest. Nevertheless, there will inevitably still
be variations in quality and issues of self-selection even after the most stringent
filtering strategies. One way of tackling this issue would be to assign a continuous
weight variable to every tweet corresponding to its relevance to the research
problem, although the method of assigning high and low weights would add further
complexity and subjectivity to the analysis. This point is related to a more
fundamental problem with social media data: the context-dependence. Tweets sent
12
decode them, taken out of context, data lose meaning and value. In the process of
harvesting and subsequent sampling much of this context is lost: currently there is
no way to consider the wider context, implicit in each tweet, over thousands and
indeed millions of such data points.
2.3.
Data preparation
The analysis process started with the preparation of data. To obtain clear data for
geo-social analysis we needed to filter and sort the tweets in the database by some
criteria.
The first step of preparation was the omission of the retweets. Retweet has
abbreviation RT. It is used on the Twitter Web site, to show that users are tweeting
content that has been posted by another user. The main reason was that while the
original Tweet may have a location, the native Retweet does not. For example, if a
tweet originates in Rio de Janeiro, and somebody given retweets in Lisbon, the
retweet’s location will remain to Rio. The filtering was done using R scripting by excluding the Tweets starting or comprising known abbreviation “RT”. After filtering
the database includes 37 325 116 rows ready for the next filtration and analyses.
According to Graham, geolocation is used by different web services and applications,
which is very useful for representing a tweet’s position on a world map.
Unfortunately, only a small fraction of all the tweets are geotagged (2014). Users
often tweet from their phones without turning on the geolocation function. The
geographic features were showed by information about geo location of tweets, the
latitude, the angular distance of the place relative to the earth’s equator and the
longitude is the angular distance of the place relative to the Greenwich meridian.
In our case only about 2% of tweets were geotagged to location, but the absolute
number was still huge. After filtering tweets by non-null values in the latitude and
longitude fields, we were left with 746 502 rows in the database.
The next important step in preparation was Language Detection. It was done by Text
Analysis API, which uses the Language Detection endpoint to find out what human
13
processed one more time. Figure 2 shows the relative amount of German, English,
Spanish, Russian and Portuguese tweets in the database proportionally.
Figure 2. Language groups proportionally represented.
All tweets were grouped by language and count. The size of the circle shows percent
of Total Count of Tweets in a particular language. The view is filtered by Language
group, which keeps German, English, Spanish, Russian and Portuguese. These
14
3. ANALYZING GEOTAGGED SOCIAL DATA
3.1.
Analysis of term “non
-
political event”
Defining the difference between a political and non-political event is the first step of
the research. According to (Westermann & Jain, 2007) an event model that aims at
establishing a common foundation for a wide diversity of applications, event-centric
multimedia, reusable event management infrastructure and tools, and application
integration should address several elementary aspects of the event description.
Figure 3. Basic aspects of event description (Westermann, 2007).
A "non-political" event can be viewed in two main respects: its internal
characteristics (i.e. number of participants and spectators, number of sessions) and
its external characteristics. Based on Figure 3 we characterized the 2014 FIFA World
15
Temporal aspect of the 2014 FIFA World Cup inherently related to the concept of
time. In this research we will take in consideration the main stage of the
tournament, which took place between from 12 June to 13 July 2014.
The spatial aspect of the 2014 FIFA World Cup is our main subject of research. Brazil
hosted the tournament during all stages in 2014. Twelve venues (seven new and five
renovated stadiums) in twelve cities were selected for the tournament.
The informational aspect of the 2014 FIFA World Cup provides information about the
individual matches that took place. In our case, information contains data about 64
small “events” that took place during the tournament, including information about
teams, players, goals, coaches, stadiums, and so on.
The experiential aspect of the 2014 FIFA World Cup offers users engaging ways of
exploring and experiencing a course of events to let them gain insight into how the
events evolved. Usually there are different sources, ranging from streaming servers,
file and content management systems, to multimedia databases. Our event will be
explored through the social network Twitter.
The structural aspect of the 2014 FIFA World Cup aggregates low-level events such
as person- and object- events to intermediate events such as shots, fouls, and goals.
The causal aspect of the 2014 FIFA World Cup offers a theory about how individual
matches that make up the event may cause political sentiments to appear in certain
geographic locations.
In 2012, Schrodt stated that a political event is anything that is initiated and
organized by a political organization or political candidate exclusively to advance and
promote political purposes or political candidate.
The 2014 FIFA World Cup is the biggest single-event sporting competition in the
world, organized by the official sport organization FIFA (La Fédération Internationale
de Football Association) and it has significant impacts on society and the
16
3.2.
Extracting information from tweets
After filtering data we were left with 627 061 Tweets. The five languages that were
chosen for analysis include German, English, Spanish, Russian and Portuguese. To do
an analysis we needed to extract certain keywords for each category
(political/non-political/mixed) in its native language from tweets. Figure 4 shows the predominant
term used to describe football on different continents.
Figure 4. Data analysis explores how people around the world refer to “soccer” on Facebook.
Keywords were chosen by clustering - an unsupervised data mining technique. The
goal of clustering is to capture natural groupings of words between different tweets
represented in the data. It defines a "closeness" metric for comparing two objects
and groups all objects with a similar closeness. There are two classes of clustering
methods: top-down or bottom-up. In a top-down method, the user decides how
many clusters the data would form. The popular k-means clustering algorithm is an
example of it. In a bottom-up method, users define a distance metric. Hierarchical
clustering falls into this bottom-up approach. The data mining technique such as
clustering helps only if it will provide some unique ideas in the behaviour of tweets
(Joshi, 2014).
For this study, RapidMiner software was chosen as a tool for data mining. It is
a software platform developed by the company of the same name that provides an
17
analytics and business analytics (Hofmann, 2013). RapidMiner versions of the
software are available under an OSI-certified open source license. Based on Bloor
Research, RapidMiner is written in the Java programming language. Alternatively,
the engine can be called from other programs or used as an API. RapidMiner
provides learning models and algorithms from Weka and R scripts that can be used
through extensions.
The main goal of the analysis using RapidMiner was to quantify words found in
tweets during the 2014 FIFA World Cup and to rank those words using clustering
tools such as k-means, a commonly used clustering algorithm. The purpose of these
algorithms is to divide n data points into k clusters where the distance between each data point and its cluster’s center is minimized (Godfrey, 2014). Initially k-means chooses k random points from the data space, not necessarily points in the data, and
assigns them as centroids. Then, each data point is assigned to the closest centroid
to create k clusters. After this first step, the centroids are reassigned to minimize the
distance between them and all the points in their cluster. Each data point is
reassigned to the closest centroid. This process continues until convergence is
reached.
First, the clustering technique was applied to the input from Tweeter streaming API,
which consists of the original number of tweets. Only English tweets were
considered due to the limited scope of this study and because English was the
predominant language of the dataset. These tweets amounted to 480,000, or about
64% of the total number of the filtered dataset. Another filter was used to remove
words words which occurred less than 5 times in tweets. Finally this cleaned output
was fed into a k-means clustering operator. The plot of the word cloud was
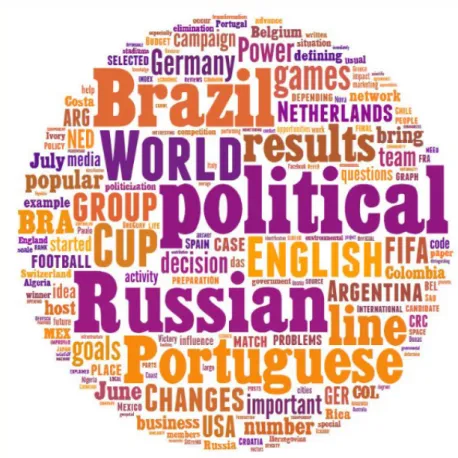
performed by R-scripting in Tableau. The clustering outputs shows the top keywords
on Figure 5.
The word clouds tool was used as a visualization method for text and provided an
overview by distilling text down to those keywords that appear with the highest
frequency (12 words in total were chosen). It provides us a useful idea about our
18
Figure 5. The result of applying k-means for the database visuliased in Tableau.
I took the most frequently tweeted words and divided them into three categories of
four words each: political, non-political (purely football), and mixed.
The set of words in five different languages were chosen for the analysis of tweets.
Table 2 contains four words are associated with football. Henceforth, the football
topic will have a blue colors in all our graphs.
English Soccer Championship Goal Game
Spanish Fútbol Campeonato Gol Juego
Portuguese Futeball Mundial Goal Jogo
German Fußball Meisterschaft Ziel Spiel
Russian Футбол Чемпионат Гол Игра
Table 2. Set of keywords showing strong connection with topics about football.
Table 3 contains four words connected with football and political topics. This words
19
English Defeat Victory Profit Budget
Spanish Derrota Victoria Lucro Presupuesto
Portuguese Derrota Vitoria Lucro Orçamento
German Niederlage Sieg Gewinn Haushalt
Russian Поражение Победа Прибыль Бюджет
Table 3. Set of keywords showing strong connection with topics about football and politics.
Table 4 contains four words connected with political topics. These words are more
interesting for the purpose of our analysis and will represent by bright orange color.
English Elections Policy Power Changes
Spanish Elecciones Política Energía Cambios
Portuguese Eleições Política Poder Mudanças
German Wahlen Politik Leistung Änderungen
Russian Выборы Политика Власть Изменения
Table 4. Set of keywords showing strong connection with topics about politics.
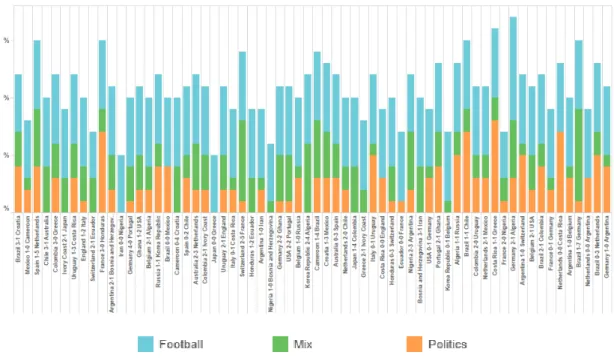
After filtering tweets by sets of words containing political and football meanings, in
Figure 6, we can see that political topics appeared during 80% of all games.
20
The Figure 6 allows us to visualize the percentage break down of topics by game,
from the first to the 64th match. As we can see from the chart, political keywords
were absent from tweets during 20 % of the games.
Only in 3% games users spoke about football topic and did not mention words from
second and third data set. Teams from Japan, Australia, Nigeria, and Bosnia and
Herzegovina passed games without politic discussions. Contemporaneously Brazil,
Netherlands and USA showed the opposite tendency
The next Figure 7 shows the percentage of political, football and the mix of both
topics by language group. The political topics were very popular in Portuguese,
English and Spanish tweets, more than 53%, 46% and 33% respectively.
a) b) c)
d) e) f)
Figure 7. Different data sets of keywords represent in different language groups: a) English, b) Spanish, c) Portuguese, d) German, e) Russian, f) Total amount of geotagged tweets.
In German language users mentioned about politics in less than 20% tweets. In
russian tweets people almost don’t used politic keywords, only about 7% tweets
contans them. However Russian tweets includes more than 53% of words from the
second dataset.
German and Spanish languages showed mix of topic in 25% cases each, while the
English tweets has only about 13% of mix keywords, which is still a lot comparing to
21
tweets relay to football tematic, the same as in other languages. The first dataset
was the most popular in German tweets.
In total our database represent 43% pure football topics, 36% of mix keywords and
21.5% of strong politic connections. The database were filtered by these set of words
with politic keywords. As the result around 160 500 tweets of all geotagged tweets in
our database, which means more than 21.5% of all tweets where people used
keywords from the last set.
It includes 103,125 tweets in English, 38,804 tweets in Spanish, 11,802 Tweets in
Portuguese, 4,207 Tweets in German and 2,560 Tweets in Russian.
The Figure 8 shows the proportion of tweets in final database count by language
group. As we can see people tweet about politics in English language in more than
64% cases, about 25% of tweets were in Spanish language. Portuguese Tweets total
about 7%, while the Brazil hosted this tournament.
Tweets in German and Russian languages represents only about 4% of all tweets in
database, but still interesting for us to follow politic trends in this languages.
The team from Germany won The FIFA World Cup 2014. And Russian Federation will
host the next tournament - The FIFA World Cup 2018.
Figure 8. The proportion of total Tweets in language groups
64.25%
24.18%
7.35%
2.62%
22
3.3.
Exploratory analysis
In order to answer the research question: "How is a non-political event politicized
when it is carried out?” an exploratory statistical analysis was done.
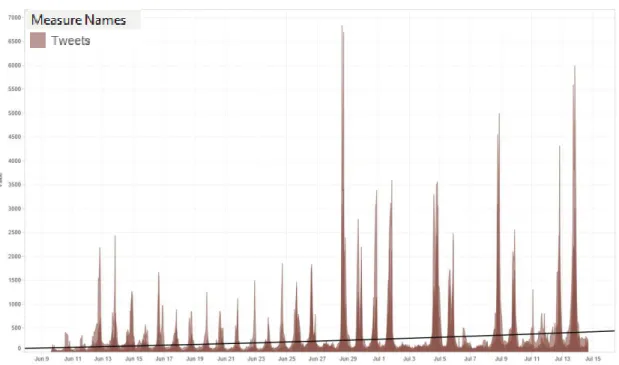
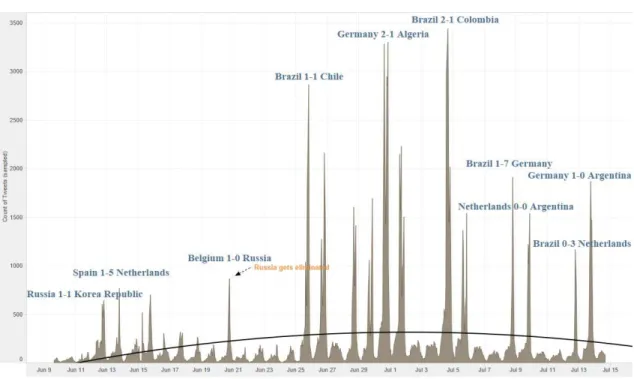
Tweets connecting with politic topics
Figure 9. Plot showing the amount of Tweets contains political keywords per day
In Figure 9 one can see the plots of English, Spanish, Portuguese, German and
Russian Tweets per Hour. Tweets Hour ranges from June 9, 2014 3 PM to July 14,
2014 4 PM on this plot.
The Trend Lines Model was built as a polynomial trend model. It were computed for
count of Tweets given by event timeline. A polynomial trendline is a curved line that
is used when data fluctuates. It is useful for analyzing gains and losses over a large
data set. The order of the polynomial can be determined by the number of
fluctuations in the data or by how many bends (hills and valleys) appear in the curve.
For evaluation the goodness of fit of this trend line we calculate the following
statistics for our model:
Sum of Squares for Error (SSE) were calculated to find the least squares line equation
23
to the response values. A value closer to 0 indicates that the model has a smaller
random error component, and that the fit will be more useful for prediction.
R-square is the square of the correlation between the response values and the
predicted response values and measures how successful the fit is in explaining the
variation of the data. R-square can take on any value between 0 and 1, a value closer
to 1 indicating that a greater proportion of variance is accounted for by the model.
Mean squared error is an estimate of the standard deviation of the random
component in the data and also its value closer to 0 indicates that the model has
a smaller error and that the fit is more useful for prediction.
The standard deviation gives an idea of how close the entire set of data is to the
average value. Data sets with a small standard deviation have tightly grouped,
precise data. Data sets with large standard deviations have data spread out over
a wide range of values.
In statistics, the p-value is a function of the observed sample results (a statistic) that
is used for testing a statistical hypothesis. The model may be significant at p <= 0.05.
SSE (Sum of Squares for Error): 8.7873e+008
MSE (mean squared error): 213180
R-Squared: 0.0413362
Standard error: 461.715
p-value (significance): < 0.0001
Table 5. Statistical analysis on a set of Tweets.
According to our calculations in Table 5 and the plot in Figure 9, the trend in our data
was found. The line of political topics trend is increasing significantly.
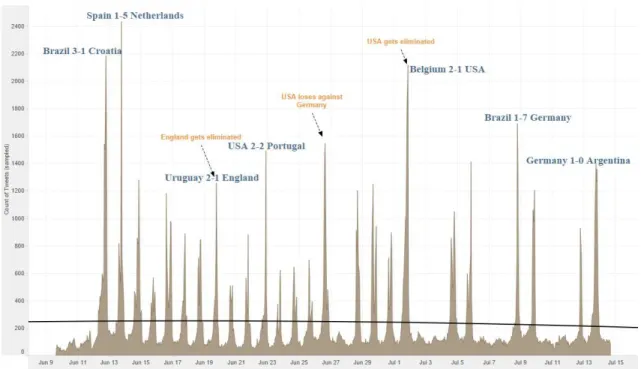
In Figure 10 the plot represents the number of English Tweets from June 9, 2014
3 PM to July 14, 2014 4 PM. The x-axis shows the timeline of the event, the y-axis is
the Count of Tweets. Count of Tweets ranges from 10 to 2,445 on this graph. The
filter associated with English tweets keeps all values.
The Trend Lines Model was built as a polynomial trend model. It were computed for
24 Tweets connected with political topics in English language
Figure 10. Plot showing the amount of Tweets contains political keywords per day (in English language).
For evaluation the goodness of fit of this trend line we calculate the following
statistics for our model:
SSE (Sum of Squares for Error): 7.56349e+007
MSE (mean squared error): 91126.4
R-Squared: 0.0017212
Standard error: 301.872
p-value (significance): 0.489234
Table 6. Statistical analysis on a set of English Tweets.
According to our calculations in Table 6, any particular trend in our data was not
found. However, using the 64 match results as attributes for this sheet can give us an
idea of political topics. The marks are labeled by the important activity of the event.
First time the politic topic in English tweets appeared during the opening games of
Brazil vs. Croatia and Spain vs. Netherlands. It can be explained by the mass media
companies about the political problems in preparation these tournament and also
because of the demonstrations which were carried out during the first days of the
event. The next political discussions in English language appeared after England and
25
their wish to make changes. The word “power” was mentioned more times on this
stage. The final games of Brazil vs. Germany and Germany vs. Argentina in English
tweets have a more sporty character, but still include a lot of tweets about elections
and budget questions. A large amount of Tweets contains the word “changes”.
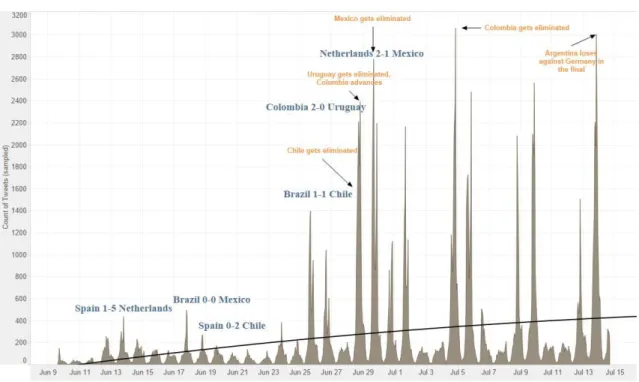
The next plot on Figure 11 shows the number of Spanish Tweets from June 9, 2014
3 PM to July 14, 2014 4 PM. The X-axis represents the timeline of the event and on
the Y-axis we can see the Count of Tweets. Count of Tweets ranges from 1 to 3,060
on this graph. The filter associated with Spanish tweets keeps all values.
Tweets connecting with politic topics in Spanish language
Figure 11. Plot showing the amount of Tweets contains political keywords per day (in Spanish language).
The Trend Lines Model were built as a polynomial trend model. It were computed for
count of Tweets given by event timeline. For evaluation the goodness of fit of this
trend line the following statistics were calculated for our model in Table 7.
SSE (sum squared error): 1.48929e+008
MSE (mean squared error): 179866
R-Squared: 0.0868349
Standard error: 424.106
p-value (significance): < 0.0001
26
The line of political topics trend is increasing significantly. After using the 64 match
results as attributes for this sheet we can have an idea of politic topics. The marks
are labeled by the most important games. The event in Spanish tweets started
almost without politics keywords in main topics. During the time with the
elimination of main Spanish speaking teams, the political topics were started to be
popular in Spanish twitter. Each day with game brought more and more discussions
about changes and policy.
This behavior in Tweets once again showed us that during the unsuccessful games
people starts speak about politics more and that event start to be politicized during
time.
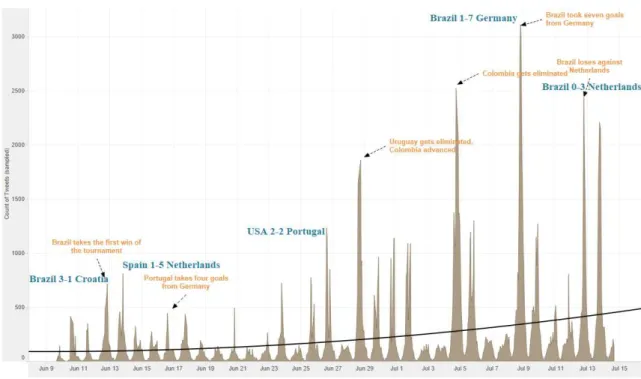
Tweets connecting with politic topics in Portuguese language
Figure 12. Plot showing the amount of Tweets contains political keywords per day (in Portuguese language).
The third plot in Figure 12 shows the count of Portuguese Tweets from June 9, 2014
3 PM to July 14, 2014 4 PM. The x-axis represents the timeline of the event and on
the y-axis we can see the count of tweets, which ranges from 1 to 4,985 on this
graph. The filter associated with Portuguese tweets keeps all values.
The Trend Lines Model was built as a polynomial trend model. It was computed for
count of Tweets given by event timeline. To evaluate the goodness of fit of this trend
27
SSE (sum squared error): 1.00933e+008
MSE (mean squared error): 123090
R-Squared: 0.0859428
Standard error: 350.841
p-value (significance): < 0.0001
Table 8. Statistical analysis on a set of Portuguese Tweets.
The political topic trend line is noticeably increasing, while the range of the tweets is
almost twice more than in the other languages. Politics is the main topic during
almost all of the games. The use of the 64 match results as attributes for this sheet
give us an idea about political topics. The marks are labeled by the most important
activity during the event.
Politics was the popular topic in Portuguese tweets from the first till the last day of
the event. In Portuguese tweets we could see trend of strong division on two topics
football and politics. The main keywords from our data set appeared in tweets even
before first game, and confirm the political problems in Brazil.
The amount of tweets increased with each game, and brought about the biggest
reaction during the famous game of Brazil against Germany, where the host team
lost 1-7. It was a huge disappointment for fans, at the same moment the words “Changes” and “Elections” were almost in each second tweet. During the last game of Brazil in semi-final and the final game between Argentina and Germany, users
tweeted more about “Policy”.
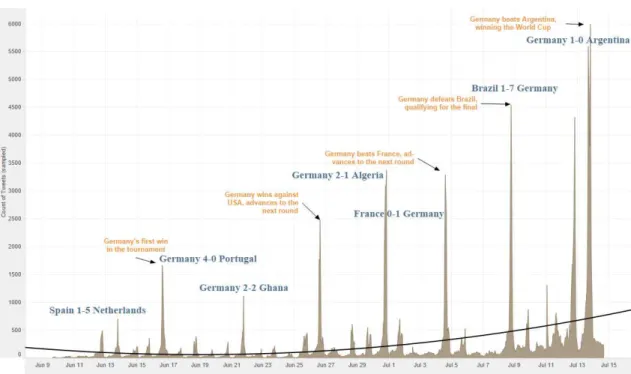
One more plot on Figure 13 shows the counting of German Tweets from June 9, 2014
3 PM to July 14, 2014 4 PM. The x-axis represents the timeline of the event and on
the axis Y we can see the Count of Tweets. Count of Tweets ranges from 1 to 5,984
on this graph. The filter associated with German tweets keeps all values.
The Trend Lines Model was built as a polynomial trend model. It was computed for
count of Tweets given by event timeline. To evaluate the goodness of fit of this trend
28 Tweets connected with political topics in German language
Figure 13. Plot showing the amount of Tweets contains political keywords per day (in German language).
SSE (sum squared error): 2.48712e+008
MSE (mean squared error): 299653
R-Squared: 0.120215
Standard error: 547.405
p-value (significance): < 0.0001
Table 9. Statistical analysis on a set of German Tweets.
The trend line of political topics increased in our plot. Political topics were not so
popular in German tweets, while the most used word was “Power”. The results of 64
match were added to the plot and it gave us an idea of using politic topics. The
marks are labeled by the most important activity during the event.
The political topics were discussed in German tweets during the main German
games. The deep analyses showed that the discussion of politics were accompanied
29
The last plot on Figure 14 shows the counting of Russian Tweets from June 9, 2014
3 PM to July 14, 2014 4 PM. The axis X represents the timeline of the event and on
the axis Y we can see the Count of Tweets. Count of Tweets ranges from 1 to 3,400
on this graph. The filter associated with Russian tweets keeps all values.
Tweets connecting with politic topics in Russian language
Figure 14. Plot showing the amount of Tweets contains political keywords per day (in Russian language).
The Trend Lines Model was built as a polynomial trend model. It was computed for
count of Tweets given by event timeline. For evaluation the goodness of fit of this
trend line we calculated the following statistics for our model in Table 10.
SSE (sum squared error): 1.49536e+008
MSE (mean squared error): 182807
R-Squared: 0.0486674
Standard error: 427.559
p-value (significance): < 0.0001
Table 10. Statistical analysis on a set of Russian Tweets.
The line of political topics trend is increasing in the middle of our plot. The political
30
results of 64 matches were added to the plot and it gave us an idea of when political
topics were discussed. The peak activities are labeled by importance.
The political topics in Russian tweets are very interesting to analyze, because Russia
will host the next World Cup. We can see that football was the main topic discussed
in Russian tweets until the elimination of the Russian team.
During the tournament, political topics appeared during the games lost by the
Russian team. The words “changes” and “policy” came up very often.
Right after the elimination of the Russian team, the set of words which are mixed
between politics and football started to become more popular in tweets.
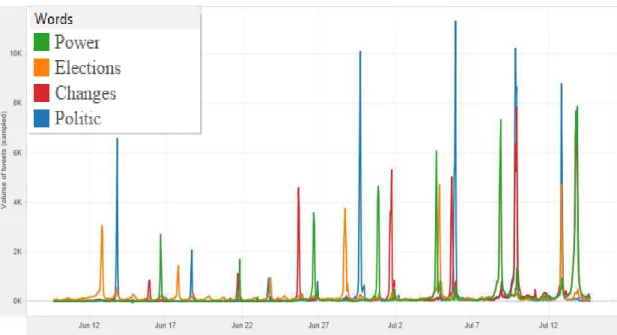
The next step in the research was the analyses of trends in the tweets with particular
words. The graphs represented the frequency of political terms, chosen for our
purpose: “Power”, “Elections”, “Changes” and “Politic”. The tweets were written between June 9, 2014 4 PM to July 14, 2014 5 PM. The filter keeps non-null values.
Tweets connecting with politic topics filtered by words
Figure 15. Plot showing the amount of Tweets contains political keywords chosen for analysis
31
“Changes” increased every game, and in the final stage were mentioned in a lot of tweets.
The graph for the first word from our dataset - “Power”– is presented in Figure 16.
Tweets connecting with politic topics filtered by word “Power”
Figure 16. Plot showing the amount of Tweets, which include keyword “Power” from the third data set.
The Trend Lines Model was built as a polynomial trend model. It was computed for
number of Tweets given by event timeline. For evaluation the goodness of fit of this
trend line, the following statistics were calculated for our model in table 11.
SSE (sum squared error): 5.22563e+008
MSE (mean squared error): 745454
R-Squared: 0.0648028
Standard error: 863.397
p-value (significance): < 0.0001
Table 11. Statistical analysis on a set of Tweets containing keyword “Power”.
According to our calculation, use of the word “Power” significantly increased over
time. It appears after the first week of the tournament (the word was mentioned in
800 tweets) and was used most (more than 9600 tweets), during the game Brazil vs.
Germany. This word was used more frequently in the contexts of the word “Victory”
32
The graph for the second word from our dataset - “Changes” - presented in Figure 17
also shows a strong tendency to increase to almost 8000 references in Twitter at the
end.
Tweets connected with political topics filtered by word “Changes”
Figure 17. Plot showing the amount of Tweets, which include keyword “Changes”
from the third dataset.
The Trend Lines Model was built as a polynomial trend model. It was computed for
count of Tweets given by event timeline. For evaluation the goodness of fit of this
trend line the following statistics were calculated for our model in Table 12.
SSE (sum squared error): 4.31872e+008
MSE (mean squared error): 650409
R-Squared: 0.0736214
Standard error: 806.48
p-value (significance): < 0.0001
Table 12. Statistical analysis on a set of Tweets with keyword “Changes”.
According Figure 18, the word “Elections” was used in tweets at the beginning 3000 times and at the end it reached the absolute number of 4500 tweets.
The graph for the third word from our dataset - “Elections” - is presented in Figure
18. The Trend Lines Model was built as a polynomial trend model. It was computed
for the number of Tweets given by event timeline. For evaluation the goodness of fit
33
SSE (sum squared error): 1.0206e+008
MSE (mean squared error): 129682
R-Squared: 0.016778
Standard error: 360.115
p-value (significance): 0.0012835
Table 13. Statistical analysis on a set of Tweets containing keyword “Elections”.
Tweets connected with political topics filtered by word “Elections”
Figure 18. Plot showing the amount of Tweets, which include keyword “Elections”
from the third data set.
Tweets connected with political topics filtered by keyword “Politics”
Figure 19. Plot showing the amount of Tweets, which include keyword “Politics”
34
The graph for the last word from our dataset - “Politics” – is presented in Figure 19.
The Trend Lines Model was built as a polynomial trend model. It was computed for
the number of Tweets given by the event timeline. For evaluation of the goodness of
fit of this trend line, the following statistics were calculated for model in Table 14.
SSE (sum squared error): 7.23969e+008
MSE (mean squared error): 902705
R-Squared: 0.0268978
Standard error: 950.108
p-value (significance): < 0.0001
Table 14. Statistical analysis on a set of Tweets with keyword “Politic”.
According to the plot 19, the word “Politics” was tweeted 7,000 times in the middle
of the tournament, and in the last stage it appeared in 10,000 tweets in every game.
After computation of the most used words and phrases in each language during the
different stages of tournament, Table 15 was created.
The changes in popular words were showed in the summarize Table 14. Almost all
groups of languages showed the same behavior of politicization during the “non -political” event.
Language Stage 1 Stage 2 Stage 3
English Political games / Profit Power Political changes
Spanish Goal Victory Changes
Portuguese Budget Elections Changes
German Goal Victory Power / Policy
Russian Game Changes Budget / Victory
35
3.4.
Spatial analyses
Spatial analysis was done for the purpose of answering the last research question:
“In which locations were political topics discussed?” Proportional circle maps were used for this analyses. This type of map shows data that is represented by circles of
varying sizes. The larger circles represent larger numbers while the smaller ones
obviously represent smaller numbers. These types of maps can be considered as
more simplified dot distribution maps. Dot distribution maps are a type of statistical
map that show where particular data characteristics occur. They are very useful for
visualizing density of the topic being studied. The first map based on longitude and
latitude was extracted from each geotagged tweet represented in Figure 20. The size
of one dot shows one tweet created at a particular time.
Tweets distribution during the 2014 FIFA World Cup
Figure 20. Dot distribution map of tweets during the 2014 FIFA World Cup.
The locations of users spans the entire world, but according to dot density map,
36
tweets were sent from more developed territories. A significant amount of users
from Asia also participated in discussion about the 2014 FIFA World Cup.
The second map in Figure 21 is based on longitude (generated) and latitude
(generated) of all tweets in one particular country. Size shows count of tweets.
Details are shown for Country and Language. The view is filtered on Language, which
keeps German, English, Spanish, Portuguese and Russian tweets. Percents are based
on each column of each pane of the table.
Tweet locations during The 2014 FIFA World Cup
Figure 21. Proportional Circle Map of tweet locations during The 2014 FIFA World Cup.
Generally selected tweets in 5 languages were situated in USA, Great Britain, Brazil
and Spanish speaking countries in South America. Spatial analyses of tweet
distribution from particular language groups were done. To show this density of
tweets, Proportional Circle Map maps were created.
The first map in Figure 22 is based on longitude and latitude of tweets broken down
by language group. Size shows count of Tweets from 1 to 97 686. Details are shown
37 Location of tweets (in English language) during The 2014 FIFA World Cup
Figure 22. Proportional Circle Map of English tweets location.
According to this map, most of the posts in English language were tweeted from USA
and Great Britain. It can be explain by the fact that English is the main language in
both countries.
The English language was very popular for tweets in Canada, Brazil, South Africa,
India, Malaysia and Indonesia, where English is also used as one of the main
languages. Some of European countries tweeted in English language too. For
example, Germany, Spain, France and Italy.
The next map in Figure 23 based on longitude and latitude of tweets broken down by
language group. Size shows count of Tweets from 1 to 36 182. Details are shown for
each country. The view is filtered based on Spanish Language.
According to this map, most of the posts in Spanish language were tweeted from
South America countries, such as Columbia, Argentina, Chile and Mexico.
The Spanish language was very popular for tweets in Brazil, USA, and Spain. The
38 Location of tweets in Spanish language during The 2014 FIFA World Cup
Figure 23. Proportional Circle Map of Spanish tweets location.
The third map in Figure 24 is based on longitude and latitude of tweets broken down
by language group. Size shows count of Tweets from 1 to 10757. Details are shown
for each country. The view is filtered by Portuguese language.
As we can see on the map, most of the Portuguese tweets were sent from Brazil, and
only a small percentage from Portugal. It can be explained by fact that Portuguese
language is the official language of these two countries. The Portuguese tweets were
not presented in other parts of the world.
The fourth map in Figure 25 is based on longitude and latitude of tweets broken
down by language group. Size shows count of Tweets from 1 to 3 933. Details are
shown for each country. The view is filtered by German Language.
According to this map, most of the posts in German language were tweeted in
Germany. The English language was very popular for tweets in USA and Spain. The
Spanish tweets were presented also in USA, Brazil, Indonesia and all around Europe,
39 Location of tweets in Portuguese language during The 2014 FIFA World Cup
Figure 24. Proportional Circle Map of Portuguese tweets location.
Location of tweets in German language during The 2014 FIFA World Cup