Genetic differences between Chibcha and Non-Chibcha speaking tribes
based on mitochondrial DNA (mtDNA) haplogroups from 21 Amerindian tribes
from Colombia
Solangy Usme-Romero
1, Milena Alonso
1, Helena Hernandez-Cuervo
1, Emilio J. Yunis
2and Juan J. Yunis
1,2,3 1Grupo de Identificación Humana e Inmunogenética, Facultad de Medicina,
Universidad Nacional de Colombia, Bogotá, D.C., Colombia.
2
Instituto de Genética, Servicios Médicos Yunis Turbay y Cia., Bogotá, D.C., Colombia.
3
Departamento de Patología, Facultad de Medicina e Instituto de Genética,
Universidad Nacional de Colombia, Bogotá, D.C., Colombia.
Abstract
We analyzed the frequency of four mitochondrial DNA haplogroups in 424 individuals from 21 Colombian Amerindian tribes. Our results showed a high degree of mtDNA diversity and genetic heterogeneity. Frequencies of mtDNA haplogroups A and C were high in the majority of populations studied. The distribution of these four mtDNA haplogroups from Amerindian populations was different in the northern region of the country compared to those in the south. Haplogroup A was more frequently found among Amerindian tribes in northern Colombia, while haplogroup D was more frequent among tribes in the south. Haplogroups A, C and D have clinal tendencies in Co-lombia and South America in general. Populations belonging to the Chibcha linguistic family of CoCo-lombia and other countries nearby showed a strong genetic differentiation from the other populations tested, thus corroborating previ-ous findings. Genetically, the Ingano, Paez and Guambiano populations are more closely related to other groups of south eastern Colombia, as also inferred from other genetic markers and from archeological data. Strong evidence for a correspondence between geographical and linguistic classification was found, and this is consistent with evi-dence that gene flow and the exchange of customs and knowledge and language elements between groups is facili-tated by close proximity.
Keywords: mitochondrial DNA, Amerindian, Colombia, Chibcha, genetic relationships. Received: August 11, 2012; Accepted: December 3, 2012.
Introduction
Studies about genetic variation among human popu-lations are of great value for understanding genetic struc-ture, migration routes and possible genetic relationships among different continental populations, and mitochon-drial DNA (mtDNA) analysis has frequently put to such use in American populations (Schurret al., 1990; Torroniet al., 1992, 1993a,b, 1994; Horai et al., 1993; Bailliet et al., 1994; Merriwether et al., 1994; Santos et al., 1994a,b; Bianchiet al., 1995; Lorenz and Smith, 1996; Merriwether and Ferrell, 1996; Bonatto and Salzano, 1997; Bisso-Ma-chadoet al., 2012). Despite its maternal inheritance (Giles
et al., 1980), the mitochondrial genome is extremely useful for determining genetic histories because of its rapid rate of mutation (Brownet al., 1979) and lack of recombination
and repair mechanisms. Most mtDNA polymorphisms are single nucleotide substitutions, but insertions and deletions have also been described (Brownet al., 1980; Cann and Wilson 1983; Cannet al., 1984; Wallaceet al., 1985; Horai
et al., 1993; Torroni et al., 1992, 1993a,b, 1994; Howell and Smejkal, 2000;). By revealing specific geographic lo-cations for mitochondrial haplogroups, such studies helped to clarify migration patterns of human populations through-out history and over all continents (Fernandez-Dominguez, 2005).
Previous studies based on mtDNA analysis in Native American populations revealed the presence of four distinct haplogroups called A, B, C and D. Haplogroup A is charac-terized by the gain of aHaeIII restriction site at position 663, haplogroup B by the 9 bp COII/tARNlys intergenic deletion, and haplogroup C by the loss of aHincII site at 13259 bp. Haplogroup D is characterized by the loss of an
AluI restriction site at position 5176 and a gain of aHincII site at 13259 bp (Torroni et al., 1992, 1993a,b. A fifth haplogroup, X, has been predominantly characterized in Send correspondence to Juan J. Yunis. Departamento de
Pato-logía, Facultad de Medicina, e Instituto de Genética, Universidad Nacional de Colombia, Edificio 426, oficina 207, Ciudad Univer-sitaria calle 53, Bogotá, D.C., Colombia. E-mail: [email protected], [email protected].
some primarily North American populations (Eshlemanet al., 2003), but is absent in South America (Dornelleset al., 2005).
Colombia has great cultural and genetic diversity. Its indigenous population is distributed in 89 different ethnic groups which are estimated to represent 1.83% of the total population (Arango and Sánchez, 2006). Based on the the-ory that peopling of the Americas occurred by migration from northeast Asia across the Bering Strait and subsequent migration through Central America to South America (Tur-ner, 1984; Greenberget al., 1986; Dillehay and Meltzer, 1991), the nowadays Colombian territory at the northern tip of South America became an obligatory passage for people migrating to the southern cone.
In Colombia, several mtDNA studies of indigenous communities have been carried out (Mesa et al., 2000; Keyeuxet al., 2002; Rodaset al., 2002; Torreset al., 2006; Meltonet al., 2007; Rondonet al., 2007). In this study, we analyzed 424 individuals from 21 Amerindian populations to determine genetic structure and relationships among them based on geographical and historical information, as
well as linguistic and genetic relationships with other tribes of the Americas.
Subjects and Methods
Samples
We analyzed 424 blood samples from individuals un-related by maternal lineage from 21 Amerindian tribes of Colombia (Table 1). Blood samples were collected be-tween 1989 and 1992 after proper informed consent had been obtained. Informed consent included approval of each tribal Chief or Governor. The linguistic affiliation of each tribe is shown in Table 1. No Ge-Pano Carib speaking tribes were included in this study (Table 1).
DNA extraction and mtDNA haplogroup analysis
DNA was extracted using the salting out method (Gustincichet al., 1991) with the DNA Wizard Genomic DNA Extraction Kit (Promega Corporation, Madison WI), following manufacturer’s recommendations.
Four regions of the human mtDNA representing mtDNA haplogroups A, B, C and D were PCR amplified
Table 1- Geographic location, sample size and linguistic classification for 21 Colombian Amerindian tribes analyzed.
mtDNA haplogroups (%) Linguistic classificationa Geographic location
(Department / region)
Population n A B C D E h
Chimila 21 95.2 4.8 0.0 0.0 0.0 0.0952 Chibcha Magdalena/ Caribbean region
Arsario 8 0.0 12.5 75.0 0.0 12.5 0.4643 Chibcha Magdalena / Caribbean region
Kogui 32 71.9 0.0 28.1 0.0 0.0 0.4173 Chibcha Cesar / Caribbean region
Arhuaco 21 90.4 4.8 4.8 0.0 0.0 0.1857 Chibcha Cesar / Caribbean region
Embera 21 9.5 52.4 28.6 9.5 0.0 0.6571 Choco-Chibcha Chocó / Pacific region
Ingano 48 39.6 35.4 22.9 2.1 0.0 0.5326 Andean Putumayo / Amazonian region
Guambiano 24 4.2 12.5 66.6 16.7 0.0 0.6791 Without Classification Cauca /Pacific region
Páez 36 27.8 8.3 27.8 33.3 2.8 0.7476 Without Classification Cauca /Pacific region
Wayuu 17 29.4 17.6 47.1 0.0 5.9 0.6985 Tucano-ecuatorial Guajira / Caribbean region
Tucano 14 7.1 21.4 7.1 57.1 7.1 0.6593 Tucano-ecuatorial Vaupés-Guainía/ Orinoquian region
Guanana 10 20.0 0.0 20.0 50.0 10.0 0.7333 Tucano-ecuatorial Vaupés-Guainía/ Orinoquian region
Cubeo 24 33.3 8.3 29.2 25.0 4.2 0.7645 Tucano-ecuatorial Vaupés-Guainía/ Orinoquian region
Curripaco 22 4.5 40.9 36.4 13.7 4.5 0.7100 Tucano-ecuatorial Vaupés-Guainía/ Orinoquian region
Desano 20 15.0 15.0 45.0 25.0 0.0 0.7263 Tucano-ecuatorial Vaupés-Guainía/ Orinoquian region
Barasano 5 80.0 0.0 0.0 20.0 0.0 0.4000 Tucano-ecuatorial Vaupés / Orinoquian region
Tatuyo 10 40.0 0.0 50.0 10.0 0.0 0.6444 Tucano-ecuatorial Vaupés / Orinoquian region
Piratapuyo 8 12.5 12.5 50.0 12.5 12.5 0.7857 Tucano-ecuatorial Vaupés / Orinoquian region
Tuyuca 6 17.0 50.0 0.0 17.0 16.0 0.8000 Tucano-ecuatorial Vaupés / Orinoquian Region
Puinave 61 8.2 50.8 32.8 6.6 1.6 0.6333 Tucano-ecuatorial Guainía / Orinoquian region
Yeral 8 12.5 12.5 50.0 25.0 0.0 0.7500 Tucano-ecuatorial Guainía / Orinoquian region
Piapoco 8 12.5 25.0 25.0 12.5 25.0 0.8929 Tucano-ecuatorial Guainía / Orinoquian region
Frequency 31.0 22.4 30.4 13.4 2.8 0.7447
Total 424 131 95 129 57 12
with the use of primers that were described elsewhere (Parraet al., 1998).
Each amplification reaction consisted of 2.5mL of DNA, 1.25mL of each set of primers (10 nmol/mL), 2.0mL of dNTPs (10 mM), and 0.125mL of DNATaqpolymerase (Promega Corporation, Madison WI). The reaction mixture also contained 1.5mL of MgCl2(25 mM) for haplogroup A,
and 2.0mL of MgCl2(25 mM) for the other haplogroups,
re-spectively, in a final volume of 25mL.
Amplification conditions consisted of a first denatur-ing cycle at 94 °C for 5 min; followed by 34 cycles of dena-turing at 94 °C for 30 s, annealing at 50 °C for 30 s (Haplogroups B and D) or at 55 °C for 30 s (haplogroups A and C), extension at 72 °C for 30 s, and a final extension step at 72 °C for 5 min. The amplification products were evaluated by electrophoresis in a 2% agarose Nusie-ve/Seakem gel that was stained with ethidium bromide and photographed under UV light. 15mL aliquots of the ampli-fied products for groups A, C and D were digested with re-striction enzymes for 3 h at 37 °C, while haplogroup B was only analyzed by electrophoresis. The digestion products were separated by electrophoresis in a 3% Nusieve/Seakem gel and processed as described above.
The haplogroup frequency of each population was es-timated by direct counting (Table 1, Figure 1). Genetic di-versity was estimated as (n/(n-1))(1-Spi2), wheren is the sample size andpithe haplogroup frequency estimate for haplogroupi(Nei, 1978). Genetic distance estimates were based on mtDNA haplogroup frequencies calculated from FSTpairs with the aid of Arlequin software (Excoffieret al.,
2005). Frequency data for mtDNA haplogroups belonging to Amerindian populations of South and Central America used in the analysis were obtained from the literature, see Table S1 (Gintheret al., 1993; Horaiet al., 1993; Torroniet al., 1993a, 1994; Baillietet al., 1994; Santoset al., 1994a; Bianchiet al., 1995; Kolmanet al., 1995; Merriwetheret al., 1995, 1997; Easton et al., 1996; Lalueza-Fox, 1996; Wardet al., 1996; Bonatto and Salzano, 1997; Kolman and Bermingham, 1997; Laluezaet al., 1997; Dipierri et al.,
1998; Rickardset al., 1999; Mesaet al., 2000; Moragaet al., 2000; Bertet al., 2001; Demarchiet al., 2001; Lobato-da-Silvaet al., 2001; Rothhammeret al., 2001; Keyeuxet al., 2002; Williams et al., 2002; Briceño et al., 2003; Fuselliet al., 2003; Garcia-Bouret al., 2004; Lewiset al., 2004; Sandovalet al., 2004; Dornelleset al., 2005; Cabana
et al., 2006; Torreset al., 2006; Marreroet al., 2007; Mel-tonet al., 2007; Barretoet al., 2008). The results are pre-sented in Figures 2 and 3.
In addition we calculated the degree of genetic differ-entiation among subpopulations (GST) based on the genetic
diversity of the total population. An AMOVA analysis us-ing Arlequin (Excoffieret al., 2005) was carried out using linguistic classification or geographical location as testing parameters. In the first analysis, we evaluated the linguistic classification of each tribe, and whether differences could be attributed to belonging or not to the Chibcha speaking family. In the second analysis, we tested groups by geo-graphic location (Tribes located in the north; tribes located in the east-Orinoquian/Amazonian region, and tribes lo-cated in the Pacific region-west). We also conducted a com-parison to determine if the Andes mountain range was a factor in genetic differentiation (Table 2).
Finally, we compared the genetic (FSTvalues),
geo-graphical (distance in km using the AMIGLOBE program) (Collard, 2006) and linguistic distance based on Ruhlen’s classification (Ruhlen, 1987) matrices to calculate a possi-ble relationship between these three variapossi-bles. This was done with the aid of Arlequin, V3.1 software (Excoffieret
Figure 1- Mitochondrial DNA (mtDNA) haplogroup frequency for 21 Amerindian populations of Colombia.
al., 2005) by using the Mantel test with 100,000 permuta-tions (Figure 3).
Results
Mitochondrial DNA haplogroup frequencies from 424 individuals belonging to 21 Amerindian tribes of Co-lombia are shown in Table 1 and Figure 1. Haplogroup A was found most frequently; its average frequency was 31% (131/424 individuals), followed by haplogroup C with 30.4% (129/424), haplogroup B with 22.4% (95/424) and haplogroup D with 13.4% (57/424). The 12 out of 424 indi-viduals who did not show any of the four mtDNA founder haplogroups (2.8%) were listed as haplogroup E. At least two of four mitochondrial haplogroups were present in the 21 populations studied. The frequency distribution of these haplogroups ranged from 2.1% to 95.2%.
Genetic diversity index values are shown in Table 1. The least genetic diversity was found among the Chimila tribe (h = 0.0952) while the greatest one was found among the Piapoco (h = 0.8929). The average diversity index for all populations studied was h = 0.7447 (n = 424).
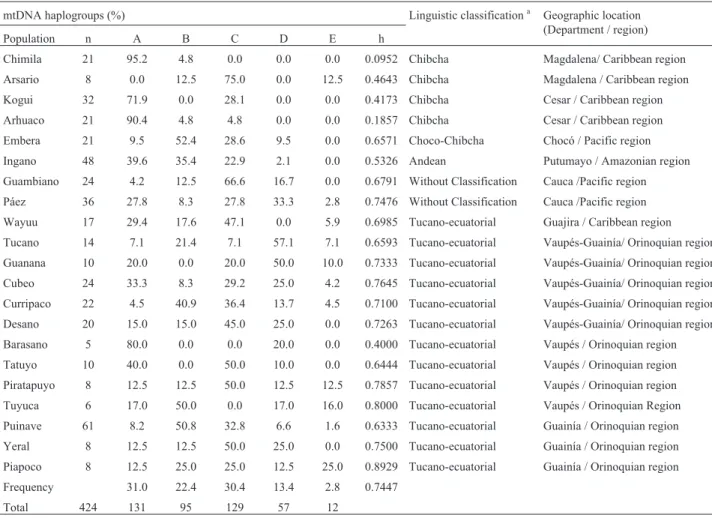
Figure 2 shows the mtDNA haplogroup frequency distribution based on four geographical location groups: Caribbean (northern region), Amazonian (southern region), Pacific (western region) and Orinoquian (eastern region). We also included data from other studies (Torroniet al., 1994; Kolman and Bermingham, 1997; Merriwetheret al., 1997; Mesaet al., 2000; Keyeuxet al., 2002; Briceñoet al., 2003; Torreset al., 2006; Meltonet al., 2007; Barretoet al., 2008) in this analysis. There was a marked clinal pattern for mtDNA haplogroup distribution among Amerindian tribes of Colombia. Haplogroup A frequency was higher in the northern region of Colombia (50% frequency) decreasing
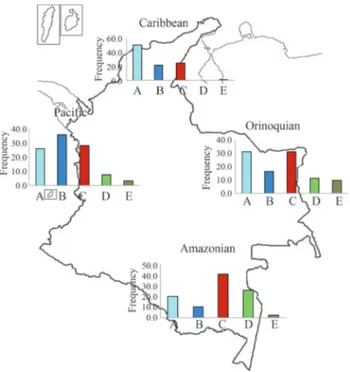
Figure 3- UPGMA tree based on FSTdistances for Colombian and Central
and South American Amerindian tribes analyzed for mtDNA haplo-groups.
Table 2- Analysis of Molecular Variance (AMOVA) for mtDNA haplogroups. Grouping based on linguistics or geographical criteria for Colombian Amerindian tribes.
Groups AMOVA values (%) Fixation index
a b c FSC FST FCT
1. Chibchas and Non-Chibcha 69.06 9.87 21.07 0.12505 0.30939 0.21069
* * (p = 0.001)
2. All linguistic families 77.26 15.83 6.91 0.17003 0.22739 0.06911
* * (p = 0.082)
3. North East and Pacific 72.54 11.26 16.2 0.13435 0.27458 0.162
* * (p = 0.013)
4. Andes barrier 79.2 17.66 3.14 0.18229 0.20796 0.03139
* * (p = 0.150)
to 20% in the southern region of the country while haplogroup C frequency was lower in the north and highest in the south. The pattern for haplogroup D was similar, be-ing almost absent in the northern part of Colombia, and showing the highest value in the southern part of the coun-try (25%). Haplogroup B was more frequent in the west, de-clining towards the east and south.
We constructed a UPGMA tree based on FSTgenetic
distances which includes other Amerindian populations from Central and South America (Figure 3). One cluster in-cluded the Kogui, Arhuaco and Chimila tribes of Colombia and the Teribe, Guaymi and Guataso Chibcha-speaking tribes of Central America, which are all characterized by high frequencies of haplogroup A. An exception was found for the Arsario tribe, where none of the individuals tested in this Chibcha speaking tribe carried haplogroup A. The re-maining Colombian tribes clustered together with other Amerindian tribes of South America that do not belong to the Chibcha linguistic family. The Guambianos, Paez and Ingano tribes were grouped within this cluster, reflecting their relationships to these non-Chibcha Amerindian popu-lations.
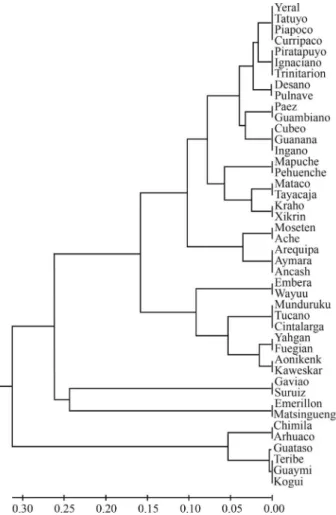
We performed a non-metric multidimensional scaling analysis based on the mtDNA haplogroups identified (Fig-ure 4,). Herein we included the results of other Amerindian populations (Table S1) as well as populations of African descent of Colombia (Nuqui, Guangui and Providencia) de-scribed by Rodaset al.(2002), and African populations as an outgroup (Chenet al., 2000) (Figure 4). Most of the Am-erindian tribes are clustered together due to the heteroge-neous presence of the four mtDNA haplogroups among them. However, the Chibcha speaking tribes have a ten-dency to cluster much closer together due to the high fre-quency of haplogroup A and low frequencies for haplo-groups C and D. The African descent populations from
Colombia are located intermediately between the Amerin-dian populations and the African population used as outgroup. This is due to the admixture process that resulted in the presence of some of the four mtDNA haplogroups among the Colombian African-descent populations.
The AMOVA analysis based on linguistic affiliation was used to test for differences based on belonging or not to the Chibcha linguistic family (Table 2). The Guambiano and Paez tribes were not included since their languages have not been classified yet. The results showed that 69% variations were due to variations within populations and 21% was due to whether or not a tribe belonged to the Chibcha linguistic family (p < 0.001). Another AMOVA analysis based on the geographical location of Colombian Amerindian tribes detected no significant differences when the tribes were grouped according to the side of the Andes mountain range they were located. Significant differences were found among tribes residing in the northern part of Colombia (most of the Chibcha speaking tribes analyzed here), compared to the Pacific region and the Orino-quian/Amazonian region (p = 0.013), but not so for the An-des as a separating barrier (p = 0.150) (Table 2).
Finally, the Mantel test was used to evaluate the pos-sible relationship between genetic, linguistic and geograph-ical distance. There was a strong correlation between linguistic and geographic distances, and a less strong corre-lation between genetic and geographic distances. There was no correlation between genetic and linguistic distance (Table 3).
Discussion
This study provides additional information on mtDNA haplogroup distribution in several Colombian Am-erindian populations to previous studies (Keyeux et al., 2002). Haplogroup A, with an average frequency of 31% (131/424 individuals) was found most frequently. It was followed by haplogroup C with 30.4% (129/424), haplo-group B with 22.4% (95/424) and haplohaplo-group D with 13.4% (57/424).
Previous studies of Colombian Amerindian popula-tions have shown high frequencies of haplogroups A and C and lower frequencies for haplogroup D (Keyeuxet al., 2002; Torreset al., 2006; Meltonet al., 2007; Rondonet al., 2007). Our results are in agreement with those reports. However, the 13.4% average haplogroup D frequency we found was higher than that previously published for
Co-Figure 4- NM-MDS plot of Amerindian populations from Central and South America, Colombian African descendant and African populations. The lower circle includes most of the Chibcha Speaking groups. The circle in the middle includes the populations of African descent in Colombia ,and the circle to the left includes African populations used as outgroup. For haplogroup data see Table S1.
Table 3- Mantel test correlating genetic, linguistic and geographical dis-tances for 21 Colombian Amerindian populations studied.
Matrix 1 Matrix 2 r p-value
Genetic Linguistic 0.156272 0.06825
Genetic Geographic 0.287512 0.00939
lombian Amerindian populations of 6.6% by Keyeuxet al.
(2002) and 9.95% by Torreset al.(2006). These differences could be attributed to the fact that these three studies chose different populations to study, or may even be due to differ-ences within groups of the same population. For example, Keyeuxet al. (2002) found no haplogroup D in the Paez tribe, whereas we found this haplogroup in 33% of the Paez individuals. Similar situations occurred in the cases of the other haplogroups. For instance, in our study, the Arsario tribe did not carry haplogroup A (but only 8 individuals were tested), while 68% of the individuals of the Arsario tribe tested by Meltonet al.(2007) were reported to carry haplogroup A. These results indicate an even greater ge-netic heterogeneity within the same populations than has been described before.
Only 12 out of 424 individuals showed none of the four founder mtDNA haplogroups (2.8%). These individu-als may either have unrecognized founder lineages (Bailliet
et al., 1994), recent racial admixture (Torroniet al., 1993a) or reversal of a mutation. The second possibility could be the case for the Wayuu, Arsario and Paez tribes in which admixture has been documented by blood groups and HLA class II genes (Yuniset al., 1994, 2001). The third possibil-ity, which is termed haplogroup C revertant, is common in populations found in the Colombian Orinoquian and Ama-zonian basin (Torreset al., 2006). This may be the case for the Piapoco tribe of our study that showed a 25% frequency of non A-D haplogroups. A high frequency (59%) for the revertant C haplogroup had previously been found by Tor-reset al.(2006) for this tribe. The same scenario is possible for the Piartapuyo (12.5%), Tuyuca (16%) and Guanana (10%) Amerindian tribes that live geographically close to-gether in the Northern Amazonian region of Colombia. They present low genetic admixture based on Y STR haplo-types (Campo, D and, JJY, unpublished data) and HLA Class II genes (unpublished data).
The Amerindian tribes considered in this study showed a high degree of genetic heterogeneity (Table 2) and diversity (similar to or greater than populations found throughout South America) as has been described before (Santoset al., 1994a; Batistaet al., 1995; Kolmanet al., 1995; Wardet al., 1996; Bonatto and Salzano, 1997; Mesa
et al., 2000; Keyeuxet al., 2002).
Genetic diversity values were higher among the Tucano-Equatorial speaking tribes (0.60 to 0.80) while the Chibchan-speaking groups showed lower values (0.09 to 0.50). These results are consistent with those reported for Chibcha speaking tribes from Central and South America, including Colombia (Torroniet al., 1994; Kolmanet al., 1995; Keyeux et al., 2002). The higher diversity values found in Amazonian populations may be a result of gene flow between these populations, as has been shown for other genetic markers such as the Y-chromosome (Mesaet al., 2000). Alternately, it could be the result of fission, frag-mentation and founder effects (Cavalli-Sforzaet al., 1992).
The population that showed the lowest genetic diversity value (and the highest frequency for haplogroup A) was the Chimila (h = 0.0952). The low diversity found in this popu-lation has been reported by others (Keyeuxet al., 2002) looking at different genetic markers and is probably due to inbreeding (unpublished data).
The high genetic diversity found in our study and oth-ers indicates that it is unlikely that bottleneck events took place during the early Amerindian settlement of South America. However, it is evident that Amerindian popula-tions located in northern Colombia that belong to the Chibcha linguistic family differ from non-Chibcha speak-ing tribes, as has been described before with nuclear genetic markers (Yuniset al., 1994, 2001). Previous studies have shown that Amerindian populations of northern Colombia are close to Central American tribes and North American Amerindian populations (Stone and Stoneking, 1993; Lorenz and Smith, 1996; O’Rourkeet al., 2000; Keyeuxet al., 2002; Meltonet al., 2007). Our results provide further support indicating that Chibcha speaking tribes in Central and South America genetically differentiated from non-Chibcha speaking tribes prior to entering South America.
There were marked clinal patterns for mtDNA haplo-group distribution among Amerindian tribes of Colombia. When populations were grouped according to their geo-graphical location (northern-Caribbean; southern-Amazo-nian, western-Pacific and eastern-Orinoquian) (see Figu-re 2), haplogroup A fFigu-requency was high in the northern part of Colombia (50% frequency) but decreased to 20% in the southern part of the country. Haplogroup C frequency was lower in the north and had its highest value in the south. Similarly, haplogroup D was almost absent in the north, but had the highest value in the southern part of the country (25%). Haplogroup B was more frequent in the west and had decreasing frequencies towards the east and south. These clinal patterns are similar to those described earlier (Torroni et al., 1994; Lalueza-Fox, 1996; Lorenz and Smith, 1996; Lalueza et al., 1997; Keyeux et al., 2002; Bisso-Machadoet al., 2012).
the Spanish conquest (Arboleda, 1993). Recently, archeo-logical findings in the west Amazonian region of Colombia have provided further support for an Amazonian ancestral origin of the Guambiano and Paez tribes.
The AMOVA analysis showed a significant associa-tion (p < 0.001) due to variaassocia-tion based on whether or not a tribe belonged to the Chibcha linguistic family (21%) (Ta-ble 2). On the other hand, our results do not support the hy-pothesis that the Andes mountain range served as a differ-entiation factor for the Amerindian tribes studied.
The strong genetic differentiation between the Chibcha and non-Chibcha speaking tribes is likely due to the high frequency of haplogroup A among these popula-tions. Similar results were obtained in the past using the major histocompatibility complex and other genetic mark-ers (Yuniset al., 1994, 2001).
The correlation analysis between the geographical, linguistic and genetic data (Table 3) showed the highest correlation value for the linguistic-geographical pair fol-lowed by the genetic-geographic comparison. These results are explained by the fact that many populations that belong to the same linguistic family are also geographically close, so it is difficult to infer whether there is a linguistic-genetic relationship based solely on mtDNA haplogroups. The Amerindian tribes that are closely related are also geo-graphically close, which facilitates gene flow and exchange of customs, knowledge and languages. Both geographic and linguistic factors are associated with genetic differenti-ation in the Amerindian populdifferenti-ations analyzed in Colombia. As has been found for other Amerindian tribes, these three parameters have evolved together in a historical and strongly correlated fashion.
Acknowledgments
We would like to thank all the Colombian Amerin-dian communities that kindly contributed by providing samples for this study. This research was financed in part by grants from Colciencias to EJY and by the Universidad Nacional de Colombia to JJY.
References
Arango R and Sánchez E (2006) Los Pueblos Indígenas de Co-lombia en el Umbral del Nuevo Milenio. Tercer Mundo, Bogotá, 426 pp.
Arboleda JE (1993) Inganos, Paeces y Coconucos: Notas para la Etnohistoría. Incora, Popayán, 218 pp.
Bailliet G, Rothhammer F, Carnese F, Bravi C and Bianchi N (1994) Founder mitochondrial haplotypes in American pop-ulations. Am J Hum Genet 54:27-33.
Barreto G, Osorio JC, Peña AV, Garcés HA and Rondón F (2008) Diversidad genética en poblaciones humanas de dos regio-nes colombianas. Colombia Médica 39:52-60.
Batista O, Kolman CJ and Bermingham E (1995) Mitochondrial DNA diversity in the Kuna Amerinds of Panama. Hum Mol Genet 4:921-929.
Bert F, Corella A, Gene M, Perez-Perez A and Turbon D (2001) Major mitochondrial DNA haplotype heterogeneity in high-land and lowhigh-land Amerindian populations from Bolivia. Hum Biol 73:1-16.
Bianchi N, Baillet G and Bravi C (1995) Peopling of the Americas as inferred through the analysis of mtDNA. Braz J Genet 18:661-668.
Bisso-Machado R, Bortolini MC and Salzano FM (2012) Uni-parental genetic markers in South Amerindians. Genet Mol Biol 35:365-387.
Bonatto SL and Salzano FM (1997) Diversity and age of the four major mtDNA haplogroups, and their implications for the peopling of the New World. Am J Hum Genet 61:1413-1423.
Briceño I, Gómez A, Lozano PAU, Mitchell RJ and Papiha S (2003) Mitochondrial variation in Colombia: Study of matri-lineal lineages among amerindian tribes. XIX International Congress of Genetics Proceedings, Melbourne.
Brown WM, George Jr M and Wilson AC (1979) Rapid evolution of animal mitochondrial DNA. Proc Natl Acad Sci USA 76:1967-1971.
Brown W, George M and Wilson A (1980) Polymorphism in mitocondrial DNA of humans as revealed by restriction endonuclease analysis. Proc Natl Acad Sci USA 77:3605-3609.
Cabana GS, Merriwether DA, Hunley K and Demarchi DA (2006) Is the genetic structure of Gran Chaco populations unique? Interregional perspectives on Native South American mito-chondrial DNA variation. Am J Phys Anthropol 131:108-119.
Cann RL and Wilson AC (1983) Length mutations in human mito-chondrial DNA. Genetics 104:699-711.
Cann RL, Brown WM and Wilson AC (1984) Polymorphic sites and the mechanism of evolution in human mitochondrial DNA. Genetics 106:479-499.
Cavalli-Sforza LL, Minch E and Mountain JL (1992) Coevolution of genes and languages revisited. Proc Natl Acad Sci USA 89:5620-5624.
Chen YS, Olckers A, Schurr TG, Kogelnik AM, Huoponen K and Wallace DC (2000) mtDNA variation in the South African Kung and Khwe-and their genetic relationships to other Af-rican populations. Am J Hum Genet 66:1362-1383. Demarchi DA, Panzetta-Dutari GM, Motran CC, Lopez de
Ba-sualdo MA and Marcellino AJ (2001) Mitochondrial DNA haplogroups in Amerindian populations from the Gran Cha-co. Am J Phys Anthropol 115:199-203.
Dillehay TD and Meltzer DJ (1991) The First Americans. CRC Press, Boca Raton, 310 pp.
Dipierri JE, Alfaro E, Martinez-Marignac VL, Bailliet G, Bravi CM, Cejas S and Bianchi NO (1998) Paternal directional mating in two Amerindian subpopulations located at differ-ent altitudes in northwestern Argdiffer-entina. Hum Biol 70:1001-1010.
Dornelles CL, Bonatto SL, De Freitas LB and Salzano FM (2005) Is haplogroup X present in extant South American Indians? Am J Phys Anthropol 127:439-448.
Eshleman JA, Malhi RS and Smith DG (2003) Mitochondrial DNA Studies of Native Americans: Conceptions and mis-conceptions of the population prehistory of the Americas. Evol Anthropol 12:7-18.
Excoffier L, Laval G and Schneider S (2005) Arlequin ver. 3.1: An integrated software package for population genetics data analysis. Evol Bioinform Online 1:47-50.
Fernandez-Dominguez E (2005). Polimorfismos de DNA Mito-condrial en Poblaciones Antiguas de la Cuenca Medi-terránea. Universidad de Barcelona, Barcelona, 670 pp. Fuselli S, Tarazona-Santos E, Dupanloup I, Soto A, Luiselli D and
Pettener D (2003) Mitochondrial DNA diversity in South America and the genetic history of Andean highlanders. Mol Biol Evol 20:1682-1691.
Garcia-Bour J, Perez-Perez A, Alvarez S, Fernandez E, Lopez-Parra AM, Arroyo-Pardo E and Turbon D (2004) Early pop-ulation differentiation in extinct aborigines from Tierra del Fuego-Patagonia: Ancient mtDNA sequences and Y-chro-mosome STR characterization. Am J Phys Anthropol 123:361-370.
Giles RE, Blanc H, Cann HM and Wallace DC (1980) Maternal inheritance of human mitochondrial DNA. Proc Natl Acad Sci USA 77:6715-6719.
Ginther C, Corach D, Penacino GA, Rey JA, Carnese FR, Hutz MH, Anderson A, Just J, Salzano FM and King MC (1993) Genetic variation among the Mapuche Indians from the Patagonian region of Argentina: Mitochondrial DNA se-quence variation and allele frequencies of several nuclear genes. EXS 67:211-219.
Greenberg J, Turner CG and Zegura SL (1986) The settlement of the Americas: A comparison of the linguistic, dental and ge-netic evidence. Curr Anthropol 4:477-497.
Gustincich S, Manfioletti G, Del Sal G, Schneider C and Carninci P (1991) A fast method for high-quality genomic DNA ex-traction from whole human blood. Biotechniques 11:298-300, 302.
Horai S, Kondo R, Nakagawa-Hattori Y, Hayashi S, Sonoda S and Tajima K (1993) Peopling of the Americas, founded by four major lineages of mitochondrial DNA. Mol Biol Evol 10:23-47.
Howell N and Smejkal CB (2000) Persistent heteroplasmy of a mutation in the human mtDNA control region: Hyper-mutation as an apparent consequence of simple-repeat ex-pansion/contraction. Am J Hum Genet 66:1589-1598. Keyeux G, Rodas C, Gelvez N and Carter D (2002) Possible
mi-gration routes into South America deduced from mitochon-drial DNA studies in Colombian Amerindian populations. Am J Hum Genet 74:211-233.
Kolman CJ, Bermingham E, Cooke R, Ward RH, Arias TD and Guionneau-Sinclair F (1995) Reduced mtDNA diversity in the Ngobe Amerinds of Panama. Genetics 140:275-283. Kolman CJ and Bermingham E (1997) Mitochondrial and nuclear
DNA diversity in the Choco and Chibcha Amerinds of Pan-ama. Genetics 147:1289-1302.
Lalueza-Fox C (1996) Mitochondrial DNA haplogroups in four tribes from Tierra del Fuego-Patagonia: Inferences about the peopling of the Americas. Hum Biol 68:855-871.
Lalueza C, Perez-Perez A, Prats E, Cornudella L and Turbon D (1997) Lack of founding Amerindian mitochondrial DNA lineages in extinct aborigines from Tierra del Fuego-Patagonia. Hum Mol Genet 6:41-46.
Lewis CM ,Tito RY, Lizarraga B and Stone AC (2004) Land, lan-guage, and loci: mtDNA in Native Americans and the ge-netic history of Peru. Am J Phys Anthropol 127:351-360. Lobato-da-Silva DF, Ribeiro-dos-Santos AKC and Santos SEB
(2001) Diversidade genética de populações humanas na Amazônia. In: Guimarães Vieira IC, Cardoso da Silva JM, Oren DC and D’Ineao MA (eds) Diversidade Humana e Cul-tural na Amazônia. Museu Paraense Emilio Goeldi, Belém, pp 167-193.
Lorenz JG and Smith DG (1996) Distribution of four founding mtDNA haplogroups among native North Americans. Am J Phys Anthropol 101:307-323.
Marrero AR, Silva-Junior WA, Bravi CM, Hutz MH, Petzl-Erler ML, Ruiz-Linares A, Salzano FM and Bortolini MC (2007) Demographic and evolutionary trajectories of the Guarani and Kaingang natives of Brazil. Am J Phys Anthropol 132:301-310.
Melton PE, Briceño I, Gómez A, Devor EJ, Bernal JE and Craw-ford MH (2007) Biological relationship between Central and South American Chibchan speaking populations: Evidence from mtDNA. Am J Phys Anthropol 133:753-770. Merriwether DA and Ferrell RE (1996) The four founding
lin-eages hypothesis for the New World. A critical reevaluation. Mol Phylogen Evol 5:241-246.
Merriwether DA, Rothhammer F and Ferrell RE (1994) Genetic variation in the New World: Ancient teeth, bone and tissue as sources of DNA. Experientia 50:592-601.
Merriwether DA, Rothhammer F and Ferrell RE (1995) Distribu-tion of the four founding lineage haplotypes in Native Amer-icans suggests a single wave of migration for the New World. Am J Phys Anthropol 98:411-430.
Merriwether DA, Reed DM and Ferrell RE (1997) Ancient and contemporary mitochondrial DNA variation in the Maya. In: Whittington SL and Reed DM (eds) Bones of the Maya: Studies of Ancient Skeletons. Smithsonian Institution Press, Washington, DC, pp 208-217.
Mesa NR, Mondragon MC, Soto ID, Parra MV, Duque C, Ortiz-Barrientos D, Garcia LF, Velez ID, Bravo ML, Munera JG,
et al. (2000) Autosomal, mtDNA, and Y-chromosome di-versity in Amerinds: Pre- and post-Columbian patterns of gene flow in South America. Am J Hum Genet 67:1277-1286.
Moraga ML, Rocco P, Miquel JF, Nervi F, Llop E, Chakraborty R, Rothhammer F and Carvallo P (2000) Mitochondrial DNA polymorphisms in Chilean aboriginal populations: Implica-tions for the peopling of the southern cone of the continent. Am J Phys Anthropol 113:19-29.
Nei M (1978) Estimation of average heterozygosity and genetic distance from a small number of individuals. Genetics 89:583-590.
O’Rourke DH, Hayes MG and Carlyle SW (2000) Spatial and temporal stability of mtDNA haplogroup frequencies in na-tive North America. Hum Biol 72:15-34.
Parra EJ, Marcini A, Akey J, Martinson J, Batzer MA, Cooper R, Forrester T, Allison DB, Deka R, Ferrell RE,et al.(1998) Estimating African American admixture proportions by use of population-specific alleles. Am J Hum Genet 63:1839-1851.
Native American populations. Am J Hum Genet 65:519-530.
Rodas C, Gelvez N and Keyeux G (2002) Mitochondrial DNA Studies show asymmetrical Amerindian admixture in Afro-Colombian and Mestizo populations. Hum Biol 75:13-30. Rondon F, Braga Y, Cardenas H and Barreto G (2007) Análisis de
la diversidad y el grado de estructura genética presente en poblaciones humanas colombianas a partir del uso de mar-cadores RFLPs de mtDNA. Rev Asoc Colomb Cienc Biol 19:94-103.
Rothhammer F, Llop E, Carvallo P and Moraga M (2001) Origin and evolutionary relationships of native Andean popula-tions. High Alt Med Biol 2:227-233.
Ruhlen M (1987) A Guide to the World’s Languages. Stanford University Press, Stanford, 469 pp.
Sandoval J, Fujita R, Delgado B, Rivas L, Bonilla B and Nugent D (2004) Variants of mtDNA among islanders of the lake Titicaca: Highest frequency of haplotype B1 and evidence of founder effect. Rev Peru Biol 11:161-168.
Santos M, Ward RH and Barrantes R (1994a) mtDNA variation in the Chibcha Amerindian Huetar from Costa Rica. Hum Biol 66:963-977.
Santos M, Ward RH and Barrantes R (1994b) D-Loop mtDNA de-letion as a unique marker of Chibchan Amerindians. Am J Hum Genet 55:413-414.
Schurr TG, Ballinger SW, Gan YY, Hodge JA, Merriwether DA, Lawrence DN, Knowler WC, Weiss KM and Wallace DC (1990) Amerindian mitochondrial DNAs have rare Asian mutations at high frequencies, suggesting they derived from four primary maternal lineages. Am J Hum Genet 46:613-623.
Stone A and Stoneking M (1993) Ancient DNA from a pre-Columbian Amerindian population. Am J Phys Anthropol 92:463-471.
Torres MM, Bravi CM, Bortolini MC, Duque C, Callegari-Jacques S, Ortiz D, Bedoya G, Groot de Restrepo H and Ruiz-Linares A (2006) A revertant of the major founder Na-tive American haplogroup C common in populations from northern South America. Am J Hum Biol 18:59-65. Torroni A, Schurr TG, Yang CC, Szathmary EJ, Williams RC,
Schanfield MS, Troup GA, Knowler WC, Lawrence DN, Weiss KM,et al. (1992) Native American mitochondrial DNA analysis indicates that the Amerind and the Nadene populations were founded by two independent migrations. Genetics 1:153-162.
Torroni A, Schurr TG, Cabell MF, Brown MD, Neel JV, Larsen M, Smith DG, Vullo CM and Wallace DC (1993a) Asian af-finities and continental radiation of the four founding Native American mtDNAs. Am J Hum Genet 53:563-590.
Torroni A, Sukernik RI, Schurr TG, Starikorskaya YB, Cabell MF, Crawford MH, Comuzzie AG and Wallace DC (1993b) mtDNA variation of aboriginal Siberians reveals distinct ge-netic affinities with Native Americans. Am J Hum Genet 53:591-608.
Torroni A, Chen YS, Semino O, Santachiara-Beneceretti AS, Scott CR, Lott MT, Winter M and Wallace DC (1994) mtDNA and Y-chromosome polymorphisms in four Native American populations from southern Mexico. Am J Hum Genet 54:303-318.
Turner C (1984) Advances in the dental search for Native Ameri-can origins. Acta Anthopogenetica 8:23-78.
Wallace DC, Garrison K and Knowler WC (1985) Dramatic founder effects in Amerindian mitochondrial DNAs. Am J Phys Anthropol 68:149-155.
Ward RH, Salzano FM, Bonatto SL, Hutz MH, Coimbra CE and Santos RV (1996) Mitochondrial DNA polymorphism in three Brazilian Indian tribes. Am J Hum Biol 8:317-323. Williams SR, Chagnon NA and Spielman RS (2002) Nuclear and
mitochondrial genetic variation in the Yanomamo: A test case for ancient DNA studies of prehistoric populations. Am J Phys Anthropol 117:246-259.
Yunis JJ, Ossa H, Salazar M, Delgado MB, Deulofeut R, de la Hoz A, Bing DH, Ramos O and Yunis EJ (1994) Major histo-compatibility complex class II alleles and haplotypes and blood groups of four Amerindian tribes of northern Colom-bia. Hum Immunol 41:248-258.
Yunis JJ, Yunis EJ and Yunis E (2001) Genetic relationship of the Guambino, Paez, and Ingano Amerindians of southwest Co-lombia using major histocompatibility complex class II ha-plotypes and blood groups. Hum Immunol 62:970-978.
Internet Resources
Collard O (2006) AMIGLOBE. p Amiglobe is a world atlas and database with information about every country in the world, http://www.downloadatoz.com/home-education_direc-tory/amiglobe-2006/.
Supplementary Material
The following online material is available for this ar-ticle:
Table S1 - mtDNA haplogroup frequencies of Co-lombian and South America Amerindian tribes.
This material is available as part of the online article from http://www.scielo.br/gmb.
Associate Editor: Francisco Mauro Salzano