INTRODUCTION
Greater efficiency in plant breeding programs is of utmost importance so that selection gains can meet the ever increasing demand for food. This efficiency may be achieved by various approaches, such as criteria-based pro-genitor choice, the method of segregant population advance and improvements in experimental precision during family evaluation.
Since all breeding programs have limited resources, one must decide whether it is best to perform several hybridiza-tions yearly with a reduced number of families or fewer hy-bridization but with a larger number of families in order to explore the maximum variability generated in each crossing. Several studies have determined the ideal number of families necessary for greater breeding efficiency (Sneep, 1977; Fouilloux and Bannerot, 1988; Huehn, 1996), although the results of these studies were obtained from simulations. Fouilloux and Bannerot (1988), for example, showed that plant breeding success is basically the same when one uses a relatively small (50) or large (>500) number of families. The main restriction in this case was that heritability was consid-ered to be 100%, an unrealistic finding in practice.
In the case of the common bean in Brazil, there is considerable variation in the number of families evaluated in segregant population studies (Marques Jr., 1997). In this study, we examined the effect of segregant population sample size on the efficiency of the selective process.
MATERIAL AND METHODS
Data from experiments with the common bean car-ried out at the Federal University of Lavras (UFLA) over
the last few years were used. The results of nine experi-ments were used. Six were from biparental crossings, and the others were families from a recurrent selection pro-gram (Table I). Culture treatments were basically the same in all experiments and did not differ from standard proce-dures for common bean culture.
Grain production (kg/ha) for all experiments was ana-lyzed by analysis of variance. From the expected mean squares, estimates were obtained for genetic variance among families (σ2
G), phenotypic variance among family means
(σ2
F), and heritability in the broad sense (h2) with lower and
upper limits estimated by the expressions presented by Knapp et al. (1985).
Using adjusted means, different sample sizes were evaluated in each simulation, starting with 30 families and increasing the sample size by 10 families in each step. These simulations were performed using one thousand samples of the same size. The phenotypic variance between the fam-ily means was estimated for each group of samples. The average variance, the maximum and minimum values, the range of the means (RM) and the variance standard error were also estimated.
Using the χ2 distribution, the probability of the
oc-currence of a phenotypic variance among family means was
estimated by the expression: , where n is the
sample size, s2
i is the value of the intended phenotypic
vari-ance for the different sample sizes and σ2
F is the value of
the phenotypic variance between family means (Chase and Brown, 1992).
The value of s2
i was determined by considering the
probability of obtaining heritability estimates at least equal
Family number in common bean selection
Wilton Duarte Ferreira1, Magno Antonio Patto Ramalho1, Daniel Furtado Ferreira2 and Moacil Alves de Souza1
Abstract
The objective of the present study was to determine the number of families necessary for selection in a segregant population. Nine segregant populations from the bean improvement program of the Federal University of Lavras were evaluated. The number of families varied from 169 to 295, and the average family heritability estimate (h2) for grain production varied from 5.3 to 82.0%. Different sample sizes were simulated
using the average family performance. The first sample consisted of 30 families, with each additional sample containing 10 more families, until the total number of families evaluated was reached for each population. One thousand simulations per sample size were performed. These data were used to determine the average, minimum and maximum phenotypic variance and the standard error of the variance. The probability of occurrence of a certain level of phenotypic variance for the corresponding values of 0.0, 0.25, 0.50 and 0.75 of heritability was deter-mined for all families, using a χ2 distribution. Based on the results obtained and considering the experimental precision and conditions of the
bean improvement programs in this region, the use of less than 100 families would reduce the probability of successful selection.
Departamentos de 1Biologia and 2Ciências Exatas, Universidade Federal de Lavras (UFLA), 37200-000
Lavras, MG, Brasil. Send correspondence to M.A.P.R.
χ2 =
σ2 F
to 0.0, 0.25, 0.50 and 0.75 of the heritability estimate ob-tained using all the families evaluated for each population. The starting point for obtaining s2
i was the expression that
estimates heritability at the level of family means (h2), such
that, h2 =
. For different proportions (x) of the
heritability (h2), h2 = xh2 = = , where σ2 is
the estimate of genetic variance among families of differ-ent sample sizes and corresponds to σ2
= h2 σ2 . The
pa-rameter x can assume the values of 0.0, 0.25, 0.50 and 0.75 of h2. Consequently, s2 = σ2
+ σ2/r, where σ2/r was
consid-ered constant and corresponded to the error mean square of the analyses of variance divided by the number of repli-cations.
RESULTS AND DISCUSSION
The number of families evaluated varied from 169 to 295. Based on the coefficient of variation (CV), the experimental precision was higher in the evaluation of F5:8
families in the Carioca x Flor de Mayo crossing and lower for F2:4 families from the Carioca x FT-Tarumã crossing
(Table I).
In spite of the large number of families evaluated, the precision of these experiments was similar to that usually obtained in common bean culture experiments in the re-gion. In an analysis of 61 evaluation experiments of pure lines and 28 trials of family evaluations, Marques Jr. (1997) obtained an average CV of 20.7% for lines in the recom-mendation phase, and 27.2% for cases in which segregant families were evaluated.
Heritability estimates in the broad sense varied from 5.3% for S0:2 families with recurrent selection to 82% for
S0:1 families. The largest h2 estimate was obtained in
ex-periments done in augmented blocks, i.e., in which families under recurrent selection were evaluated, as shown by the lower limit (LL) and upper limit (UL) values (Table I).
The phenotype variance estimates were based on simu-lations using family means from the Carioca-MG x H4 crossing (Table II), and clearly reflect the influence of the other simulations. The average variances of the different sample sizes were basically the same as the variance esti-mated using all of the families. This was expected, since 1,000 replications of each sample size were simulated.
With the reduction in sample size, the range of phe-notypic variance increased. The percentage of variance in the different sample sizes related to that obtained for all the families combined, showed that the nine populations behaved similarly. For example, in a sample size of 30
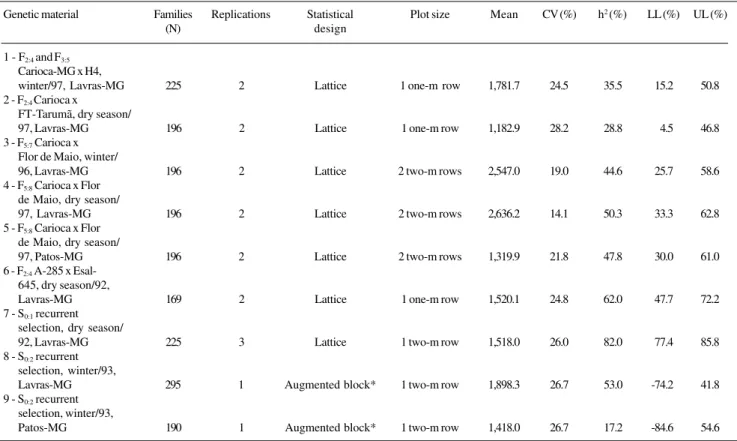
fami-Table I - The genetic material, number of families, number of replications, statistical design, plot size, average grain yield,
coefficient of variation (CV%), and heritability (h2) estimates with upper (UL) and lower (LL) limits for common bean grain production (kg/ha).
Genetic material Families Replications Statistical Plot size Mean CV (%) h2 (%) LL (%) UL (%)
(N) design
1 - F2:4andF3:5
Carioca-MG x H4,
winter/97, Lavras-MG 225 2 Lattice 1 one-m row 1,781.7 24.5 35.5 15.2 50.8 2 - F2:4Carioca x
FT-Tarumã, dry season/
97, Lavras-MG 196 2 Lattice 1 one-m row 1,182.9 28.2 28.8 4.5 46.8
3 - F5:7 Carioca x
Flor de Maio, winter/
96, Lavras-MG 196 2 Lattice 2 two-m rows 2,547.0 19.0 44.6 25.7 58.6
4 - F5:8 Carioca x Flor
de Maio, dry season/
97, Lavras-MG 196 2 Lattice 2 two-m rows 2,636.2 14.1 50.3 33.3 62.8
5 - F5:8 Carioca x Flor
de Maio, dry season/
97, Patos-MG 196 2 Lattice 2 two-m rows 1,319.9 21.8 47.8 30.0 61.0
6 - F2:4 A-285 x
Esal-645, dry season/92,
Lavras-MG 169 2 Lattice 1 one-m row 1,520.1 24.8 62.0 47.7 72.2
7 - S0:1 recurrent
selection, dry season/
92, Lavras-MG 225 3 Lattice 1 two-m row 1,518.0 26.0 82.0 77.4 85.8
8 - S0:2 recurrent
selection, winter/93,
Lavras-MG 295 1 Augmented block* 1 two-m row 1,898.3 26.7 53.0 -74.2 41.8
9 - S0:2 recurrent
selection, winter/93,
Patos-MG 190 1 Augmented block* 1 two-m row 1,418.0 26.7 17.2 -84.6 54.6
*: Two common controls were used.
σ2 G
σ2 + σ2 /r
G e i i σ2 Gi s2 i
σ2 + σ2 /r
Gi e
σ2 Gi
Gi
Gi x F
i Gi e e
lies, the minimal phenotypic variance was on average 63.8% lower than the populational variance. On the other hand, the maximum variance was 101.6% greater than this value. With a sample size of 100, the minimal phenotypic variance was less than 33% of the populational variance, and the maxi-mum was about 35% greater than this value.
In general, the standard error of the variances in-creased as sample size dein-creased. Thus, for a sample size of 30, the average variance standard error was 26.6% of the populational phenotypic variance, while for a sample size of 100, this value was only 11% of the variance.
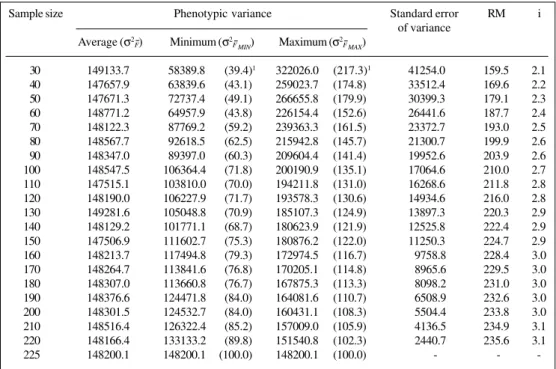
The probability of obtaining null heritability decreased as sample size increased (Figures 1-3). For a sample size of 100, the probability was essentially zero, except for S0:2
recurrent selection families in Lavras, which had a prob-ability of 4.8%, and the S0:2 generation recurrent selection
families in Patos de Minas, which had a probability greater than 10.0%.
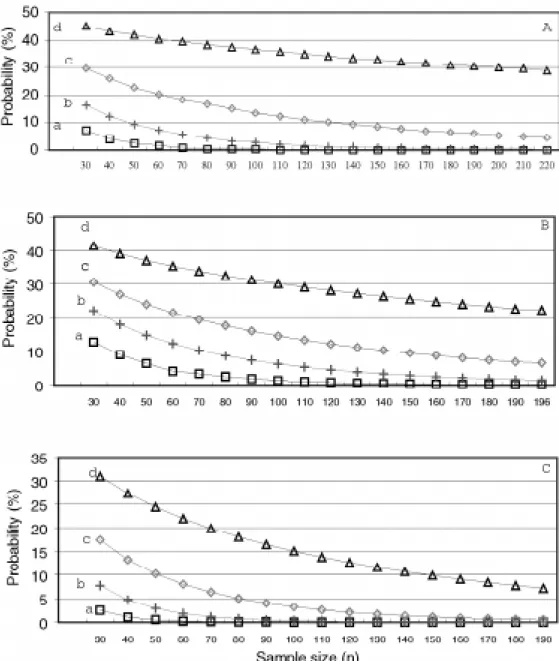
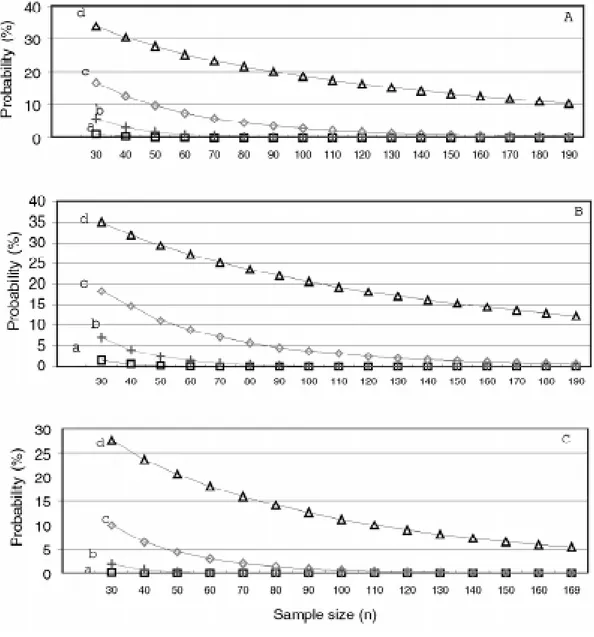
The same tendency was observed for the probability of obtaining heritabilities of 0.25 and 0.50 of the popula-tional estimate. In all cases, the probability of not obtaining a heritability 0.75 of the populational value increased as sample size decreased. For a sample size of 30, this value varied from 20.6% in the S0:1 generation from the recurrent
selection program in Lavras (Figure 3A) to 47.5% in the Carioca-MG x H4 crossings (F2:4 and F3:5 generations)
(Fig-ure 1A). Under similar conditions, but with a sample size of 100, the probability was lower, varying from 5.1% in the S0:1 generation of recurrent selection in Lavras (Figure 3A)
to 39.9% in the S0:2 generation of recurrent selection
fami-lies in Patos de Minas (Figure 3C).
The simulations also showed the variation in average grain yield of the families studied (Table II). In general, the grain yield range decreased as sample size decreased. Us-ing the values for grain yield range and heritability already mentioned, it was possible to predict the gain expected with selection using the expression GS = ds * h2. Considering
selection of the family with the highest average for each sample size, the selection differential (ds) would be given by ds = RM/2 + m - m, where m is the general average, such that ds = RM/2. Since the average phenotypic variance was the same for all sample sizes and the environmental vari-ance was constant, the heritability between family means can be considered constant for all sample sizes. Thus, the difference in the expected gain with selection will be a func-tion of only RM/2. Consequently, the gain with selecfunc-tion will be greater as the number of families evaluated in-creases. With 220 families, the gain was 235.6 kg/ha. With 30 families, it was 159.5 kg/ha. Therefore, the gain with selection, using 220 families (GS220), would be 1.48 times
greater than that obtained with 30 families (GS30) since
GS220/GS30= (RM220/2)h2/(RM30/2)h2 = 235.6/159.5 =1.48.
Using the standardized selection index (i) defined by Falconer (1980) as i = ds/σF = RM/2σF, the gain with
se-lection becomes GS = i. σ2
G/σF. Since σ2G/σF is constant,
the gain is a function only of the i value. For the Carioca-MG x H4 crossing, GS220/GS30 = i220/i30 = 3.1/2.1 = 1.48,
which is the same as calculated above.
Table II - Phenotypic variances (average, minimum and maximum) for grain yield (kg/ha) for different sample sizes. The standard error of the variance, range of the means (RM) and the standardized selection intensity (i) are also
shown for the F2:4 and F3:5 families from the Carioca-Mg x H4 crossing.
Sample size Phenotypic variance Standard error RM i
of variance Average (σ2
F) Minimum (σ2F MIN) Maximum (σ2F MAX)
30 149133.7 58389.8 (39.4)1 322026.0 (217.3)1 41254.0 159.5 2.1
40 147657.9 63839.6 (43.1) 259023.7 (174.8) 33512.4 169.6 2.2 50 147671.3 72737.4 (49.1) 266655.8 (179.9) 30399.3 179.1 2.3 60 148771.2 64957.9 (43.8) 226154.4 (152.6) 26441.6 187.7 2.4 70 148122.3 87769.2 (59.2) 239363.3 (161.5) 23372.7 193.0 2.5 80 148567.7 92618.5 (62.5) 215942.8 (145.7) 21300.7 199.9 2.6 90 148347.0 89397.0 (60.3) 209604.4 (141.4) 19952.6 203.9 2.6 100 148547.5 106364.4 (71.8) 200190.9 (135.1) 17064.6 210.0 2.7 110 147515.1 103810.0 (70.0) 194211.8 (131.0) 16268.6 211.8 2.8 120 148190.0 106227.9 (71.7) 193578.3 (130.6) 14934.6 216.0 2.8 130 149281.6 105048.8 (70.9) 185107.3 (124.9) 13897.3 220.3 2.9 140 148129.2 101771.1 (68.7) 180623.9 (121.9) 12525.8 222.4 2.9 150 147506.9 111602.7 (75.3) 180876.2 (122.0) 11250.3 224.7 2.9 160 148213.7 117494.8 (79.3) 172974.5 (116.7) 9758.8 228.4 3.0 170 148264.7 113841.6 (76.8) 170205.1 (114.8) 8965.6 229.5 3.0 180 148307.0 113660.8 (76.7) 167875.3 (113.3) 8098.2 231.0 3.0 190 148376.6 124471.8 (84.0) 164081.6 (110.7) 6508.9 232.6 3.0 200 148301.5 124532.7 (84.0) 160431.1 (108.3) 5504.4 233.8 3.0 210 148516.4 126322.4 (85.2) 157009.0 (105.9) 4136.5 234.9 3.1 220 148166.4 133133.2 (89.8) 151540.8 (102.3) 2440.7 235.6 3.1
225 148200.1 148200.1 (100.0) 148200.1 (100.0) - -
Figure 1 - Probability of populational heritability of grain productivity (h2) a = 0.0 h2, b = 0.25 h2, c = 0.50 h2 and d = 0.75 h2. Families from the
(A) Carioca-Mg x H4, (B) Carioca x FT-Tarumã and (C) Carioca x Flor de Mayo, during the winter of 1996 (Lavras, MG).
Again, when considering ≥100 families, the differ-ences in standardized selection intensity were small. In the Carioca-MG x H4 crossing, i100 = 2.7 and i220 = 3.1
(Table II), thus GS220/GS100 = 1.15. In other words, with an
increase from 100 families to 220 families, the average increase in the expected gain with selection would only be 15%. In this situation, it is questionable whether an in-crease of 2.2-fold in the number of families is compensa-tory. Since the number of families used in common bean studies is generally lower (Marques Jr., 1997) than in the experiments described here, our results should reflect the situation in most breeding programs for this species.
Some studies have shown that for a fixed number of
experimental plots that can be manipulated by the plant breeder, it is preferable to evaluate a greater number of crossings at the expense of a lower number of families from each crossing. Cooper (1988) suggested 100 crossings per year for soybeans. Starting with the F2:3 generation, 30
fami-lies per crossing should be evaluated with selection between and within families.
av-erage probability in nine populations with 30 families each was 8.14%. This percentage increases when one considers the probability of not detecting sizeable heritability, equiva-lent to 0.50-0.75 of the populational value. The observa-tions in relation to gain with selection also highlight this fact. In principle, when using a small number of families, the probability of a successful selection is less, especially when variability is low.
There are, however, procedures that make the early choice of more promising segregant populations possible (Jinks and Pooni, 1976; Abreu, 1997). In this case, working with a limited number of crossings allows one to explore the available variability in greater depth. To achieve this, a
larger number of families is necessary. As shown above, this number should be greater than 100.
Some reports have shown that most breeders’ suc-cess occurs when good lines are crossed with good lines (Rasmusson and Phillips, 1997). In this case, the mean of the segregant populations is high because of the already adapted lines involved, but the liberated variability is low, because the divergence between them is generally limited. Thus, for successful selection, plant breeders should be able to explore the low variability available. For this to happen, the family evaluation experiments must be as pre-cise as possible, and a greater number of families needs to be evaluated.
Figure 2 - Probability of populational heritability of grain productivity (h2) a = 0.0 h2, b = 0.25 h2, c = 0.50 h2 and d = 0.75 h2. Families from the
ACKNOWLEDGMENTS
Publication supported by FAPEMIG.
RESUMO
O objetivo desse trabalho foi obter informações que possam auxiliar os melhoristas de feijão, quando da decisão sobre a escolha do número de famílias de uma população segregante que deverá ser avaliada para maior eficiência com a seleção. Para isso, utilizaram-se dados experimentais de avaliação de nove populações
segregantes do programa de melhoramento do feijoeiro da Uni-versidade Federal de Lavras, conduzidos no período de 1992 a 1997, com o número de famílias variando de 169 a 295 e com a estimativa de herdabilidade (h2) para a produtividade de grãos, na
média das famílias, no intervalo de 5.3 a 82.0%. Utilizando o desempenho médio das famílias, foram simulados diferentes tamanhos de amostras, variando de 10 em 10, a partir de tamanho 30, até o número total de famílias avaliadas em cada caso. Foram efetuadas 1.000 simulações para cada tamanho de amostra. Com os dados foram estimados a variância fenotípica média, a mínima, a máxima e o erro padrão da variância. Utilizando a distribuição de Figure 3 - Probability of populational heritability of grain productivity (h2) a = 0.0 h2, b = 0.25 h2, c = 0.50 h2 and d = 0.75 h2. (A) S
0:1 families
from the recurrent selection, (B) S0:2 families from the recurrent selection, during the winter of 1993 (Lavras, MG) and (C) S0:2 families from
χ2 foi estimada a probabilidade de ocorrência de um dado valor da
variância fenotípica entre média das famílias, para cada tamanho de amostra, considerando h2 nula, ou com valores correspondentes
a 0.25, 0.50 ou 0.75 da herdabilidade obtida com todas as famílias sendo avaliadas. Constatou-se que, nas condições da precisão experimental em que são conduzidos os programas de melho-ramento do feijoeiro na região, com a utilização de um número de famílias inferiores a 100, a probabilidade de sucesso com a seleção é reduzida.
REFERENCES
Abreu, A. de F.B. (1997). Predição do potencial genético de populações segregantes do feijoeiro utilizando genitores inter-raciais. PhD thesis, UFLA, Lavras.
Chase, W. and Brown, F. (1992). General Statistics. 2nd edn.John Wiley and Sons Inc., New York.
Cooper, R.L. (1988). Mejoramiento por rendimiento en soya: prueba de generacion temprana y adaptacion especifica a ambientes de alto rendimiento versus ambientes de bajo rendimiento. In: Temas Actuales
en Mejoramiento Genético del Frijol Comum (Beebe, S., ed.). CIAT, Cali, pp. 301-323.
Falconer, D.S. (1980). Introdução à Genética Quantitativa. UFV, Viçosa.
Fouilloux, G. and Bannerot, H. (1988). Selection methods in common bean (Phaseolus vulgaris L.). In: Genetic Resources of Phaseolus Beans
(Gepts, P., ed.). Klüwer Academic Publishers, Dordrecht, pp. 503-541.
Huehn, M. (1996). Optimum number of crosses and progeny per cross in breeding self-fertilizing crops. I. General approach and first numerical results. Euphytica 91: 365-374.
Jinks, J.L. and Pooni, H.S. (1976). Predicting the properties of recombinant inbred lines derived by single seed descent. Heredity 36: 253-266.
Knapp, S.J., Stroup, W.W. and Ross, W.M. (1985). Exact confidence inter-vals for heritability on a progeny mean basis. Crop Sci. 25: 192-194.
Marques Jr., O.G. (1997). Eficiência de experimentos com a cultura do feijão. PhD thesis, UFLA, Lavras.
Rasmusson, D.C. and Phillips, R.L. (1997). Plant breeding progress and genetic diversity from de novo variation and elevated epistasis. Crop Sci. 37: 303-310.
Sneep, J. (1997). Selection for yield in early generations of self-fertilizing crops. Euphytica 26: 27-30.