A Morphospace for Reef Fishes: Elongation Is the
Dominant Axis of Body Shape Evolution
Thomas Claverie1*, Peter C. Wainwright2
1CUFR de Mayotte, Route nationale 3, 97660 Dembeni, France,2Department of Evolution and Ecology, University of California Davis, Davis, California, United States of America
Abstract
Tropical reef fishes are widely regarded as being perhaps the most morphologically diverse vertebrate assemblage on earth, yet much remains to be discovered about the scope and patterns of this diversity. We created a morphospace of 2,939 species spanning 56 families of tropical Indo-Pacific reef fishes and established the primary axes of body shape variation, the phylogenetic consistency of these patterns, and whether dominant patterns of shape change can be accomplished by diverse underlying changes. Principal component analysis showed a major axis of shape variation that contrasts deep-bodied species with slender, elongate forms. Furthermore, using custom methods to compare the elongation vector (axis that maximizes elongation deformation) and the main vector of shape variation (first principal component) for each family in the morphospace, we showed that two thirds of the families diversify along an axis of body elongation. Finally, a comparative analysis using a principal coordinate analysis based on the angles among first principal component vectors of each family shape showed that families accomplish changes in elongation with a wide range of underlying modifications. Some groups such as Pomacentridae and Lethrinidae undergo decreases in body depth with proportional increases in all body regions, while other families show disproportionate changes in the length of the head (e.g., Labridae), the trunk or caudal region in all combinations (e.g., Pempheridae and Pinguipedidae). In conclusion, we found that evolutionary changes in body shape along an axis of elongation dominates diversification in reef fishes. Changes in shape on this axis are thought to have immediate implications for swimming performance, defense from gape limited predators, suction feeding performance and access to some highly specialized habitats. The morphological modifications that underlie changes in elongation are highly diverse, suggesting a role for a range of developmental processes and functional consequences.
Citation:Claverie T, Wainwright PC (2014) A Morphospace for Reef Fishes: Elongation Is the Dominant Axis of Body Shape Evolution. PLoS ONE 9(11): e112732. doi:10.1371/journal.pone.0112732
Editor:Vincent Laudet, Ecole Normale Supe´rieure de Lyon, France
ReceivedJune 23, 2014;AcceptedOctober 14, 2014;PublishedNovember 19, 2014
Copyright:ß2014 Claverie, Wainwright. This is an open-access article distributed under the terms of the Creative Commons Attribution License, which permits unrestricted use, distribution, and reproduction in any medium, provided the original author and source are credited.
Data Availability:The authors confirm that all data underlying the findings are fully available without restriction. Photos used in this study are freely available from the online picture repository of photographs taken by J. Randall at the Bishop Museum: http://pbs.bishopmuseum.org/images/JER/images.asp.
Funding:This research was funded by the NSF grants IOS 0924489 and DEB 1061981 to PCW. The funder had no role in study design, data collection and analysis, decision to publish, or preparation of the manuscript.
Competing Interests:The authors have declared that no competing interests exist. * Email: [email protected]
Introduction
Repeated patterns of trait variation across species, such as wing analogies, can be of major interest for evolutionary biologists since they may reflect shared underlying evolutionary processes, such as flight mechanical constraints. One such repeated pattern appears to be body elongation in vertebrates [1–5]. Elongation has been shown to be the dominant axis of shape diversification in some clades [2], but few studies specifically address the repetition of this pattern in vertebrates. Here, we propose to investigate the prevalence of elongation in teleost fishes. Teleosts are a species-rich clade of vertebrates with more than 32 000 species among little more than 60 000 vertebrate species [6]. As such, this major group is of prime interest to study occurrences and processes of elongation in vertebrates.
Previous phylogenetically broad investigations suggest that elongation (measured as the ratio of body length by body depth, Fig. 1) is a major morphological trend across teleost species [3–5]. Studies on overall body shape or shape of part of the body (often part of the cranium), have found that elongation is the principal axis of shape diversity within clades of Pomacentridae [7–10],
Balistidae [11], Cichlidae [12], Anguilliformes [13,14] and Labridae [15]. A major role for elongation has even been described several times intraspecifically (e.g. in Cichlidae [16]). However, for some of these studies, the number of species representing larger clades includes only a small fraction of the group (often less than 1% of the recognized species), and only a handful of groups have been investigated. Therefore, it remains unclear whether elongation is a major and repeated pattern of body shape diversification in teleosts.
In this study, we addressed two questions. First, is elongation a major trend in shape diversification in reef fishes? Second, do we see a common underlying anatomy of changes in elongation or is there diversity in this anatomy that leads to a convergent trend in fish shape diversification? We investigate these questions using a tropical reef fish morphospace based on lateral-view photographs (Fig. 1) of 2939 Indo-Pacific species belonging to 56 families, or roughly 10% of all teleosts. Tropical marine fishes that live in association with reefs are widely regarded as being among the most morphologically diverse assemblages of fishes on earth and can, as such, be used to represent variation in teleosts. Based on previous work on fish morphology, for the first question, we can
hypothesize that elongation is a major repeated axis of shape diversification in teleosts. To address the second question, we explore whether there is evidence for divergence among groups in how the fish body becomes elongate, or deep-bodied, during evolution. Indeed, although variation in elongation appears to occur regularly among vertebrates, the underlying anatomical basis of elongation can differ greatly. For example, in mammals and birds, the head appears to be the dominant body region for variation in elongation, while in Actinopterygii (ray-finned fishes) and in amphibians there is more variation in the post cranial region [1]. Furthermore, in bony fishes, elongation appears dominant in the precaudal region in Sarcopterygii but in the caudal region in chondrichthyans and actinopterygians [17]. However, a previous survey of actinopterygians suggested that abdominal vs caudal elongation could be clade specific [5].
Finally, recent advances in the phylogenetics of teleosts and particularly acanthomorphs make it clear that far from being a single monophyletic group, reef fishes are highly polyphyletic [18– 20]. The vast majority of reef fish lineages are acanthomorphs (spiny-rayed fishes), but the modern reef fish fauna reflects the accumulation of many lineages that have independently made the transition to reef habitats over the past 100 million years [15,20– 22]. Unfortunately, no comprehensive species-level phylogeny exists for modern reef fishes yet, so it is not possible to match our sample of reef fishes with a phylogenetic hypothesis that would allow the exploration of a number of additional questions about the evolutionary history of body shape.
Methods
Specimen sampling and family grouping
A total of 2939 species from 56 families of Indo-Pacific fishes were included in this study (Table 1). Most of these were acanthomorphs, with the exception of some clupeids, engraulids, and synodontids. Anguiliform species such as the Muraenidae were not included in this study because all specimens were photographed in a bent posture and therefore were inapproriate for morphometric analysis of body shape. Our sample represents nearly 10% of described teleost species and over 17% of acanthomorph species. Photos were obtained from the online picture repository of photographs taken by Dr. Jack Randall at the Bishop Museum (http://pbs.bishopmuseum.org/images/JER/ images.asp). The numbers of species included in that study was
therefore constrained by their availability in that picture reposi-tory. Analyses were conducted with the lateral view photograph of a single adult individual of each species.
Species were grouped into monophyletic families using the Catalog of Fishes [6], with some modifications to reflect recent phylogenetic discoveries. Departures from the Catolog of Fishes concerned Serranidae, Caesionidae, Tetrarogidae, Sebastidae, Scaridae and Microdesmidae. Serranidae was divided in two groups: Serranidae (including Serraninae and Anthiinae, mainly the latter in this work) and Ephinephelidae [23]. Caesionidae appears to be nested within Lutjanidae and was included in that family [24]. Tetrarogidae was included in Synanceiidae [25], Sebastidae was included with Scorpaenidae [25], Scaridae was included with Labridae [26,27], and Microdesmidae was included in Gobiidae [28,29].
Morphometrics
Landmark-based geometric morphometric methods [30] were used to quantify body shape from 17 landmarks (Fig. 1, Table 2). Landmarks were positioned to capture major body regions and functionally significant features relevant to feeding and locomo-tion. Landmarks were limited to those representing operationally homologous features that could be found in every species. Landmark positions are described in Table 2 (Fig. 1). For one family, the Syngnathidae, the anal fins were either not present or vestigial and situated next to the anus on the anterior side of the egg pouch in some tail-brooder (e.g.Syngnathus leptorhynchus). In syngnathids, landmarks 7 and 8 were situated side by side next to the anus and on the anterior edge of the egg pouch in tail-brooders or on the posterior edge of the pouch in abdominal-brooders. The coordinates of these 17 landmarks were digitized using TPSdig [31].
Landmark configurations of every fish image were digitally superimposed and morphological information was extracted. Superimposition consists of rotating, translating and rescaling the landmark configurations to remove variation due to relative fish size and position on pictures. This procedure requires the construction of a morphospace, which represents a multivariate space defined by the type of forms studied and the number of landmark coordinates, and is used to quantify differences among specimens [32]. This procedure was done using the generalized Procrustes superimposition method [33]. Tangential Procrustes residuals (i.e. superimposed coordinates minus consensus coordi-nates) were used as the shape data for subsequent analyses [34]. The R packages Geomorph and Morpho were used for these procedures [35].
Geometric morphometric methods assume a limited spread of specimens in the morphospace, but we investigated extensive morphological variation such that a potential breach of this assumption had to be investigated. Most statistics in geometric morphometrics are based on Euclidean space while shape data belongs to what is called the ‘‘Kendal shape space’’ [32]. Therefore a projection of data from the Kendal shape space to the Euclidean space is required before analyses can be done. However, curvature of both spaces are not the same and during projection distortion of specimen position in the morphospace might occur in a manner similar to the way that landscapes get distorted when viewed through a fisheye lens. The error made by such projection was estimated by comparing pairwise Procrustes distances (i.e. shape difference) among landmark configurations from both spaces (Kendall and Euclidean) using a correlation [36]. This was done using TPSsmall [37]. The Pearson’s product moment correlation between distances measured in the two spaces Figure 1. Landmarks that were digitized to characterize body
Table 1.Families included in the present study with numbers of species sampled and the number of species recognized in each family by the catalog of fishes [6].
Family ID Family name
Number of species sampled
Number of valid
species Family ID Family name
Number of species sampled
Number of valid species
1 Acanthuridae 59 85 29 Lutjanidae 77 133
2 Antennariidae 13 48 30 Malacanthidae 11 46 3 Apogonidae 138 347 31 Monacanthidae 35 109
4 Atherinidae+ 11 71 32 Mugilidae 18 72
5 Balistidae 25 41 33 Mullidae 38 83
6 Batrachoididae#
4 83 34 Nemipteridae 39 69
7 Belonidae++ 9 38 35 Opistognathidae+ 14 81
8 Blenniidae 167 404 36 Ostraciidae 25 27
9 Bythitidae+ 15 209 37 Pempheridae 23 30
10 Callionymidae 49 189 38 Pinguipedidae 27 84 11 Carangidae 52 148 39 Platycephalidae 24 81 12 Chaetodontidae 97 131 40 Plesiopidae 15 49 13 Cheilodactylidae 10 27 41 Pomacanthidae 62 88 14 Cirrhitidae 20 35 42 Pomacentridae 216 390 15 Clupeidae+ 30 195 43 Priacanthidae 11 19
16 Diodontidae++ 9 18 44 Pseudochromidae 50 152
17 Engraulidae+ 12 146 45 Sciaenidae 17 291
18 Ephippidae++ 4 15 46 Scombridae 18 53
19 Epinephelinae 115 233 47 Scorpaenidae+ 61 351
20 Gobiesocidae+ 10 162 48 Serranidae 76 300
21 Gobiidae 547 1772 49 Siganidae+ 21 32
22 Haemulidae 29 132 50 Sparidae+ 21 134
23 Hemiramphidae 24 61 51 Sphyraenidae 12 29 24 Holocentridae 52 84 52 Synanceiidae+ 20 75
25 Kyphosidae#
8 51 53 Syngnathidae 18 338
26 Labridae 334 614 54 Synodontidae 22 69
27 Leiognathidae 17 50 55 Tetraodontidae 56 190 28 Lethrinidae 28 41 56 Tripterygiidae+ 24 168 +represents the poorly sampled taxa (
,20% of total accepted number of species),
++represent taxa with less than 10 species sampled and#
represent families poorly sampled and with less than 10 species. doi:10.1371/journal.pone.0112732.t001
Morphospa
ce
for
Reef
Fishes
PLOS
ONE
|
www.ploson
e.org
3
November
2014
|
Volume
9
|
Issue
11
|
was very high (p,0.001, r = 1.00). Thus, standard statistics could be applied to this dataset.
Body shape variation among species
We summarized trends in fish shape using a principal component analysis (PCA) on the shape variables (Procrustes residuals) of all species. Thin-plate spline interpolation functions were used to compute deformation grids and represent shape variation across species [34]. A broken stick procedure was used as a rule of thumb to decide how many principal components (PC) were relevant and significant for interpretation [38]. Investigation of shape variation described by the significant PCs was used to investigate body shape variation across the entire sample and within each of the 56 families.
Morphological diversification probably does not occur in the same way in every family, but it is possible that there are common tendencies or repeating patterns. We compared the primary axes of diversification across families using a combination of ordination methods. The first principal component of shape in each family was used to represent the trend in morphological diversification. The first PC of shape for each family is a vector passing through the cloud of representative species in the direction of their maximum spread in the morphospace. We therefore performed separate Procrustes superimpositions and PCA’s for each family and extracted the coordinates of each PC1. We then calculated the pairwise angles among these vectors to characterize the differences in diversification among families. These angles took values between 0 degrees (parallel) and 90 degrees (orthogonal). Finally, we performed a principal coordinate analysis (PCoA [39]) on the pairwise angles dissimilarity matrix to identify which families had similar axes of variation (e.g. parallel diversification) and whether clustering of families was present. These analyses were performed using custom functions written in R [35]. These functions are provided as File S1.
Elongation and maximum axis of shape variation
Several taxonomically focused studies of fish shape found deformation associated with body elongation was a major axis of shape variation [3,4,7,9,11,12]. To assess the recurrence of body elongation as the dominant axis of shape change in different families from our sample, we determined how strongly elongation is related to the main axis of variation (PC1) in each family and how much of the shape variation is explained by elongation within each family.
For each family, we measured the angle between two vectors in the morphospace: the vector describing maximum shape variation among species, PC1, and the vector indicating the direction of body elongation among species. We defined ‘elongation’ as the ratio between fish standard length and maximum body depth (Fig. 1). The elongation vector in the morphospace of each family was the vector that maximized differences in elongation among species. The coordinates of this vector were calculated with a modified redundancy analysis (RDA) that combined regression and PCA. Conceptually, a RDA is a multivariate multiple linear regression followed by a PCA on the matrix of regression fitted values [39,40]. The method is used to find the maximum axis of variance in a multivariate dataset along a gradient also defined by a multivariate dataset. We wanted to find the vector that describes maximum elongation variance in the morphospace. Therefore, we used a univariate multiple linear regression to calculate shape-fitted values using elongation as the independent variable. We then performed a PCA on these fitted values to extract the coordinates of the first eigenvector that describes the axis of maximum elongation in the morphospace of each family. We subsequently calculated the angle between the axis of maximum elongation and PC1 for each family. Significance was assessed using a permuta-tion procedure.
The permutation procedure tested the null hypothesis that elongation and PC1 for each family were not correlated. We randomly shuffled elongation variables for each specimen in a Table 2.Disposition of landmarks on specimens.
Landmarks number Description of its position
1 Posterior-ventral margin of the distal arm of the maxilla
2 Most anterior proximal limit between the premaxilla and the head of the maxilla 3 Insertion of the most anterior ray of the dorsal fin on the body
4 Insertion of the most posterior ray of the dorsal fin on the body 5 Dorsal insertion of the caudal fin
6 Ventral insertion of the caudal fin 7 Insertion of the first ray of the anal fin 8 Insertion of the last ray of the anal fin 9 Anterior-dorsal insertion of the pectoral fin 10 Posterior-ventral insertion of the pectoral fin
11 Joint between the post-temporal and supracleithrum. Movement at this joint accompanies cranial elevation during prey capture. We located this landmark at the intersection between the lateral line and the posterior-dorsal edge of the operculum
12 Most dorsal point on the preopercle 13 Inflection in the deep preopercular bend 14 Anterior tip of the preopercle
15 Most anterior point on the eye 16 Most posterior point on the eye
17 In association with landmark 11, was used as an estimate of epaxial muscle height and was situated on the dorsal edge of the fish vertically above landmark 11
family (random sampling without replacement) and calculated the new coordinates of the elongation vector using the procedure described above. We then calculated the angle between PC1 and this new elongation vector. We performed this randomization 1000 times to construct a distribution of angles. Based on that distribution and the angle between PC1 and elongation we could estimate the probability of independence between elongation and PC1 for each family. R codes used for this procedure are given in File S1.
Results
Elongation is the major axis of shape variation
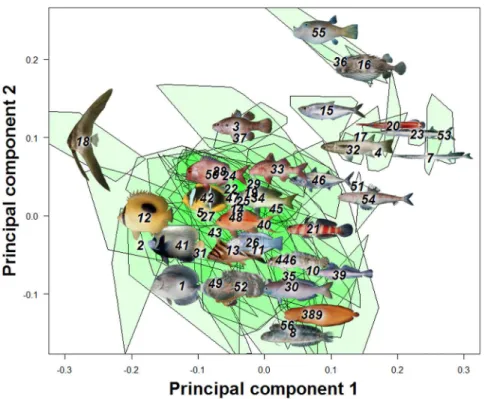
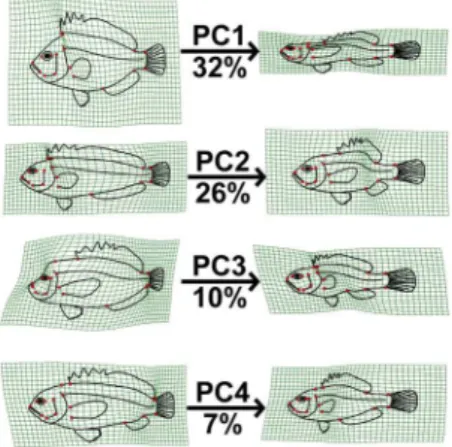
The first three principal components from a principal compo-nents analysis (PCA) on landmark data were recovered as meaningful with a broken-stick analysis. For convenience of visual presentation (Fig. 2 & 3), PC4 is reported and discussed in the following. Together the first four PCs explained 75.3% of the shape variation in the overall dataset. The first axis (32.1% of total variance) represents a contrast between deep-bodied and elongate shapes (Fig. 2 & 4). For example, extremes on this axis are the extremely deep-bodied Ephippidae at the low end and the slender-bodied Belonidae at the high end. Within the head region, the change in body depth is mainly accomplished by compression or dilation of the dorsal region of the head, not by a global dorsoventral change. The position and shape of the mouth, preoperculum and eye barely change along PC1. There is also some posterior movement of the anterior edge of the dorsal fin as the body becomes elongate and slender. The second PC (26.2%) reflects a contrast between long and short dorsal and anal fins (Fig. 2 & 4, e.g. at the extremes are some Blenniidae with elongate fins vs some Tetraodontidae species with very short fins). The third axis (13.2%) reflects a contrast between small and large mouths, a short and pronounced facial region, and a rotation of the pectoral fin from vertical to a more horizontal orientation (Fig. 3 & 4). At extremes of this axis are small-mouthed Ephippidae and very large-mouthed Antennariidae species. Finally, fish with a high score on the fourth PC (6.87%) have a slight upward rotation of the mouth, an increase of the anal fin basal length, and a decrease of the dorsal fin basal length (Fig. 3 & 4). For example, Pempheridae have high PC4 scores while Synodontidae are at the other extreme.
The first PC of the overall data set differs from an axis of pure elongation (the axis defined by the ratio of body length/maximum body depth) in the morphospace by only 14.4 degrees, and these two vectors are significantly associated (p,0.001, Fig. 5). Looking at shape change within each family, in 66% of the families the main axis of shape diversification cannot be distinguished from elongation (Fig. 6).
Patterns of shape change within families
The principal coordinates analysis (PCoA) on the PC1 vectors for each of the 56 families reveals major patterns of diversity in how shape changes within family. The first two axes from the PCoA account for 18.6% of the overall variation in shape change among families. The first axis (10.9%, Fig. 7A) represents, at the low end, families that diversify by similar change in all body regions, while on the high end of that axis, families show changes in the relative proportion of the body occupied by the precaudal and caudal regions. Families show a bimodal distribution along this axis, clustering toward the extremes (Fig. 7A). The second axis (7.8%, Fig. 7A) represents, on its low end, families that show changes in the proportion of the body made up by the head and postcranial regions. On the high end of this axis, families change
body shape (i.e. mainly depth) without affecting the head and body proportions (Fig. 7A), while there is change in the proportion made by trunk and caudal regions. Examples of families in the four corners of this plot include Opistognathidae (family 35) and the Priacanthidae (family 43) in the bottom left corner, that show very little change in head shape, relative to the postcranial part of the body which experiences elongation while conserving trunk and caudal region proportions (Fig. 7B). In other words, these families undergo elongation in the postcranial region, but not the head. Lethrinidae (family 28) and Pomacentridae (family 42), in the upper left corner, show changes in body depth while maintaining constant proportions of the body made by the head, trunk and caudal regions. Pempheridae (family 37) and Bythitidae (family 9), in the upper right corner, undergo elongation of the caudal region and compression of the trunk as the body becomes deeper. Finally, Pinguipedidae (family 38) and Scombridae (family 46), in the lower right corner, show a compression of the trunk region as the body becomes more elongate (Fig. 7B). Care should be taken in interpreting these results because amplitude of the variation within each family may vary (amplitude is coded by color of dots in Fig 7B).
Discussion
The dominant axis of shape variation in Indo-Pacific reef fishes contrasts deep-bodied fish at one extreme (e.g.Platax,Chaetodon, Zebrasoma, Zanclus) with slender, highly elongate forms at the other extreme (e.g. Syngnathus, Platybelone, Hemirhamphus, Synodus). This pattern was repeated within two-thirds of the families investigated indicating that the overall importance of elongation emerges from an important role at different phyloge-netic scales. Nevertheless, we identified considerable diversity in the anatomical basis of elongation, suggesting underlying variation in the developmental basis of these changes and the functional consequences of body shape.
Shape diversification in fishes.
Reef fish morphological diversity is enormous, yet we identified two axes that account for more than half of the total variation in body shape: these axes capture variation in relative body depth and the length and position of the median fins. Considering the landmarks we chose in this study (eye position, mouth size, fin position, etc.), and the amount of diversity present in fish shape [41], this result was neither obvious nor inevitable. For example, given the diversity of fish feeding mechanisms [42–47], it would be plausible for the main axis of shape variation to be related to changes in head morphology, particularly because nine out of 17 landmarks were selected to measure shape of functionally important head features. In fact, head shape variation was not strongly expressed until the 3rdand 4thPCs. The third and fourth PCs (20.1% of the total shape variation combined) include head shape variation mainly expressed by mouth size and orientation. Overall, body elongation and fin position dominate shape diversity in our sample, while head deformation appears to be secondary in importance.
The dominance of the elongation axis could have emerged from a history in which changes in elongation took place before the modern lineages (families) were established. But this does not appear to be the case, as there is extensive overlap in the morphospace among most of the families (Fig. 2) and the pattern of variation in elongation dominates within families (Fig. 6). Another possibility is that elongation evolved multiple times in most of the extant clades. Variation at the broad phylogenetic scale of our entire sample could hide important axes of shape Morphospace for Reef Fishes
Figure 2. A principal component analysis (PCA) on overall fish shape data showed four main axes of shape deformation representing respectively 32.1%, 26.22%, 13.23% and 6.87% of the overall shape variation in reef fishes (A & B).Fish pictures and family numbers are placed on the centroid of each family and used to identify their relative position in the morphospace. A green polygon is used to represent the spread of species for each family.
doi:10.1371/journal.pone.0112732.g002
Figure 3. A principal component analysis (PCA) on overall fish shape data showed four main axes of shape deformation representing 13.23% and 6.87% for the third and fourth principal component of the overall shape variation in reef fishes.Fish pictures and family numbers are placed on the centroid of each family and used to identify their relative position in the morphospace. A green polygon is used to represent the spread of species for each family.
change specific to families, such as head deformations that would contribute to elongating or deepening body shape. We found elongation to be the dominant axis of variation at the scale of the overall sample, and for two-thirds of the families sampled (Fig. 6). However, this suggests that for about one-third of the families, evolutionary changes in shape are not strongly associated with body elongation.
The analysis of similarity among families in their primary axis of shape deformation (PC1) using a principal coordinates analysis [39] reveals diversity in how elongation is achieved. In this plot (Fig. 7), families cluster based on the nature of their primary axis
of shape change, not based on their average shape. Note for example, Bythitidae and Pempheridae have nearly the same position in the PCoA plot, indicating similar patterns of shape change along PC1 for each family, even though the average shape of fish in the two families is quite different (Fig. 7B, top right).
The distribution of families in the principal coordinates space reveals that the main axes of fish shape variation are driven by different types of body deformation. The distribution of families in the space of the first two principal coordinate axes reveals one cluster of families in the upper left that elongate by proportional changes spread along the body. In the bottom left region of the plot are families that show proportional changes in the trunk and caudal regions but show changes in the head/post cranial proportions mainly with a bigger head as species become deep bodied. In the upper right region of the plot, families show proportional changes in the head/postcranial regions, but different changes to the proportions of trunk and caudal regions. Finally, in the bottom right, families elongate by a reduction in the contribution of the head and caudal region but stretch the trunk (Fig. 7). This diversity in how body regions are affected during elongation strongly suggests diversity in both the selective factors that cause these shape changes and the underlying developmental processes that effect the change.
The head, trunk, and caudal region were previously proposed to be three distinct developmental modules in fishes [5,14]. Because we did not investigate within species variation, we will only discuss here cross-species variation and its implications for evolutionary modularity rather than developmental modularity [48,49]. Ward and Brainerd [5] showed that the number of vertebrae in the trunk vs. the caudal region can vary independently across fish species, indicating some separation in the developmental regulation of the two body regions. A negative relationship between relative head length and body length has been shown to occur in moray eels Figure 4. A grid line deformation along each of the four
principal components represented in fig. 2&3 is presented to describe deformation along these axes. Percentages represent variance explained by each axes.
doi:10.1371/journal.pone.0112732.g004
Figure 5. The fish morphospace presented in figure 2A is represented here with each species colored by their elongation ratio (Fig. 1).High ratios represent elongate fish while low ratio represents deep bodied fishes. The PC1 and elongation vectors are also represented on this morphospace. Based on our resampling procedure, the small angle between these two vectors (14.35u) indicate that elongation is significantly associated to the main axis of shape diversification (p,0.001).
doi:10.1371/journal.pone.0112732.g005
Morphospace for Reef Fishes
[14], which appears to be different from the pattern in a number of other fish clades [5]. These results indicate the potential for head morphology to evolve independently from the postcranial region. Our results are consistent with the presence of three distinct body regions in fishes, and emphasize the diversity of changes that can happen in these three regions, particularly between the head and the postcranial regions (dimension 2, Fig. 7A). Furthermore, the variation in change among these three body regions in our sample of reef fishes is broadly consistent with patterns that have been found in a wide range of vertebrate groups [1,50–53].
Changes in the relative length of the trunk and caudal regions is likely to frequently correspond to changes in the number of vertebrae found in each body region [5]. Families that have low scores on principal coordinate 1, such as Labridae, probably have a stable or proportional number of vertebrae in the trunk and caudal regions, while families with high scores on the first axis, such as Pempheridae and Bythidae, may show non-proportional changes in the number of vertebrae across species between the trunk and caudal region (Fig. 7A). Of course, this prediction relies on the assumption that the relative size of the trunk and caudal regions is based on differences in vertebrae number rather than a change in vertebrae length, an assumption previously confirmed in several fish groups [5,14].
Functional consequences of the elongation axis
The dominance of an axis of body elongation in our Indo-Pacific reef fish sample raises the question of why this axis of change is so important. What are the functional consequences of changing body elongation along this axis? Perhaps the most striking pattern is that ecological and habitat diversity found at each end of this shape axis is extremely high. There are no rigid
associations between body elongation and habitat or trophic mode. For example, there are elongate taxa that are benthic (e.g. some members of Synodontidae, Gobiesocidae, Blenniidae, Gobiidae), others that are midwater (e.g. some Blenniidae, Syngnathidae) and still others are surface dwellers (e.g. Belonidae, Hemirhamphidae). It appears that depending on the circumstanc-es, elongation may be an adaptation to a more benthic lifestyle (e.g. Callionymidae, Synodontidae) or it may be an adaptation to a more open-water lifestyle (e.g. the transition from lutjanids to caesionids). A number of studies of the consequences of more subtle changes in body shape have shown that changes to a more slender-bodied form accompany increases in steady swimming performance (reviewed in [54]). Thus, lineages employing axial undulation to propel themselves can be expected to become more elongate when they adopt a lifestyle of more active swimming in the water column.
At the other extreme on the axis of elongation are deep-bodied fish. A large number of these have small mouths and are specialized to feed by biting the benthos (e.g. Chaetodontidae, Acanthuridae, Pomacanthidae). Being deep-bodied with well-developed dorsal and anal spines, these fish gain considerable protection from gape-limited predators such as many serranids, carangids, and lutjanids. Although the association has not been thoroughly explored in the literature, our impression is that several species-rich groups of fishes in our sample show a trend within the family of more benthic-associated species being more deep-bodied (e.g. Sparidae, Haemulidae, Lutjanidae, Lethrinidae, Nemipter-idae, PomacentrNemipter-idae, AcanthurNemipter-idae, Pomacanthidae). One tradi-tional explanation for such a pattern is that deep-bodied fish may be at an advantage in unsteady locomotion, particularly with maneuverability [55,56]. Both fast-start performance [54] and maneuverability are thought to be enhanced by a body form that Figure 6. A majority of families (66%) have their main axis of shape variation strongly associated to elongation.The angles between PC1 and elongation vectors presented in figure 4 are presented here for each family on the y axis. The percentage of shape variation explained by elongation for each family is represented by the color of the bar (colors legend on the right). The significance of the association between PC1 and pure elongation is represented by the stars above bars (*p,0.05, **p,0.01, ***p,0.001).+represents the poorly sampled taxa (,20% of total accepted number of species),++represent taxa with less than 10 species sampled and#represent families poorly sampled and with less than 10 species.
provides increased lateral area for propulsion during fast starts, and where the fins are further away from the center of mass and thus provide greater mechanical advantage during turning maneuvers [57]. These advantages may be especially valuable to
fish that propel themselves with lateral undulations of the axial column and are in close proximity to the physically complex reef. It is possible that evolutionary movement up and down the axis of Figure 7. The two first axes of a principal coordinate analysis (PCoA) conducted on differences in orientation of the first PC for each of the 56 families with a representation of the deformation associated for each corners (A).The first principal component of shape was extracted for each family (Fig. 2). Then, the pairwise angles among the different families PC1 were used as a metric to quantify similarities in shape change among families. Finally a principal coordinate analysis was used to visualize similarity among families in the primary axis of body shape change. Families that fall close together in this analysis express similar patterns of shape change on their family-specific PC1. Colors represent the variance explained by PC1 for each family and the numbers inside each symbol corresponds to the family names listed in Table 1. Barplots reveal a bimodal distribution of families on the first axis. Examples of family changes along their first PC are represented for the four corners (B). It is important to note that the position of the poorly sampled families may change if sample size increase (This concern families 4, 6, 7, 9, 15, 16, 17, 18, 20, 25, 35, 47, 49, 50, 52 and 56).
doi:10.1371/journal.pone.0112732.g007
Morphospace for Reef Fishes
body elongation is often associated with life-style changes that take advantage of the locomotion consequences of body shape.
Body elongation also has implications for feeding mechanisms. For taxa that depend on suction feeding, the deep-bodied shape typically reflects a greater cross-sectional area of epaxial muscu-lature attaching to the back of the neurocranium [58]. This is an important determinant of the magnitude of suction pressure that a fish can generate when feeding [59,60], indicating that evolution-ary changes to a more deep-bodied shape often involve an increase in the capacity to generate suction pressure when feeding.
The nature of the internal basis of changes in body elongation has functional implications. As the body elongates this may be accompanied by proportional elongation of individual vertebrae or by increasing the number of vertebrae in the axial column [5,13]. Elongate fish with many vertebrae tend to be highly flexible, while species with fewer and elongate vertebrae tend to be stiffer in lateral bending [61,62]. One common feature of highly elongate forms with many vertebrae is a fossorial lifestyle, living among rocks or within sand or mud. This lifestyle is characteristic of moray eels and some temperate shoreline gobies, neither of which were sampled in our study. While we did not make internal measurements of skeletal elements in our study our unpublished observations suggest that members of Belonidae, Hemirhamphi-dae, and within GobiiHemirhamphi-dae,Ptereleotrisare all elongate taxa with elongate vertebrae. These taxa have relatively stiff bodies and we suggest they maintain the capacity for high performance swimming by lateral undulation.
Conclusions
Although reef fishes are tremendously diverse in body shape, 32% of the variation in form can be attributed to changes in elongation. The dominance of elongation emerges from a pattern that is seen both across the full range of our sample of 2939 species and within two-thirds of the families we studied. Shape variation along this axis has known consequences for locomotion and feeding performance, but associations with habitat use and trophic
patterns are characterized by a very loose fit between body shape and niche. In other words, for a given body elongation, reef fishes exhibit astonishing ecological diversity. This apparent many-to-one mapping of body elongation to ecological niche suggests that extraordinary shape diversity of teleosts might not only be a consequence of the great age of their lineage, but could result from a combination of flexibility in developmental processes and the presence of many adaptive solutions to the challenges presented in their environment.
Supporting Information
File S1 R functions to calculate angles between PC1 and the axis of maximum elongation based on elongation ratio of each species; it could be any other continuous variable associated with each species, such as swim-ming speed or geographical gradient. The function combines PCA and RDA. The code includes a function to calculate the angle and another function to test whether PC1 is significantly associated to the axis of maximum elongation using permutation.
(TXT)
Acknowledgments
We would like to thank C. Oufiero, T. Nguyen, L. Pan, N. Maheshwari, Y. Yu for their help with data collection, M. Zelditch and D. Adams for discussions about methods, and especially Dr. Jack Randall for making so many photographs of reef fishes publically available.
Author Contributions
Analyzed the data: TC. Wrote the paper: TC PCW. Collected part of the data, verified data collected by the students acknowledged in the manuscript and wrote the manuscript: TC. Conceived the conceptual ideas, funded the study, participated in its design and helped to draft the manuscript: PCW.
References
1. Collar DC, Reynaga CM, Ward AB, Mehta RS (2013) A revised metric for quantifying body shape in vertebrates. Zoology 116: 246–257.
2. Bergmann PJ, Irschick DJ (2011) Vertebral evolution and the diversification of squamate reptiles. Evolution 66: 1044–1058.
3. Friedman M (2010) Explosive morphological diversification of spiny-finned teleost fishes in the aftermath of the end-Cretaceous extinction. Proc R Soc Lond B 277: 1675–1683.
4. Sallan LC, Friedman M (2012) Heads or tails: staged diversification in vertebrate evolutionary radiations. Proc R Soc Lond B 279: 2025–2032.
5. Ward AB, Brainerd EL (2007) Evolution of axial patterning in elongate fishes. Biol J Linnean Soc 90: 97–116.
6. Eschmeyer WN (2012) Catalog of Fishes. California Academy of Science. 7. Aguilar-Medrano R (2013) Body shape evolution of Chromis and Azurina
species (Perciformes, Pomacentridae) of the eastern Pacific. Animal Biology 63: 217–232.
8. Cooper WJ, Westneat MW (2009) Form and function of damselfish skulls: rapid and repeated evolution into a limited number of trophic niches. BMC Evolutionary Biology 9: 24.
9. Fre´de´rich B, Vandewalle P (2011) Bipartite life cycle of coral reef fishes promotes increasing shape disparity of the head skeleton during ontogeny: an example from damselfishes (Pomacentridae). BMC Evolutionary Biology 11: 82. 10. Fre´de´rich B, Sorenson L, Santini F, Slater GJ, Alfaro ME (2013) Iterative
ecological radiation and convergence during the evolutionary history of damselfishes (Pomacentridae). Am Nat 181: 94–113.
11. Dornburg A, Sidlauskas B, Santini F, Sorenson L, Near TJ, et al. (2011) The influence of an innovative locomotor strategy on the phenotypic diversification of triggerfish (family: Balistidae). Evolution 65: 1912–1926.
12. Lopez-Fernandez H, Arbour JH, Winemiller KO, Honeycutt RL (2013) Testing for ancient adaptative radiations in neotropical cichlid fishes. Evolution 67: 1321–1337.
13. Mehta RS, Ward AB, Alfaro ME, Wainwright PC (2010) Elongation of the body in eels. Integr Comp Biol 50: 1091–1105.
14. Reece JS, Mehta RS (2013) Evolutionary history of elongation and maximum body length in moray eels (Anguilliformes: Muraenidae). Biol J Linnean Soc. 109: 861–875.
15. Price SA, Holzman R, Near TJ, Wainwright PC (2011) Coral reefs promote the evolution of morphological diversity and ecological novelty in labrid fishes. Ecol Lett 14: 462–469.
16. Kusche H, Recknagel H, Elmer KR, Meyer A (2014) Crater lake cichlids individually specialize along the benthic-limnetic axis. Ecology and Evolution 4: 1127–1139.
17. Ward AB, Mehta RS (2014) Differential occupation of axial morphospace. Zoology 117: 70–76.
18. Betancur RR, Broughton RE, Wiley EO, Carpenter K, Lo´pez JA, et al. (2013) The tree of life and a new classification of bony fishes. Plos Currents Tree of Life: doi: 10.1371/currents.tol.1353ba26640df26640ccaee26675bb26165c26648c26288. 19. Near TJ, Dornburg A, Eytan RI, Keck BP, Smith WL, et al. (2013) Phylogeny
and tempo of diversification in the superradiation of spiny-rayed fishes. Proc Natl Acad Sci U S A early edition: 1–6.
20. Price SA, Tavera JJ, Near TJ, Wainwright PC (2012) Elevated rates of morphological and functional diversification in reef-dwelling heamulid fishes. Evolution 67: 417–428.
21. Price SA, Schmitz L, Oufiero CE, Eytan RI, Dornburg A, et al. (2014) Two waves of niche-filling straddling the K-Pg boundary formed the modern reef fish fauna. Proceedings of the Royal Society, Series B. 281:UNSP:20140321. 22. Santini F, Nguyen MTT, Sorenson L, Waltzek TB, Lynch-Alfaro JW, et al.
(2013) Do habitat shifts drive diversification in teleost fishes? An example from pufferfishes (Tetraodontidae). J Evol Biol 26: 1003–1018.
23. Smith WL, Craig MT (2007) Casting the percomorph net widely: The importance of broad taxonomic sampling in the search for the placement of serranid and percid fishes. Copeia 1: 35–55.
sequences, with comments on the taxonomic position of the Caesioninae. Mol Phylogenet Evol 44: 450–460.
25. Smith WL (2005) The limits and relationships of mail-cheeked fishes (Teleostei: Percomorpha) and the evolution of venom in fishes. New York, NY: Columbia University.
26. Kazancioglu E, Near TJ, Hanel R, Wainwright PC (2009) Influence of sexual selection and feeding functional morphology on diversification rate of parrot-fishes (Scaridae). Proc R Soc Lond B 276: 3439–3446.
27. Alfaro ME, Brock CD, Banbury B, Wainwright PC (2009) Does evolutionary innovation in pharyngeal jaws lead to rapid lineage diversification in labrid fishes? BMC Evolutionary Biology 9: 1: 14.
28. Thacker CE, Roje DM (2011) Phylogeny of Gobiidae and identification of gobiid lineages. Systematics and Biodiversity 9: 329–347.
29. Thacker CE (2009) Phylogeny of Gobioidei and placement within Acantho-morpha, with a new classification and investigation of diversification and character evolution. Copeia 1: 93–104.
30. Mitterœcker P, Gunz P (2009) Advances in geometric morphometrics. Evol Biol 36: 235–247.
31. Rohlf FJ (2005) TpsDig2, Digitize Landmarks and Outlines. Stony Brook, NY: Department of Ecology and Evolution, State University of New York at Stony Brook.
32. Zelditch ML, Swiderski DL, Sheets HD, Fink WL (2004) Geometric Morphometrics for Biologists: A Primer. New York: Elsevier Academic Press. 443 p.
33. Rohlf FJ, Slice D (1990) Extensions of the Procrustes method for the optimal superimposition of landmarks. Systematic Zoology 39: 40–59.
34. Bookstein FL (1991) Morphometric tools for landmark data, geometry and biology. Cambridge: Cambridge University Press. 435 p.
35. R Development Core Team (2009) R: A language and environment for statistical computing. Vienna, Austria: R Foundation for Statistical Computing. 36. Marcus LF, Hingst-Zaher E, Zaher H (2000) Application of landmark morphometrics to skulls representing the orders of living mammals. Hystrix 11: 27–47.
37. Rohlf FJ (2003) TpsSmall. Stony Brook, NY: Department of Ecology and Evolution, State University of New York at Stony Brook.
38. Jackson DA (1993) Stopping rules in principal components analysis: a comparison of heuristical and statistical approaches. Ecology 74: 2204–2214. 39. Legendre P, Legendre L (1998) Numerical Ecology. Amsterdam: Elsevier
Science.
40. Borcard D, Gillet F, Legendre P (2011) Numerical ecology with R. New York, USA: Springer. 306 p.
41. Nelson JS (2006) Fishes of the world. Hoboken, New Jersey: John Wiley & Sons, Inc. 601 p.
42. Wainwright PC (2007) Functional versus morphological diversity in macroevo-lution. Ann Rev Ecol Syst 38: 381–401.
43. Wainwright PC, Bellwood DR, Westneat MW, Grubich JR, Hoey AS (2004) A functional morphospace for skull of labrid fishes: patterns of diversity in a complex biomechanical system. Biol J Linnean Soc 82: 1–25.
44. Wainwright PC, Carroll AM, Collar DC, Day SW, Higham TE, et al. (2007) Suction feeding mechanics, performance, and diversity in fishes. Integr Comp Biol 47: 96–106.
45. Oufiero CE, Holzman RA, Young FA, Wainwright PC (2012) New insights from serranid fishes on the role of trade-offs in suction-feeding diversification. J Exp Biol 215: 3845–3855.
46. Hulsey CD, Wainwright PC (2002) Projecting mechanics into morphospace: disparity in the feeding system of labrid fishes. Proc R Soc Lond B 269: 317– 326.
47. Westneat MW (2004) Evolution of levers and linkages in the feeding mechanisms of fishes. Intergrative and Comparative Biology 44: 378–389.
48. Claverie T, Patek SN (2013) Modularity and rates of evolutionary change in a power-amplified prey capture system. Evolution 67: 3191–3207.
49. Klingenberg CP (2008) Morphological integration and developmental modu-larity. Annu Rev Ecol Evol Syst 39: 115–132.
50. Polly PD, Head JJ, Cohn MJ (2001) Testing modularity and dissociation: the evolution of regional proportions in snakes. In: M. L . Zelditch, editor editors. Beyond heterochrony: the evolution of development. New York, NY: Wiley-Liss. pp. 305–335.
51. Wiens JJ, Slingluff JL (2001) How lizards turn into snakes: a phylogenetic analysis of body-form evolution in anguid lizards. Evolution 55: 2303–2318. 52. Narita Y, Kuratani S (2005) Evolution of the vertebral formulae in mammals: a
perspective on developmental constraints. J Exp Zool Part B 304B: 91–106. 53. Liem KF, Bemis WE, Walker WFJ, Grande L (2001) Functional anatomy of the
vertebrates: an evolutionary perspective. Belmont, CA: Thomson Brooks/Cole. 54. Langerhans RB (2008) Predicatbility of phenotypic differentiation across flow
regimes in fishes. Integr Comp Biol 48: 750–768.
55. Ellerby DJ, Gerry SP (2011) Sympatric divergence and performance trade-offs of bluegill ecomorphs. Evol Biol 38: 422–433.
56. Webb PW (1984) Body form, locomotion and foraging in aquatic vertebrates. Am Nat 24: 107–120.
57. Gerry SP, Robbins A, Ellerby DJ (2012) Variation in fast-start performance within a population of polyphenic bluegill (Lepomis macrochirus). Physiol Biochem Zool 85: 694–703.
58. Holzman R, Collar DC, Mehta RS, Wainwright PC (2012) An integrative modeling approach to elucidate suction-feeding performance. J Exp Biol 215: 1– 13.
59. Carroll AM, Wainwright PC, Huskey SH, Collar DC, Turingan RG (2004) Morphology predicts suction feeding performance in centrarchid fishes. J Exp Biol 207: 3873–3881.
60. Collar DC, Wainwright PC (2006) Discordance between morphological and mechanical diversity in the feeding mechanism of centrarchid fishes. Evolution 60: 2575–2584.
61. Brainerd EL, Patek SN (1998) Vertebral column morphology, C-start curvature, and the evolution of mechanical defenses in Tetraodontiform fishes. Copeia 4: 971–984.
62. Yamada T, Sugiyama T, Tamaki N, Kawakita A, Kato M (2009) Adaptive radiation of gobies in the interstitial habitats of gravel beaches accompanied by body elongation and excessive vertebral segmentation. BMC Evolutionary Biology 9: 145.
Morphospace for Reef Fishes
![Table 1. Families included in the present study with numbers of species sampled and the number of species recognized in each family by the catalog of fishes [6].](https://thumb-eu.123doks.com/thumbv2/123dok_br/18306415.348268/3.1186.96.1101.118.707/families-included-present-numbers-species-sampled-species-recognized.webp)