Genotype by environment interaction in Nelore cattle
from five Brazilian states
Iara Del Pilar Solar Diaz
1, Henrique Nunes de Oliveira
1, Luis Antônio Framartino Bezerra
2and Raysildo Barbosa Lôbo
21
Departamento de Genética e Melhoramento Animal, Faculdade de Ciências Agrárias e Veterinárias,
Universidade Estadual Paulista “Júlio de Mesquita Filho”, Jaboticabal, SP, Brazil.
2
Faculdade de Medicina de Ribeirão Preto, Universidade de São Paulo, Ribeirão Preto, SP, Brazil
Abstract
Records from 75,941 Nelore cattle were used to determine the importance of genotype by environment interaction (GEI) in five Brazilian states. (Co)variance components were estimated by single-trait analysis (with yearling weight, W450, considered to be the same trait in all states) and multiple-trait analysis (with the record from each state consid-ered to be a different trait). The direct heritability estimates for yearling weight were 0.51, 0.39, 0.44, 0.37 and 0.41 in the states of Goiás, Mato Grosso, São Paulo, Mato Grosso do Sul and Minas Gerais, respectively. The across-state genetic correlation estimates between Goiás and Mato Grosso, Goiás and Minas Gerais, São Paulo and Minas Gerais, and Mato Grosso do Sul and Minas Gerais ranged from 0.67 to 0.75. These estimates indicate that GEIs are biologically important. No interactions were observed between Goiás and São Paulo, Goiás and Mato Grosso do Sul, Mato Grosso and São Paulo, Mato Grosso and Mato Grosso do Sul, Mato Grosso and Minas Gerais, or São Paulo and Mato Grosso do Sul (0.82 to 0.97). Comparison of single and multiple-trait analyses showed that selection based on the former was less efficient in the presence of GEI, with substantial losses (up to 10%) during selection.
Key words:Bayesian inference, beef cattle, genetic correlation. Received: September 29, 2010; Accepted: February 21, 2011.
Introduction
Traits to be used in genetic evaluation programs are mainly chosen based on their economic importance in rela-tion to current market trends. However, the emphasis given to each trait needs to be adjusted by taking into account not only specific market situations, but also ecoregional condi-tions. In the case of Brazil, which is characterized by vastly different environmental conditions among its various geo-graphic regions, separate regional evaluations may be nec-essary so that differences between regions do not interfere with the genetic gain in animal breeding. In this context, ge-notype-environment interactions (GEI) are an important phenomenon in livestock breeding. The challenge is to identify the genotypes and environments in which GEI is large enough to be of economic and biological importance (Pégoloet al., 2009).
Livestock production is influenced by the combined action of genetic and environmental factors. It is therefore
essential to evaluate the isolated effects and combination of factors that affect traits such as weight and weight gain measured at different ages in genetic breeding programs. Yearling weight is of particular importance in this regard since it is the last recording done by most breeders of selec-tion herds before the sale of reproducers; yearling weight is also the weight closest to slaughter weight, and conse-quently shows the highest correlation with the latter.
Some investigators have used genetic correlations to compare the importance of GEI among regions in Nelore cattle. Genetic correlations ranged from 0.60 to 0.90 and heritability estimates for yearling weight ranged from 0.30 to 0.61 (Toralet al., 2004; Ribeiroet al., 2007; Lopeset al., 2008). These values demonstrate the variability of this trait in GEI studies according to the environment investigated. However, few studies in the Brazilian literature have inves-tigated the influence of GEI on economically important traits used in breeding programs.
In this study, single and multiple-trait analyses based on Bayesian inference were used to estimate heritabilities and genetic correlations for yearling weight in Nelore cat-tle. Specifically, we investigated GEI in five Brazilian www.sbg.org.br
Send correspondence to Iara Del Pilar. Departamento de Zoo-tecnia, Faculdade de Ciências Agrárias e Veterinárias, Univer-sidade Estadual Paulista “Júlio de Mesquita Filho”, Jaboticabal, Via de Acesso Prof. Paulo Donato Castellane s/n, 14884-900 Jabo-ticabal, SP, Brazil. E-mail: [email protected].
states and assessed its effect on the average breeding value of selected animals.
Material and Methods
Records of yearling weight (W450) from 99,366 Ne-lore animals born between 1991 and 2006 were analyzed. The data were obtained from six Brazilian states (Goiás, Mato Grosso, Mato Grosso do Sul, Minas Gerais, Paraná and São Paulo) participating in the Nelore Cattle Breeding Program (PMGRN) coordinated by the National Associa-tion of Breeders and Researchers (ANCP). However, only animals from five states (excluding Paraná) and raised ex-clusively on pasture were included in the analyses. Four birth or weight recording seasons were defined as follows: season 1 (January to March), season 2 (April to June), sea-son 3 (July to September) and seasea-son 4 (October to Decem-ber). The number of sires present in each state and the common number of sires in two states are shown in Table 1. The GLM procedure (SAS, 2008) was used to form the contemporary groups. The contemporary group for which the model yielded the highest coefficient of determi-nation for yearling weight consisted of the farm of weight recording, farm of origin, year of birth, season of birth, sex and management. Contemporary groups with fewer than nine observations and weight records that were outside the range given by the contemporary group mean plus or minus three standard deviations (SD) were excluded. The number of herds and structure after consistency of the data file for W450 per state analyzed are shown in Table 2.
(Co)variance components were estimated using the gibbs2f90 software (Misztal, 2008) by single-trait analysis
(in which W450 was considered to be the same trait in all states) and multiple-trait analysis (in which the record from each state was considered to be a different trait). The analy-sis model included contemporary groups as fixed effects, additive genetic effects and residual effects. The mathemat-ical description of the general model used was:
y=Xb+Zu+e
whereyis the vector of observations,XandZare incidence matrices relatingbanduto the observations,bis the vector of fixed effects,uis the vector of direct genetic additive ef-fects, andeis the vector of residual effects.
For the model, it was assumed that:
y u e
MNV
X ZAZ G R I G ZA R I
A é ë ê ê ê ù û ú ú ú é ë ê ê ê ù û ú ú ú
Ä + Ä Ä Ä
~ ,
'
b
0 0
Z G G A
R I R I
'Ä Ä
Ä Ä é ë ê ê ê ù û ú ú ú ì í ï î ï ü ý ï þ ï 0 0
whereAis the additive numerator relationship matrix,Iis an identity matrix,Gis the additive genetic covariance ma-trix 5x5,Ris a residual diagonal matrix, andÄdenotes the direct product between matrices.
Vectorsbandu are location parameters of a condi-tional distributiony|b,u. A uniform distribution was as-sumed as ana prioridistribution forb, which reflects vague prior knowledge about this vector. A multivariate normal distribution was assumed as ana prioridistribution foru, with a mean of 0 and variances2aAandGÄAfor single-and multiple-trait analyses, respectively. For the other components, Wishart and inverted chi-square distributions were assumed asa priori distributions for multiple- and
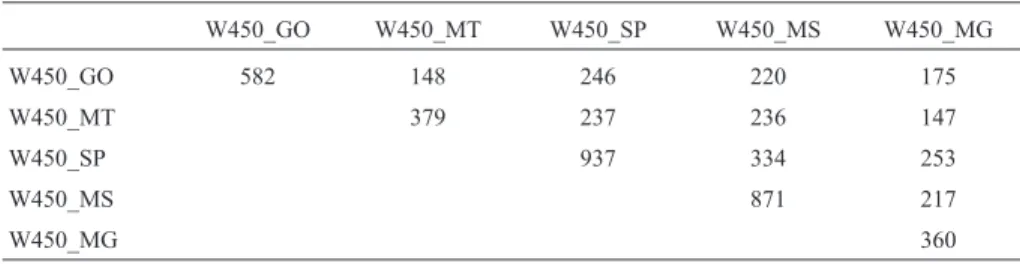
Table 1- Numbers of sires in each state (diagonal) and common in two states (above diagonal).
W450_GO W450_MT W450_SP W450_MS W450_MG
W450_GO 582 148 246 220 175
W450_MT 379 237 236 147
W450_SP 937 334 253
W450_MS 871 217
W450_MG 360
GO - Goiás, MG - Minas Gerais, MS - Mato Grosso do Sul, MT - Mato Grosso, SP - São Paulo.
Table 2- Number of herds, observations, average weight±standard deviations and coefficient of variation (CV) for yearling weight (W450) from five Brazilian states.
State No. of herds No. of observations Average weight (kg) CV (%)
Goiás 44 16,011 254±39 15.5
Mato Grosso 6 10,637 260±40 15.5
São Paulo 29 19,777 280±47 16.6
Mato Grosso do Sul 24 22,408 268±46 17.3
Minas Gerais 15 7,108 288±51 17.7
single-trait analyses, respectively (Van Tassel and Van Vleck, 1996).
A pedigree file containing the identification of each animal, sire and dam was used in all analyses, with a total of 149,002 animals in the relationship matrix when all avail-able relationships were considered (up to 11 generations).
Gibbs chains of 1,012,900 and 1,040,000 cycles were generated for single- and multiple-trait analyses, respec-tively, with a burn-in period of 50,000 cycles and a sam-pling interval of 100 cycles. The chains generated were then analyzed using the Gibanal software (Van Kaam, 1998) to determine the convergence of the chains and de-pendence among samples. GEI was estimated by genetic correlation between yearling weights in different states, with values < 0.80 indicating an important interaction.
On the basis of the mean (co)variance components obtained by single- and multiple-trait analyses, the animals were classified according to breeding values by best linear unbiased prediction (BLUP) using the blupf90 software de-veloped by Misztal (2008). Thus, five breeding values were obtained for each animal, one for each state (BVGO, BVMT, BVSP, BVMS and BVMG). For single-trait analy-sis, breeding values in which yearling weight was consid-ered to be the same trait (BVuni) were obtained, regardless of the state where the animal was reared.
To determine the influence of GEI on selection, the responses to selection were compared by considering the trait to be different or not different in the five states. Two selection scenarios were simulated, with the proportion of selected animals ranging from 1 to 10%. In the first sce-nario, the animals were selected based on breeding values obtained by single-trait analysis (BVuni). In the second scenario, the animals were selected based on the breeding value of each state (BVSP, BVMT, BVGO, BVMS and BVMG). The average breeding value of each state was then calculated for the selected animals and the mean values were compared. Only male animals born in 2005 (the last year during which the complete calving season was re-corded) were used for this comparison.
Results and Discussion
Table 2 shows that there were wide variations in the mean yearling weight and standard deviation among the states. These differences may reflect the influence of fac-tors such as genetic variation among herds, although most of the differences were probably attributable to the environ-ment in which the animals were reared. This variation re-sults in different estimates of the (co)variance components and, consequently, differences in the genetic parameter es-timates (Carneiroet al., 2008).
In Bayesian inference, when Monte Carlo Markov Chain methods are used to obtain the posterior distribution of the samples the convergence of the chains must be en-sured since, if the samples are not generated from a station-ary posterior distribution, the inferences will not be valid.
In the present study, the burn-in period (50,000 samples) used for the two analyses was adequate to ensure conver-gence of the chains.
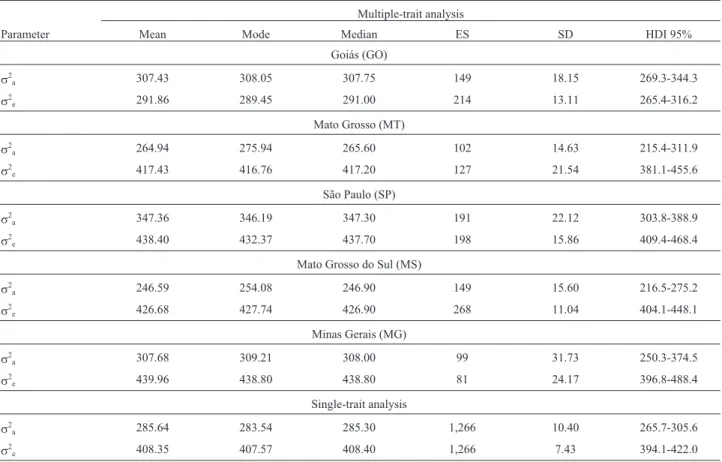
The effective sample size was small, ranging from 81 to 268 (Table 3), despite the generation of 990,000 samples from the stationary distribution. This finding indicated a high dependence among samples. Although a small effec-tive sample size impairs inferences at extreme values of pa-rameter distributions, the measures of central tendency are generally reliable. In this study, similar measures of central tendency were obtained for the different states.
As indicated by the estimates shown in Table 3, Goiás was generally the only state in which the residual variance was lower than the additive genetic variance. With respect to additive genetic variance, São Paulo showed the highest estimate, followed by the states of Minas Gerais and Goiás. Figure 1 shows the posterior distributions of additive ge-netic variance for all of the states.
Examination of this graph allowed us to infer, based on the intersection of densities, that genetic variance was higher in the state of São Paulo than in Mato Grosso and Mato Grosso do Sul, whereas genetic variance was lower in Mato Grosso do Sul than in Goiás. The finding that genetic variance differed among states may indicate that genotypes react differently to different environments, a fact implying the existence of GEI. This is the case, for example, in states where the quality of pasture was on average better and the difference in animal weight was more evident. Barwicket al. (2009) also demonstrated a difference in the perfor-mance of beef cattle when the animals were exposed to dif-ferent types and qualities of pasture. These differences in genetic variances among states may also reflect the fact that although there is a connection between the groups in all states there may be differences between states with regard to training of the breed. Practically all of the Nelore cattle in Brazil have been obtained through crossbreeding in a pro-cess that is ongoing, so it is likely that the proportion of herds is higher in those states where the absorption pro-cesses are more recent; this phenomenon may contribute to the differences in genetic variances.
The posterior distributions of residual variances and their descriptive statistics are shown in Figure 2 and Table 3, respectively. The lowest residual variances were observed for the state of Goiás, whereas the other states had similar distributions. A lower residual variance may indi-cate less environmental variation and greater care and reli-ability in data collection. On the other hand, lower residual variance may also be caused by an increased response of certain genotypes to some specific environment within the states,i.e., there would be a GEI.
The heterogeneity of residual variance also reduces genetic gain when the selection intensity applied is high. A greater selection of animals from states with higher residual variance is not desirable since, in practice, animals from states with less “controlled” environmental effects would benefit.
In phenotype selection, when the heterogeneity of variance is ignored and the intensity of selection is high there is a tendency to select more animals from herds with greater variance since animals with more extreme values are found in these flocks. In the case of selection based on
Table 3- Descriptive statistics of posterior distributions from variance components for yearling weight (W450) in five Brazilian states (multi-trait) and in five states together (single-trait).
Multiple-trait analysis
Parameter Mean Mode Median ES SD HDI 95%
Goiás (GO)
s2
a 307.43 308.05 307.75 149 18.15 269.3-344.3
s2
e 291.86 289.45 291.00 214 13.11 265.4-316.2
Mato Grosso (MT)
s2
a 264.94 275.94 265.60 102 14.63 215.4-311.9
s2
e 417.43 416.76 417.20 127 21.54 381.1-455.6
São Paulo (SP)
s2
a 347.36 346.19 347.30 191 22.12 303.8-388.9
s2
e 438.40 432.37 437.70 198 15.86 409.4-468.4
Mato Grosso do Sul (MS)
s2
a 246.59 254.08 246.90 149 15.60 216.5-275.2
s2
e 426.68 427.74 426.90 268 11.04 404.1-448.1
Minas Gerais (MG)
s2
a 307.68 309.21 308.00 99 31.73 250.3-374.5
s2
e 439.96 438.80 438.80 81 24.17 396.8-488.4
Single-trait analysis
s2
a 285.64 283.54 285.30 1,266 10.40 265.7-305.6
s2
e 408.35 407.57 408.40 1,266 7.43 394.1-422.0
s2
a- additive genetic variance,s2e- residual variance, ES - effective samples, HDI - high density interval and SD - standard deviation.
Figure 1- Posterior densities of genetic additive estimates (s2
a) for
year-ling weight from Goiás (GO), Mato Grosso (MT), Mato Grosso do Sul (MS), Minas Gerais (MG) and São Paulo (SP).
Figure 2- Posterior densities of residual variance (s2e) for yearling weight
parental information, data from herds with greater variation have greater weight in genetic evaluations.
The heritability estimates for yearling weight ranged from 0.37 to 0.51 in the regions analyzed (Table 4). These findings were consistent with the values reported for Ne-lore cattle as a whole, which range from 0.31 to 0.53 (Magnaboscoet al., 2000; Siqueiraet al., 2003; Fariaet al., 2007; Boligonet al., 2009). The highest heritability esti-mate among the five states was observed for the state of Goiás (Figure 3) and was a direct consequence of the lower residual variance.
The heritability estimates obtained for weight in the different states were moderate to high, indicating that a sub-stantial part of the variation in this trait among animals was attributable to differences in the genetic merit of the ani-mals. Thus, yearling weight should respond efficiently to individual selection in any of the states studied.
In a study of GEIs in three states, Ferreiraet al.(2001) reported a heritability estimate of 0.17 for yearling weight in a Nelore herd from Minas Gerais, a value much lower than that observed here. For the state of Mato Grosso do Sul, the estimated heritability (0.36) agreed with those of Toralet al.(2004) and Ribeiro (2006), who reported values ranging from 0.30 to 0.45 and from 0.31 to 0.48, respec-tively, for regions in Mato Grosso do Sul.
Although the different heritability estimates indicate variations in the genotype performance of animals from various regions, this difference only has practical conse-quences for selection when it changes the relative merit of the animals. This change will only occur when the interac-tion becomes important. In the present study, we applied the criterion of Robertson (1959),i.e., an interaction has an important effect when the genetic correlation between the same trait in two environments is less than 0.80.
Genotype-environment interactions were observed between the states of Goiás and Mato Grosso, Goiás and Minas Gerais, São Paulo and Minas Gerais, and Mato Grosso do Sul and Minas Gerais. Based on the results ob-tained, the phenotypic expression of the trait will be differ-ent in states where the genetic correlation was lower than 0.80 and should therefore be considered a distinct trait. No interaction was observed between Goiás and São Paulo, Goiás and Mato Grosso do Sul, Mato Grosso and São
Paulo, Mato Grosso and Mato Grosso do Sul, Mato Grosso and Minas Gerais, or São Paulo and Mato Grosso do Sul. These results suggest that most of the genes responsible for the expression of yearling weight act in a similar fashion in two different environments and that the response to selec-tion for the trait in one state will be similar to the response observed in another state.
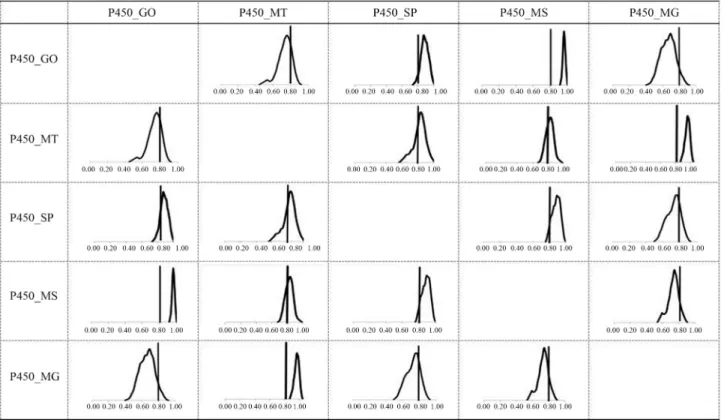
For a more detailed analysis, Figure 4 shows the pos-terior densities of the genetic correlation estimates for year-ling weight among the five states studied. The posterior distributions of the correlations involving the state of Mi-nas Gerais showed a small probability of being above 0.80 (except for that involving the state of Mato Grosso), whereas for the state of Mato Grosso a good portion of the distribution of genetic correlations with the weights in other states was above 0.80 (except for the state of Goiás). This finding indicates the existence of two groups of states where GEIs were more pronounced, namely, one in-cluding the states of Minas Gerais and Mato Grosso and the other including the states of Goiás, São Paulo and Mato Grosso do Sul. This finding also indicates that separate ge-netic evaluations of the two sets would be more interesting in terms of genetic progress. Within these groups, the corre-lations between states were high.
The lower genetic correlation estimates involving the state of Mato Grosso do Sul were consistent with the ge-netic correlations reported by Toral et al. (2004) for weights from birth to yearling in Nelore cattle among three homogeneous microregions in Mato Grosso do Sul.
Simi-Figure 3- Posterior densities of heritability estimates (h2) for yearling weight from Goiás (GO), Mato Grosso (MT), Mato Grosso do Sul (MS), Minas Gerais (MG) and São Paulo (SP).
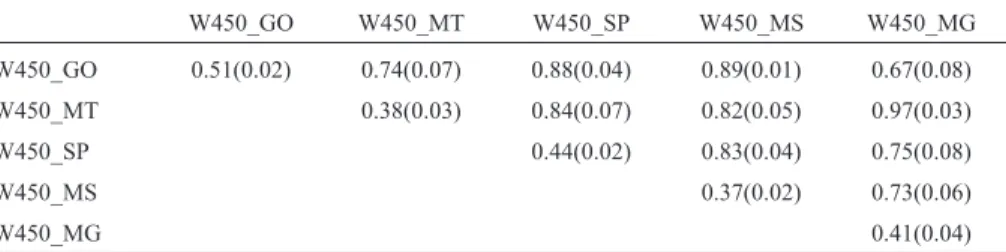
Table 4- Mean and standard deviations (in parentheses) of heritabilities (diagonal) and genetic correlations (above diagonal) for yearling weight in five Brazilian states.
W450_GO W450_MT W450_SP W450_MS W450_MG
W450_GO 0.51(0.02) 0.74(0.07) 0.88(0.04) 0.89(0.01) 0.67(0.08)
W450_MT 0.38(0.03) 0.84(0.07) 0.82(0.05) 0.97(0.03)
W450_SP 0.44(0.02) 0.83(0.04) 0.75(0.08)
W450_MS 0.37(0.02) 0.73(0.06)
W450_MG 0.41(0.04)
larly, Souzaet al.(2008) observed an effect of GEI only for postweaning traits between two regions in the state of Pará and Mato Grosso do Sul for Nelore animals.
Results similar to those of the present study have been reported by Ribeiroet al.(2007) who found no GEI be-tween the western region of São Paulo and Mato Grosso do Sul (0.82 to 1.00). Eleret al.(2000) found GEIs for pre-weaning and postpre-weaning weights in Nelore cattle reared on farms located in southeastern and midwestern Brazil, in agreement with the present study. However, Fridrichet al.
(2005) observed no interaction between these states, with a mean genetic correlation of 0.92 in Tabapuã cattle.
It was important to quantify the effect of GEIs on the selection of animals in the states where this interaction was observed since GEIs are not included in most breeding pro-grams. This was done by comparing the model that does not consider GEI (single-trait analysis) and with that which does (multiple-trait analysis) (Tables 5 and 6). The correla-tions between predicted breeding values obtained by sin-gle- and multiple-trait analyses were high for all states.
These correlations were higher than the genetic corre-lations between states since the data from all states were in-cluded in the single-trait model. This was a more realistic situation than the previous one since, if GEIs were ignored, data from all states would be collected and analyzed as a single trait. The genetic correlations reported above al-lowed prediction of the genetic gain in a state based on the
results of another state, in contrast to the situation studied previously using a model that considers GEI.
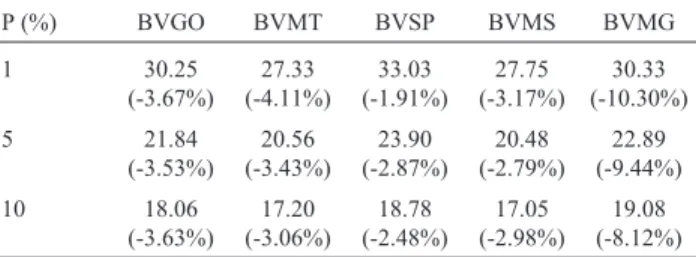
Table 6 shows the average breeding values of males born in 2005 when selected based on multiple-trait analysis (which considers GEI), and the percent reduction in these average values when selection was based on the results of single-trait analysis (which ignores GEI), according to the fraction selected. For animals from the state of Minas Gerais, the losses due to ignoring the effects of GEI may reach slightly more than 10% of the average breeding value of selected animals, whereas for the other states this loss was less important.
Figure 4- Posterior densities of genetic correlation estimates (above and below the diagonal). The line in the distributions marks the threshold for the im-portance of GEI (0.80) for W450 in the five states studied.
Table 5- Pearson correlation coefficients for breeding values of males born in 2005 for yearling weight obtained by single-trait and multiple-trait analyses.
BVuni BVGO BVMT BVSP BVMS BVMG
BVuni - 0.97 0.97 0.98 0.98 0.93
BVGO - - 0.94 0.97 0.98 0.87
BVMT - - - 0.96 0.95 0.96
BVSP - - - - 0.96 0.90
BVMS - - - 0.88
BVMG - - -
This result may reflect either changes in the classifi-cation of animals from different states, as demonstrated by the genetic correlation in multiple-trait analysis, or differ-ences in the variance (scaling) between states. However, since the change was more pronounced in the state of Minas Gerais, which had a genetic variance similar to the average of the other states, the first option seems more plausible.
Greater differences between predicted breeding val-ues were found in three situations when the intensity of se-lection was higher. This finding may be related to heteroge-neity in the variance observed for the states of Minas Gerais, Mato Grosso and Mato Grosso do Sul. Similar re-sults were reported by Carvalheiroet al.(2002) who evalu-ated the effect of residual heterogeneity on selection. These authors concluded that ignoring the heterogeneity of vari-ance led to a reduction in the response to selection when the intensity of selection was increased.
Despite evidence of a GEI between various pairs of states, the state of Minas Gerais was most influenced by the presence of this interaction. However, based on these re-sults and the fact that the use of single-trait analysis (which ignores the effect of GEI) led to substantial losses, we con-clude that the analysis chosen should consider the presence of GEI when this is evident,i.e., when genetic correlations of less than 0.80 are found. The multiple-trait model pro-vides more reliable estimates of breeding values because it considers both genetic and environmental differences among states, thereby reducing the bias of estimates. How-ever, the application of multiple-trait analysis results in higher costs than single-trait analysis.
The results of this study support the current concern regarding the presence of GEI and the best approach to deal with this event. Thus, it is not only important to evaluate the effect of this interaction on the classification of animals in different environments, but also to assess the effect of this change on the genetic gain of the population.
In conclusion, a GEI was observed for yearling weight between pairs of the states studied. Subsequent analysis identified two groups of states for genetic evalua-tion: the first included the states of Minas Gerais and Mato
Grosso, and the second included the states of Goiás, São Paulo and Mato Grosso do Sul. The effect of GEI on selec-tion was highest for the state of Minas Gerais. In genetic evaluations of yearling weight, analyses that consider the presence of GEI are preferable to those that do not include this interaction.
Acknowledgments
We thank the Associação Brasileira de Criadores e Pesquisadores (ANCP) for providing the data used in this study. I.D.P.S.D. was supported by a fellowship from Fun-dação de Amparo à Pesquisado do Estado de São Paulo (FAPESP).
References
Barwick SA, Johnston DJ, Burrow HM, Holroyd RG, Fordyce G, Wolcott ML, Sim WD and Sullivan MT (2009) Genetics of heifer performance in ‘wet’ and ‘dry’ seasons and their rela-tionships with steer performance in two tropical beef geno-types. Anim Prod Sci 49:367-382.
Boligon AA, Albuquerque LG, Mercadante MEZ and Lôbo RB (2009) Herdabilidades e correlações entre pesos do nasci-mento à idade adulta em rebanhos da raça Nelore. Rev Bras Zootecn 38:2320-2326 (Abstract in English).
Carneiro APS, Torres RA, Lopes RS and Euclyde F (2008) Hete-rogeneidade e avaliação genética em bovinos, estudo utili-zando dados simulados. Act Sci Anim Sci 30:113-119. Carvalheiro R, Fries LA, Schenkel FS and Albuquerque LG
(2002) Efeitos da heterogeneidade de variância residual en-tre grupos de contemporâneos na avaliação genética de bo-vinos de corte. Rev Bras Zootec 31:1680-1688 (Abstract in English).
Eler JP, Ferraz JBS, Golden BL and Pereira E (2000) Influência da interação touro x rebanho na estimação da correlação entre efeitos genéticos direto e materno em bovinos da raça Ne-lore. Rev Bras Zootec 29:1642-1648 (Abstract in English). Faria CU, Magnabosco CU, Reyes A, Lôbo RB, Bezerra LAF and
Sainz RD (2007) - inference in a quantitative genetic study of growth traits in Nelore cattle (Bos indicus). Genet Mol Biol 30:545-551.
Ferreira VCP, Penna VM, Bergmann JAG and Torres RA (2001) Interação genótipo - ambiente em algumas características produtivas de gado de corte no Brasil. Arq Bras Med Vet Zootec 53:385-392 (Abstract in English).
Fridrich AB, Silva MA, Fridrich D, Corrêa GSS, Silva LOC, Sakaguti ES, Ferreira IC and Valente BD (2005) Interação genótipo x ambiente e estimativas de parâmetros genéticos de características ponderais de bovinos Tabapuã. Arq Bras Med Vet Zootec 57:663-672 (Abstract in English). Lopes JS, Rorato PRN, Weber T, Boligon AA, Comin JG and
Dornelles MA (2008) Efeito da interação genótipo-ambiente sobre o peso ao nascimento, aos 205 e aos 550 dias de idade de bovinos da raça Nelore na região sul do Brasil. Rev Bras Zootec 37:54-60 (Abstract in English).
Magnabosco CDU, Lôbo RB and Famula TR (2000) Bayesian in-ference for genetic parameter estimation on growth traits for Nelore cattle in Brazil, using the Gibbs sampler. J Anim Breed Genet 117:169-188.
Table 6- Mean predicted genetic values for multiple-trait analysis when selection was done with 1%, 5% and 10% of the best males born in 2005, and the percentage reduction (in parentheses) when selection was done by single-trait analysis.
P (%) BVGO BVMT BVSP BVMS BVMG
1 30.25 (-3.67%) 27.33 (-4.11%) 33.03 (-1.91%) 27.75 (-3.17%) 30.33 (-10.30%) 5 21.84 (-3.53%) 20.56 (-3.43%) 23.90 (-2.87%) 20.48 (-2.79%) 22.89 (-9.44%) 10 18.06 (-3.63%) 17.20 (-3.06%) 18.78 (-2.48%) 17.05 (-2.98%) 19.08 (-8.12%)
Pégolo NT, Oliveira HN, Albuquerque LG, Bezerra LA and Lôbo RB (2009) Genotype by environment interaction for 450-day weight of Nelore cattle analyzed by reaction norm mod-els. Genet Mol Biol 32:281-287.
Ribeiro S, Eler JP, Balieiro JCC, Ferraz JBS, Pedrosa VB and Mattos EC (2007) Influência da interação genótipo x am-biente sobre características pós-desmama em bovinos da raça Nelore. Arq Bras Med Vet Zootec 14:72-80 (Abstract in English).
Robertson A (1959) The sampling variance of the genetic correla-tion coefficient. Biometrics 15:469-485.
Siqueira RLPG, Oliveira JA, Lôbo RB, Bezerra LAF and Tonhati H (2003) Análise da variabilidade genética aditiva de carac-terísticas de crescimento na raça Nelore. Rev Bras Zootec 32:99-105 (Abstract in English).
Souza JC, Silva LOC, Freitas JA, Malhado CHM, Gondo A, Ferraz Filho PB, Weaber RL and Lamberson WR (2008) Genotype x environmental interaction to Nellore cattle rai-sed in two Brazilian regions. J Anim Sci (E-Suppl 2) 86:205. SAS (2008) Statistical Analysis Systems - User's Guide: Version
6.11. SAS Institute Inc., Cary.
Toral FLB, Silva LOC, Martins EL, Gondo AS and Maria S (2004) Interação genótipo-ambiente em características de crescimento de bovinos da raça Nelore no Mato Grosso do Sul. Rev Bras Zootec 33:1445-1455 (Abstract in English). Van Kaam JBCHM (1998) “Gibanal” - Analyzing program for
Markov Chain Monte Carlo sequences, version 2.10. De-partment of Animal Science, Agricultural University of Wa-geningen, The Netherlands.
Van Tassel CP and Van Vleck LD (1996) Multiple-trait Gibbs sampler for animal models: Flexible programs for Bayesian and likelihood-based (co)variance component inference. J Anim Sci 74:2586-2597.
Internet Resources
Misztal I (2008) Family of Blupf90 programs. http://nce.ads.uga. edu/~ignacy/numpub/blupf90 (March 3, 2010).
Associate Editor: Bertram Brenig