A biogeographical population genetics perspective of the colonization
of cats in Latin America and temporal genetic changes
in Brazilian cat populations
Manuel Ruiz-García and Diana Alvarez
Departamento de Biología, Facultad de Ciencias, Pontificia Universidad Javeriana, Bogotá, Colombia.
Abstract
We used nine morphological genes to analyze cat populations from Mexico, the Dominican Republic, the Colombian, Brazilian and Peruvian Amazon, Bolivia and Brazil. Most populations were in Hardy-Weinberg equilibrium at the O lo-cus. The highest allele frequencies so far detected at world level for alleles I (inhibitor) and L (long hair) were found at La Paz (Bolivia). The analyses revealed at least five cat gene pools in Latin America: These findings suggest that the current genetic distribution of cats in Latin America correlates with the colonization of the Americas during the XIV to XVIII centuries. Additionally, the cat populations of São Paulo, Rio de Janeiro and Manaus were sampled, to com-pare their 1996-2003 genetic profiles with those obtained in 1983. Generally, these genetic profiles seem temporally stable, which is important for comparing cat populations sampled in different years and decades.
Key words:domestic cats, Latin American cats, population genetics, genetic changes. Received: October 1, 2007; Accepted: January 22, 2008.
Introduction
Since Searle (1949) published the first population ge-netics study on the domestic cats of London, more than 400 populations have been analyzed from a biogeographical population genetics perspective in different parts of the world, using coat characteristics and skeleton abnormali-ties. Multiple studies of cat populations have been con-ducted in Europe (Lloyd and Todd, 1989; Ruiz-Garcia, 1994, 1997) and North America (Shostell et al., 2005). Given the large number of studies devoted to cat population genetics, it is surprising that few studies have included in-formation about Latin America. The only Latin American cat populations studied before the 1990s included some populations from Mexico, Caracas (Venezuela), Willems-tadt (Curaçao), and 16 populations from Brazil (Todd etal., 1974, 1976; Watanabe, 1981, 1983).
Studies of Latin American cat populations with em-phasis on population genetics began in the 1990s and in-cluded the cities of Buenos Aires (Argentina) and Havana (Cuba), Bogota, Ibague, Bucaramanga, Cali, Popayan and Pasto (Colombia), San Jose (Costa Rica), Asunción (Para-guay) and Santiago (Chile) (Kajon et al., 1992; Ruiz-Garcia, 2000; Ruiz-Garcia and Alvarez, 1996, 1999, 2003; Ruiz-Garcia etal., 2002).
However, the recent Latin American study results have left a number of unanswered questions. We focused on cat populations from Acapulco, Mexico D.F., Veracruz, and La Heroica Alvarado (Mexico), Leticia (Colombia) and Tabatinga (Brazil) and neighboring small villages and communities (Colombian-Brazilian-Peruvian Amazon border), Santa Cruz de la Sierra and La Paz (Bolivia), Santo Domingo (Dominican Republic), and new samples from Rio de Janeiro, São Paulo and Manaus (Brazil), in order to resolve three main questions: 1) How many cat gene pools are there in Latin America? 2) If there are different cat gene pools in Latin America, how are they associated with hu-man migration events from Europe? 3) Are the genetic pro-files of the Latin American cat populations temporally stable? If the cat gene profiles are temporally stable, we can compare cat populations sampled in different years and de-cades in Latin America and in Europe. To bring new data to bear on the “Historical migration hypothesis” (Todd, 1977), it is important to determine whether the Latin Amer-ican cat genetic profiles were “frozen” at the moment or in the first years or decades after Europeans founded different cities in Latin America. If these genetic profiles are contin-uously changing, many of the comparisons between Latin American and European cat populations make no sense from a historical-genetic perspective, a fact that has not been previously determined for any Latin American cat population.
Send correspondence to Manuel Ruiz-García. Departamento de Biologia, Facultad de Ciencias, Pontificia Universidad Javeriana, CRA 7A n. 43-82, Bogota, Colombia. E-mail: mruiz@javeriana. edu.co.
Materials and Methods
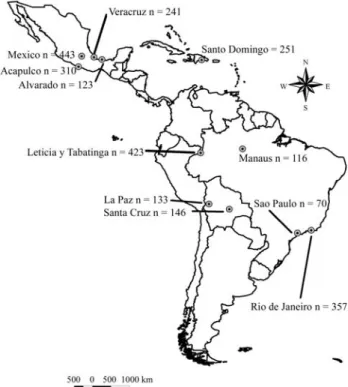
A total of 2613 domestic cats (Felis catus) were ana-lyzed from August 1996 to December 2003, sampled in populations of Acapulco (n = 310), Mexico D.F. (n = 443), Veracruz (n = 241), Alvarado (n = 123), Mexico; Santo Domingo (n = 251), Dominican Republic; Santa Cruz de la Sierra (n = 146) and La Paz (n = 133), Bolivia; Leticia, Co-lombia; and Tabatinga, Brazil (87% of the sample), and several neighboring villages and Indian communities (Puerto Nariño, Macedonia and Amacayacu National Park in Colombia, Benjamin Constant and Atalaya do Norte and other small villages of the Javarí River in Brazil, and Santa Rosa and Islandia in Peru) near the Colombian-Brazilian-Peruvian Amazon border (n = 423), plus some new samples from three Brazilian cities: Rio de Janeiro (n = 276 in 1996 and n = 81 in 1999; total n = 357); São Paulo (n = 70) and Manaus (n = 116) (Figure 1). The sampling design em-ployed consisted of scoring the phenotypes of cats ob-served in streets and houses of non-overlapping routes in several areas of each city, so as to survey a large section of each site. Cats from the Abandoned Animals Refuge and from the Center for Animal Protection were also screened in Mexico City. Each route was used only once, in order to avoid sampling the same animals twice. A large percentage of animals were sexed, and the sex ratios of these popula-tions were calculated.
In accordance with the Committee on Standardized Genetic Nomenclature for Cats (1968), the analyzed ge-netic characteristics were: sex-linked (O, o; Orange [epis-tatic for the observation of the A locus]vs.non-orange) and
the autosomal loci, A (A, a; Agoutivs.Non-agouti [epis-tatic for the T locus]), T (t+, tb, Ta; striped or mackerel tabby vs. blotched tabby vs. Abyssinian tabby), D (D, d; non-dilutionvs.dilution), L (L, l; short hairvs.Long hair), S (S, s; Piebald white spottingvs.non- white spotting), W (W, w; Dominant white [epistatic for the other colors]vs.normal color). Other loci analyzed were I (I, i; Inhibitor or “silver” vs.non-silver color) and C (C, cs; normal colorvs.Siamese pattern). The characteristics of these genes are described in Robinson (1977).
The frequency of the sex-linked allele was calculated from direct counts of surveyed cats that were sexed, and also estimated with the maximum-likelihood procedure (Robinson and Silson, 1969) for samples that were not sexed. A 1:1 sex ratio was assumed for non-sexed samples, using the equation p(O) = (2a+b)/2N, where a is the number of orange cats (O/O and O/-), b is the number of tortoise-shell females, or calico (O/o), and N is the total sample size for this locus. The direct and theoretical calculated sex ra-tios were compared using Robinson’s equation (1972): m = (4ac-b2)/((2a+b)(b+2c)), where c is the number of ani-mals that do not have the orange allele. Two versions of the chi-square test were used in the analysis of the Hardy-Weinberg equilibrium at the O locus. One test utilized the observed frequencies of the genotypes O/O (& O/-), O/o, and o/o (& o/-) in addition to the allele frequency calculated via the maximum likelihood method, assuming a sex ratio of 1:1. The second test utilized only the genotypes of the sexed female cats (O/O, O/o, & o/o).
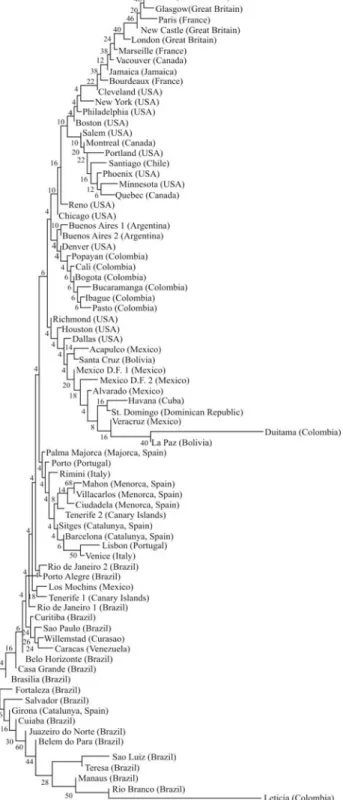
To establish the genetic relationships between the cat populations reported here and other cat populations, a group composed of 78 American and European cat popula-tions was analyzed. The European populapopula-tions selected may have been the origin of the American cat populations studied (Spain, n = 7; Portugal, n = 2; Italy, n = 2; France, n = 3; and Great Britain, n = 4). The American and Canary Island samples were composed of 60 populations, includ-ing 10 North American populations of Anglo origin (Atlan-tic coast and U.S. Midwest) and three Canadian popula-tions, 21 (including those reported here) Latin American and one Canary Island sample (Tenerife 2) directly ob-tained by the authors, four populations from the US (Rich-mond, California; Denver, Colorado; and Dallas and Hous-ton, Texas) that may have been influenced by the Spaniards during their settlement process (Lamoreux and Robinson, 1971; Blumenberg, 1976; Blumenberg and Blumenberg, 1976; Morrill and Todd, 1978), 16 populations from Brazil, two from Mexico, Venezuela (Caracas), Curaçao (Willemstadt), Jamaica (Kingston) (Lloydet al., 1981), and one population from Santa Cruz de Tenerife (Canary Is-lands) (Lloyd, unpublished), referred to as Tenerife 1.
Two approaches were used to analyze the Latin Ame-rican cat populations reported here with regard to other cat populations: similarity and phylogenetic analysis. For the first one, DA (Neiet al., 1983) and Prevosti’s (1974)
netic distance matrices among pairs of populations were obtained, and the UPGMA and neighbor-joining (Saitou and Nei, 1987) algorithms were applied. The trees with the best cophenetic correlation coefficients (Sneath and Sokal, 1973) and the lowest Fitch and Margoliash (1967) standard deviations were analyzed. The bootstrap method (Felsens-tein, 1985) using Efron’s (1982) resample technique was used for several trees (500 resamples), to analyze the reli-ability of each tree cluster. However, the bootstrap percent-ages were low to very low in all the trees analyzed.
The second approach was a maximum parsimony analysis. The branch-swapping technique was employed using the mhennig* command of the HENNIG86 v. 1.5 program where each character (= mutant allele) presented multiple states (Felsentein, 1983), as follows: when the al-lele was not found in a population, the corresponding state was 0; when the frequencies were between 0-0.1, 0.1-0.2, 0.2-0.3, 0.3-0.4, 0.4-0.5, 0.5-0.6, 0.6-0.7, 0.7-0.8, 0.8-0.9, and 0.9-1.0, the corresponding multiple states were 1, 2, 3, 4, 5, 6, 7, 8, 9, and 10, respectively. Leticia-Tabatinga (on the Colombian-Brazilian border in the Amazon) and Dui-tama (in the Colombian Andean highlands) were used as outgroups, because previous partial analyses indicated that they behaved differently from other Latin America popula-tions. This analysis was developed for 21 populations sam-pled exclusively by the authors in Latin America. The minimum number of steps attained in the most-parsimo-nious trees, consistence, and retention coefficients (Kluge and Farris, 1969) were estimated. In addition, the possible states of each hypothetical ancestral population for each ge-netic trait studied for each phylogege-netic tree were obtained by using the routine steps of the HENNIG86 v. 1.5 pro-gram.
Finally, we studied the temporal genetic stability of three Brazilian cat populations (São Paulo, Rio de Janeiro and Manaus). Previously, Watanabe (1983) had studied large samples of these cat populations. We sampled these populations again about 13-20 years later (1996-2003), which represents about 13 to 40 generations in the natural history of this species. A chi-square test was applied to de-termine if there were significant temporal changes in the al-lele frequencies of these cat populations. If a high temporal stability in the genetic profiles of the Latin America cat populations can be demonstrated, this could be an impor-tant proof in favor of the hypothesis that these current cat genetic profiles represent the original profiles of the cat populations upon the foundation of cities in Latin America by Europeans.
Results
The allele frequencies and the corresponding stan-dard deviations of the nine morphologic loci studied in the cat populations of Acapulco, Mexico D.F., Veracruz, Alva-rado, Leticia-Tabatinga and neighboring small villages, São Paulo, Rio de Janeiro, Manaus, Santa Cruz, La Paz, and
Santo Domingo are listed in Table S1. The Hardy-Wein-berg equilibrium analyses applied at the O locus are shown in Table S2. When they were applied to the complete sam-ples using the maximum likelihood method, they proved to be in Hardy-Weinberg equilibrium, with the exception of La Paz, where an excess of homozygotes was found (χ2= 3.987, 1 df, p < 0.05), although with the Bonferroni correction this value was not significant. Some sex ratios showed a favorable value towards males by this method (m = 0.691, La Paz; m = 0.567, Veracruz; m = 0.643, Alvarado; m = 0.734, Manaus), and in one case it was fa-vorable towards females (m = 0.317, Rio de Janeiro).
However, the Hardy-Weinberg equilibrium analysis of the sexed females showed different results. Mexico D.F. (χ2
= 5.079, 1 df, p < 0.05) and Acapulco (χ2
= 32.01, 1 df, p < 0.001) had a significant excess of heterozygotic females (O/o), while La Paz showed an excess of homozygotic fe-males. The other populations were in Hardy-Weinberg equilibrium for this genetic marker in the females. The di-rect sex ratio showed discrepancies from those obtained theoretically by using the maximum likelihood method. With the Bonferroni correction, Mexico D.F. (m = 0.364;
χ2 = 8.25, 1 df, p < 0.001) and Acapulco (m = 0.286;
χ2= 12.8, 1 df, p < 0.001) were the only populations that presented an excess of females. These significant differ-ences imply that the maximum likelihood method used to estimate m can misrepresent the reality. However, the ex-cess of homozygotes in La Paz can rather be attributed to a lack of heterozygous than to an excess of homozygous males. La Paz is probably the Latin American cat popula-tion most influenced by endogamy in this study. However, the estimation of the total frequency for the O allele was not particularly different when using either method. The values calculated by the maximum likelihood and direct counter methods for each population were, respectively: Mexico D.F. (0.24vs. 0.29); Acapulco (0.38vs. 0.43); Veracruz (0.31vs.0.29); Alvarado (0.24vs.0.25); Leticia-Tabatinga (0.16vs.0.15); Manaus (0.13vs.0.18); São Paulo (0.19vs. 0.18); Rio de Janeiro (0.14vs.0.23); Santa Cruz (0.27vs. 0.25); La Paz (0.19vs.0.17); and Santo Domingo (0.31vs. 0.32). On the other hand, in the populations of Mexico D.F., Acapulco, Veracruz, Alvarado, Leticia-Tabatinga, Ma-naus, São Paulo and Santo Domingo, the O allele frequen-cies for males and females were practically identical. The two populations from Bolivia and Rio de Janeiro showed the largest differences for p(O) between the sexes. In Santa Cruz, the frequencies for males and females were 0.295 and 0.235, while in La Paz the frequencies were 0.231 and 0.139, respectively.
Similarity and phylogenetic analyses of the Latin American cat populations
clusters were differentiated. One was composed of the pop-ulations from Brazil (Northern and Amazonian), including those of Leticia-Tabatinga and Manaus reported here. In fact, the two Amazonian populations were significantly
dif-ferent only at W (χ2= 8.79, 1 df, p < 0.01). The other eight
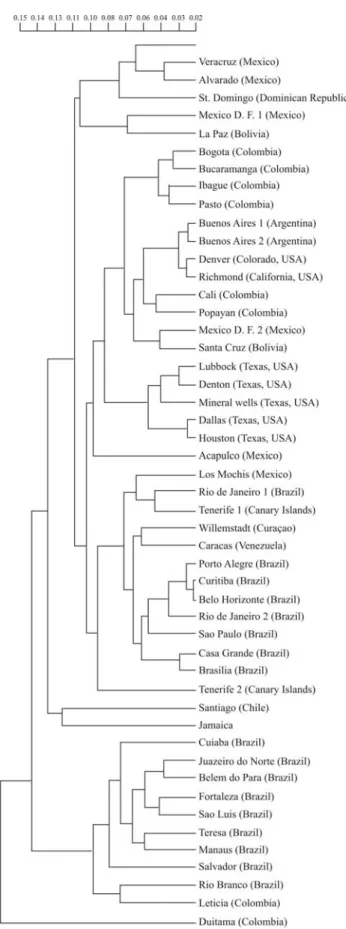
genes did not present significant differences between these two Amazonian localities separated by 1500 km. The sec-ond cluster was formed by 5 groups: (1) southern Brazil populations along with one sample from Tenerife, Los Mochis (Mexico), and the populations of Caracas and Cu-raçao (North Atlantic South America); (2) the populations from Catalonia and the Balearic Islands, the other sample from Tenerife, and populations from Portugal and Italy; (3) the populations from California, Texas, Acapulco, Santa Cruz, Mexico D.F., La Paz, Duitama, and those of the Spanish-speaking Caribbean countries; (4) a U.S. cat popu-lation of presumed Spanish origin (Denver), Buenos Aires, six Colombian populations, and some U.S. Midwest popu-lations (Reno, Nevada, and Chicago, Illinois); (5) the U.S. populations of presumed Anglo origin, such as the popula-tions of Canada, Great Britain, France, Santiago (Chile) and Jamaica. Additionally, other analyses ratified the exis-tence of at least five different gene ensembles for Latin American cats. For instance, a UPGMA tree using the Prevosti distance with a set formed by cat populations from 50 Latin American sites and from the U.S. with Spanish in-fluence showed the following picture: the most divergent population was Duitama (Colombia), with probable founder effect and extensive genetic drift. The other popu-lations were grouped into five well delimited groups. The most divergent group comprised the Amazonian and North Brazilian populations, including Leticia-Tabatinga and Manaus. The second group of populations comprised the Santiago and Jamaica populations, which historically re-ceived more direct and indirect British influence. The third group was composed of populations from Spanish-speak-ing Caribbean countries, includSpanish-speak-ing Mexico, Cuba and the Dominican Republic, in addition to the populations of Me-xico D. F. (the oldest sample not sampled by us) and the population of La Paz (Bolivia). The last two clusters were the highest ones. The first cluster was composed of the pop-ulations of Bogota, Ibague, Bucaramanga, and Pasto (all from Colombia), Buenos Aires (Argentina) along with Col-orado and California (USA) and Cali and Popayan (both in Colombia), Mexico D.F (the new sample obtained by us), Santa Cruz, Acapulco, and the populations of Texas (USA). The last cluster comprised the populations of South Brazil, including the samples from São Paulo and Rio de Janeiro sampled by us, Los Mochis (Mexico), Tenerife (Canary Is-lands), Curaçao, and Caracas (Venezuela) (Figure 3).
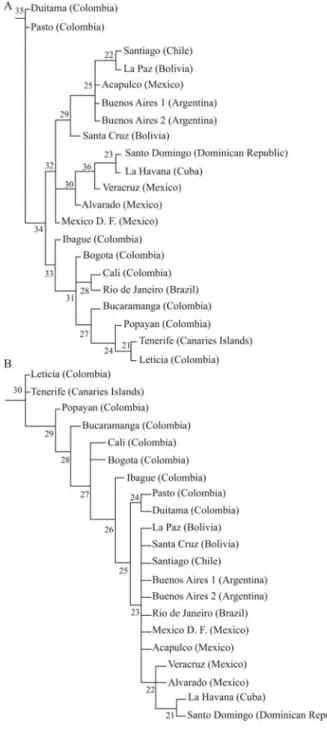
The phylogenetic analysis generated two maximum parsimony trees with minimum length (56 steps), a consis-tency index of 48, and a retention index of 61. The tree, us-ing Duitama (Colombia) as an outgroup element, showed that Pasto was its closest Colombian population (Figure 4a). Four well-delimited groups were observed: (1) the populations of Spanish-speaking Caribbean countries; (2) the populations of Buenos Aires, Acapulco, Santiago and Bolivia; and (3) Mexico D.F. These three groups were closer related among each other than to the fourth group,
formed by: (4) the Colombian populations, Rio de Janeiro, Leticia-Tabatinga, and Tenerife. Santiago was more similar to the geographically closest Latin American populations when using the maximum parsimony method than when the distance method was employed. The two populations of Bolivia were more similar to each other by the distance method, and Buenos Aires showed a strong similarity with the Latin American Pacific coast populations. In contrast with other analyses, the Caribbean populations were more similar to other Latin American populations, while the Co-lombian populations were very similar to the populations of Tenerife (Canary Islands) and South Brazil. The other max-imum parsimony tree, using the population of Leticia-Tabatinga as an outgroup (Figure 4b), supported the exis-tence of the relationships mentioned above. The genetic profiles of the hypothetically ancestral populations of the most important current groups of Latin American cat popu-lations are listed in Table S3.
We compared the allele frequency profiles of the cat populations of São Paulo, Rio de Janeiro and Manaus sam-pled prior to those reported here (Table S4). In the case of Manaus, none of the loci (7) showed significant differences in the last 13-20 years with regard to the Watanabe (1983) sample. The two loci which showed greater temporal varia-tion were O (0.18vs.0.13) and S (0.47vs.0.36). Therefore, these two genes seem to have decreased over time, but without reaching statistical significance. In the case of São Paulo, our sample did not differ for any locus from the first genetic profile obtained by Todd and Jeanne (1972), al-though their sample was very small and came from a single site of the city. Our sample only differed at the S locus (0.42 vs.0.31;χ2= 5.68, 1df, p = 0.025) from that of Watanabe’s (1983) genetic profile, although this significance disap-peared with the Bonferroni correction. Thus, taken together Manaus and São Paulo, no case out 14 loci studied was clearly statistically significant. This clearly points toward genetic stability in the cat populations of Manaus and São Paulo.
The case of Rio de Janeiro is different. In a first ap-proach, we compared the two genetic profiles that we ob-tained in 1996 (n = 276) and 1999 (n = 81) from all over the city. No significant differences were detected at the nine loci examined. The only locus close to a significant change (but without reaching it) was cs(Siamese), which was not detected in the first sample (0 vs. 0.11). Therefore, both samples were taken together and the overall genetic profile was compared to the Watanabe (1983) profile. With the Bonferroni correction, three out of seven loci showed sig-nificant differences: O (0.24 vs. 0.14; χ2 = 25.84, 2df, p < 0.001), l (0.19vs.0.29;χ2= 17.63, 1df, p < 0.001), and W (0.04vs.0.01;χ2
= 16.87, 1df, p < 0.001). Orange (O) and Dominant White (W) decreased over time, while long hair (l) increased over time. The genetic instability of the Rio de Janeiro profile compared to those of Manaus and São Paulo is explained in the Discussion.
Discussion
Some considerations on Hardy-Weinberg equilibrium and sex ratio in Latin American populations of cats
The cat population of La Paz showed beyond any doubt the existence of an excess of homozygotes at the O locus. Moreover, we observed showy genetic characteris-tics in this population. The dominant mutants curled-ear
(Cu) (3/131, p(Cu) = 0.0115) and Manx (M) (1/131, p(M) = 0.004) were present. La Paz, together with Leticia-Tabatinga, also had the lowest q(a) frequency of all the His-panic American cat populations studied and the highest fre-quencies of long hair (l) and inhibitor (I) so far detected in the world. These findings, in addition to the geographic iso-lation of this city at 4000 meters above sea level, make it likely that the original population was established by a small number of cats with uncommon genetic traits (founder effect). Of course, the existence of any natural and/or artificial selective pressure in the current genetic makeup cannot be ruled out. In contrast, the two Mexican populations of Acapulco and Mexico D.F showed a large excess of heterozygous females at the O locus. Acapulco may have had multiple points of origin that are now re-flected in its current genetic makeup. Although many of these cat immigrants were probably Spanish, some were Asian (Ruiz-Garcia and Alvarez, 1999). A population shows an excess of heterozygotes if it presents inner groups that have been mixing and yet differ in their allele frequen-cies. It is also possible that cats from other cities in Mexico or the United States, genetically different from Acapulco, contributed to the excess of observed heterozygotes in this Mexican Pacific population. Although the excess of hetero-zygous females was significant in both cities, in Mexico D. F. it was smaller than in Acapulco. For other characteris-tics, such as the d allele, Mexico D. F. was placed between the Mexican Pacific and the Mexican Caribbean popula-tions, although it was more similar to Acapulco on the Pa-cific coast. These two genetic pools (PaPa-cific and Carib-bean) may have converged in Mexico D.F. and caused the excess of heterozygotes at O observed in the Mexican capi-tal. It was also noteworthy that the O frequencies in males and females of the two populations of Bolivia were ex-tremely different. In both cases, the male frequencies p(O) were higher than the female frequencies. This result might generate several hypotheses. For example, these two popu-lations could have been established more recently than other Latin American populations, and therefore did not have sufficient genetic homogenization time for the fre-quencies at this locus to become equal between the sexes.
This hypothesis is supported by the divergent genetic profile of La Paz, but it is not supported by the genetic pro-file of Santa Cruz and the short generational time in this species (1 year). A second hypothesis (Pontieret al., 1995) assumes that in rural habitats the orange male cats are selec-tively favored over non-orange males because of their lar-ger size. In contrast, larlar-ger males would be negatively selected in urban habitats. This second hypothesis does not apply to female cats, because there is no evidence to sug-gest that coat color is correlated with body size. The higher p(O) in males compared to females in Bolivia supports Pontieret al.‘s hypothesis, because a high percentage of its human population was born in the countryside, having only recently moved to the cities. A third possibility would be
the existence of positive artificial selection for orange ma-les. There is anecdotal evidence suggesting that the native Indians of Bolivia prefer orange males.
Analysis of some of the mutant allele frequencies estimated in Latin American cat populations
The frequencies of the a allele in many Latin Ameri-can cat populations were within the range found in the Spanish populations. Other populations, such as Colombia, Curaçao, Venezuela, the Canary Islands, and Colorado in the U.S., presented higher frequencies of q(a). According to Todd (1978), such an increase in the q(a) frequencies is ex-pected under specific conditions. Based on studies with ro-dents (Keeler, 1942) and other carnivores (Keeler et al., 1968, 1970), Todd (1978) hypothesized that there is a pleiotropic association between melanizing genes and doc-ile behavior. Therefore, black animals (aa) would have been better able to tolerate shipping, contact with humans, and conditions of high densities with other cats during travel. However, this hypothesis was not supported by the Caribbean and other populations, such as the Leticia-Taba-tinga and the Bolivian populations, which were the result of multiple migration steps. For instance, the populations of Mexico D.F. and Acapulco likely originated from Spanish Mediterranean populations with the following intermediate steps: Canary Islands, Santo Domingo, Havana, and Vera-cruz. Cat propagules that originated in Spain underwent a large number of intermediate selection steps before they settled in Bolivia. In addition to the steps previously cited for Mexico D.F. and Acapulco, cats destined for Bolivia underwent other steps, including different ports on the Pa-cific coast of Central America (Panama, Balboa), Ecuador (Guayaquil), Peru (Lima and El Callao, the most important commercial port on the Pacific used by the Spaniards) and Chile (Valparaiso). However, Santa Cruz did not support Todd’s hypothesis, because its q(a) value was similar to that of several Spanish populations. Even the value of this character found in La Paz (0.635) was lower than that found in Spain. If Todd’s hypothesis was true, a population lo-cated in an area of difficult access, 4000 meters above sea level in the Andes, would have a very high q(a) frequency. The same could be said for Leticia-Tabatinga (0.628). The cats imported from Portugal and Spain must have arrived at the mouth of the Amazon, later being transported the nearly 3000 km up the Amazon River to found the current popula-tions of Leticia and Tabatinga. However, this does not seem to increase the frequency of this allele as postulated by Todd’s hypothesis.
The frequencies of tbin all the Latin American popu-lations that we studied were low, or very low, supporting little contact with populations of British origin. Further-more, the Spanish cat populations considered as ancestral, such as the Catalonian and Balearic ones, have low fre-quencies of this genetic trait. On the other hand, the popula-tions of southern Spain (for example, the two Andalusian
cities Cadiz and Malaga), from where most of the ships that colonized and conquered America sailed, showed higher frequencies of tb. This could be the result of an increase of q(tb) in southern Spain during the last centuries. However, the size of the samples and the number of cat populations from southern Spain analyzed are still very limited. An analysis of the populations of Seville and Huelva is essen-tial for the confirmation of a possible change in the tb fre-quencies in southern Spain. However, there are some historical reasons that could explain the increase of tb in some Spanish ports relating to the conquest of America. For instance, Cadiz was an important colonization point for the Americas during the epoch of Philip V until the epoch of Charles III. Although Seville was the most important port for the Americas until 1717, by 1654 strong competition from Cadiz began to be recognized. During the XVIII cen-tury, Cadiz became the port most commonly used by ships headed for the Americas. During this time, three-quarters of all Spanish exports in terms of value originated from this port (Fisher, 1988). For example, between 1785 and 1796, Veracruz and Havana in the North Caribbean received 42.5% of all exports from Cadiz. The genetic profile of the cats of Cadiz, however, does not show a conspicuous simi-larity to those of Latin America cat populations. The cur-rent high levels of q(tb) in Cadiz are similar to other West European cat populations and could be the result of an in-flux of more than three-quarters of its inhabitants since 1750, especially of French, Dutch and Italian origin. For in-stance, in 1654, France began to dominate the commerce of the ports of Cadiz, Alicante and San Sebastian (Spain). This commercial domination of the Cadiz port could have intro-duced many cats from French populations to this city. At the same time (XVII and XVIII centuries), the port of Malaga was dominated by the Genovese (Italians), who transported English textiles between Spain and North Af-rica and formed more commercial routes throughout the in-ner region of Andalusia (especially Cordoba, Jaen and Antequera) than from Spain to America. Therefore, the cats exported to Latin America were those of the first centuries of the conquest (XV, XVI and XVII), prior to an increase of tbin the southern Spanish ports.
that receive intense solar radiation and are exposed to high temperatures. Therefore, the p(S) distributions may be linked to habitat variations resulting from intensive solar radiation and high temperature (a selective hypothesis). This could be the best example of a gene submitted toin situ natural selection in the new colonized habitats.
The inhibitor allele, I, has very low and residual fre-quencies in Spanish and most other populations across the world and is almost residual in some populations of Latin America. However, four of the populations studied (Alva-rado, Santa Cruz, La Paz and Islandia, a Peruvian Amazon island included in the Leticia-Tabatinga sample) presented higher frequencies than those of other populations ana-lyzed. In fact, the p(I) value of La Paz (0.236) was the high-est found in the world. For this locus, it is more difficult to determine if there was pre-migrational selection, at least for some populations, or if these p(I) values merely reflect a founder effect with or withoutin situnatural and/or artifi-cial selection. The La Paz cat population could show a strong in situ artificial selection. The Spaniards founded many of the present cities of Bolivia, because they were considered optimal sites from which to search for and to ob-tain silver. Spain considered the location of La Paz to be critical, because it was between the southern silver mines and those on the Pacific coast. The Spaniards established a second Bolivian city (Potosi) in 1545, after having discov-ered abundant silver deposits. Five thousand mine en-trances were created and eight million Mitayo Indians died during the extraction process (Buero, 1994). By 1651, the number of inhabitants had reached 160,000, three times the size of the current population and, at the time, second only to London in the world. An astonishingly large amount of silver (16,000 tons) was extracted from Potosi and shipped to Seville during the time period of 1545-1660. Perhaps the high frequency of silver cats in silver-mining Bolivian cit-ies is not coincidental, butin situnatural selection can be not ruled out either. The Andean cat (Oreailurus jacobita) that lives in this region also has a silver coat, and possible hybridization among both felines during the formation of the domestic cat population could not be discarded. On the other hand, the presence of the inhibitor trait together with the Abyssinian tabby character only in the Peruvian Ama-zon island of Islandia (alleles not detected in other Amazo-nian cat populations) revealed a founder effect in this cat population.
Diverse Latin American cat gene pools and possible historical causes
Analysis of the Latin American cat populations shows the existence of at least five differentiable gene pools, four of them presumed to have an Iberian origin:
(1) the populations of northern Brazil and the Brazil-ian Amazon, including the Leticia-Tabatinga sample; (2) some populations spread across Latin America which pres-ent some British influence, such as Jamaica and Santiago de
to the Pacific coast than the other Colombian populations studied, showed direct contributions from the Pacific route more clearly than the other Colombian populations; Pasto, founded by Spanish expeditions from Ecuador (Caillavet and Pachón, 1996), sometimes also showed a stronger rela-tionship to the Pacific route than to the other Colombian populations; (4.3) the populations of Acapulco, Mexico D.F., Santa Cruz and La Paz (Bolivia) constitute another group that confirmed this Pacific connection, but with some small divergent influences. However, the samples from La Paz and the ancient sample from Mexico D.F showed in-consistent relationships with some distances and algo-rithms. In the first case, the strong founder effect that af-fected this population could be the explanation for the scarce relationships seen with other Latin America popula-tions. In the second case, the first genetic profile of Mexico D.F. (Todd etal., 1976) could be non-representative of this population due of inadequate way of sampling. Group (4.4) comprised the populations of Texas, which were related to this Pacific connection, but with their own genetic charac-teristics. Group (5), comprising the populations of southern Brazil, Tenerife and Puerto de la Cruz (Canary Islands), Curaçao and Venezuela, was found to be an exclusively At-lantic group. It is important to mention that the Colombian populations (Bogota, Ibague, and Bucaramanga, for in-stance), which must have been originally formed by cats from the Atlantic ports of Cartagena de Indias, Barran-quilla, and Santa Marta, did not show genetic profiles that were very different from those of the Pacific connection. However, they did differ from the Caribbean populations (Atlantic constitution), from which they were thought “a priori” to have originated. For example, Santo Domingo (Dominican Republic) was visited immediately preceding Cartagena and Santa Marta, and the commerce between Santa Marta and Havana was very active (Fisher, 1981, 1988). However, in genetic terms, the populations of Co-lombia were not very similar to those from the Caribbean area. This could be the result of selection acting on some genes within the Caribbean populations of Santo Domingo and Havana, or of a varied origin of the Colombian and Ca-ribbean populations. Only a study of the populations of Cartagena, Barranquilla and Santa Marta could clarify this issue. The cat population of Los Mochis in Mexico was in-explicably associated to this group. Probably the sample studied by Toddet al.(1976) did not adequately represent this population. Additionally, the cat population of Dui-tama (Colombian Andean highlands) was marked by a strong founder effect with gene drift, and its association with other Colombian cat populations is distorted.
Although there is no consensus for the degree of rela-tionship among these five groups, the maximum parsimony analysis showed some interesting traits, as follow. (1) The Colombian populations were the most divergent from the other Latin American populations analyzed, and the popu-lations of the Canary Islands were closer to the Colombian
populations than to the rest of the Latin American populations. This means that in this analysis the Colombian populations were most similar to the Spanish populations. (2) The populations of Pacific and Caribbean influence were closer related to each other than to the Colombian populations. (3) There was a strong relationship between the two populations of Bolivia, and (4) Santiago, Chile, be-haved essentially as a Latin American Pacific population. However, using the genetic distance methods, some of these trends obtained with the maximum parsimony meth-ods were not observed.
of Leticia-Tabatinga and Manaus (separated by 1500 km of the Amazon River) is explained by this commercial route. The Catalans who migrated into the Amazon region pro-vided a dispersal mechanism with countless opportunities for the transport of other domestic animals such as cats. This also provides an explanation as to why there is a ge-netic resemblance between Leticia and some Catalan cat populations.
Explanations for some temporal genetic changes in some Brazilian cat populations
As previously discussed, the new samples of Manaus and São Paulo did not show significant temporal changes for the gene frequencies of seven loci compared to the gene profiles obtained by Watanabe (1983). The sole marginal exception was the case of S in São Paulo, which decreased. However, our 1999 sample was small (n = 70); therefore, this significant difference could have no biological reason. Basically, the result confirms that both populations are large enough to be insensitive to gene drift effects, because the effective numbers are important, and there are no selec-tive patterns affecting these loci during the 13-40 genera-tions of the cat populagenera-tions of these Brazilian cities. Identically, these cat populations did not receive important influxes from other foreign cat gene pools. This probably means that the genetic profiles of these cat populations were established at the origin of these cities and especially when they reached a population size of 15,000-30,000 hu-man inhabitants (Ruiz-Garcia, 1990).
Contrarily, the Rio de Janeiro cat population seemed to change genetically for some loci over this time. O and W significantly decreased, and l and, partially, d increased. There are two hypotheses to explain this finding. The first one is neutral. The same both authors of this paper obtained two samples in Rio de Janeiro, one in 1996 (n = 276) and the other in 1999 (n = 81). Although they did not show sig-nificant differences for nine loci, many of the cat communi-ties sampled in 1996 had disappeared in 1999 because of human actions. It is possible that the effective sizes have been reduced in the last decades in this Brazilian city. Therefore, gene drift could be more important and more possibilities for gene changes occurred. Furthermore, the opportunity for an introduction of new alleles from other immigrant foreign pools to the cats of Rio de Janeiro be-comes possible. Precisely the two alleles (l and d) more positively affected by pre-migrational selection in the cat colonization of Latin America from Spain and Portugal were those whose gene frequencies increased over time. Additionally, the Siamese (cs) allele was not present in the first sample but present in the second sample, even though its size was smaller than that of the first one. This agrees quite well with the fact that new and foreign alleles were in-troduced into the Rio de Janeiro cat gene pool. A second, selective explanation is also possible. The increase of major urban pressures could negatively affect some alleles such
as O and W. Moreover, both events could act together. Nevertheless, if a major urban pressure developed in Rio de Janeiro, the question is why this change has not also af-fected the cat populations of Manaus and São Paulo.
More Latin American cat populations must be ana-lyzed for a complete understanding of the population genet-ics dynamgenet-ics of the colonization process from Europe and the internal evolution of this species within Latin America.
Acknowledgments
The authors thank the many people and families in the diverse cities of Mexico, Colombia, Brazil, Bolivia and the Dominican Republic who helped in the sampling process, even when they had limited finances. Special thanks go to Dr. V. Salceda and his wife, Diana, for their hospitality in Mexico DF. Part of the financial support that made it possi-ble to travel to these Latin American cities came from the Pontificia Universidad Javeriana. Special thanks go also to the Science Faculty Dean (Dr. C. Corredor) and the Vice-rectory of the University. Thanks also go to Dr. Thomas Defler for English revision. This work is dedicated to the memory of Dr. Roy Robinson and those small friends who accompanied us during years.
References
Alzate B (1993) De región a región: Catalanes en la Amazonía. In: Pineda R and Alzate B (eds) Pasado y Presente del Ama-zonas: Su Historia Económica y Social. Memorias VI Con-greso de Antropología en Colombia. Universidad de Los Andes, Bogotá, pp 67-79.
Blumenberg B (1976) Mutant allele frequencies in the domestic cats of California, Texas and New Spain. Carnivore Genet Newsl 3:2-9.
Blumenberg B and Blumenberg G (1976) Cat gene frequencies in the San Francisco Bay Region, California. Genetica 46:385-389.
Buero H (1994) Descubriendo Bolivia. Editorial Los Amigos del Libro. Werner Guttentarg, Cochabamba, 115 pp.
Caillavet C and Pachón X (1996) Frontera y Poblamiento: Estu-dios de Historia y Antropología de Colombia y Ecuador. Instituto Francés de Estudios Andinos y Universidad de Los Andes, Bogotá, 173 pp.
Committee on standardized genetic nomenclature for Cats (1968) Standardized genetic nomenclature for the domestic cat. J Hered 59:39-49.
Efron B (1982) The jackknife, the bootstrap and other resampling plans. Soc Ind Appl Math, Philadelphia, 255 pp.
Felsenstein J (1983) Parsimony in systematics: Biological and sta-tistical issues. Annu Rev Syst Ecol 14:313-333.
Felsenstein J (1985) Confidence limits on phylogenies: An ap-proach using the bootstrap. Evolution 39:783-791. Fisher JR (1981) Imperial “free trade” and the hispanic economy,
1778-1796. J Latin Am Stud 13:21-56.
Fitch WN and Margoliash E (1967) Construction of phylogenetic trees. Science 155:279-284.
Kajon A, Centron D and Ruiz-Garcia M (1992) Gene frequencies in the cat population of Buenos Aires, Argentina, and the possible origin of this population. J Hered 83:148-152. Keeler C (1942) The association of the black (non agouti) gene
with behavior in the Norway rat. J Hered 33:371-384. Keeler C, Mellinger T, Fromm E and Wade L (1970) Melanin,
adrenalin and the legacy of fear. J Hered 61:81-88. Keeler C, Ridgway S, Lipscomb L and Fromm E (1968) The
ge-netics of adrenal size and tameness in colorphase foxes. J Hered 59:82-94.
Kluge AG and Farris JS (1969) Quantitative phyletics and the evolution of anurans. Syst Zool 18:1-32.
Lamoreux L and Robinson R (1971) Cat gene frequencies in Rich-mond, California. Genetica 42:61-64.
Lloyd AT and Todd NB (1989) Domestic cat gene frequencies. A catalogue and bibliography. Tetrahedron Publications, Newcastle Upon Tyne, 37 pp.
Lloyd AT, Todd NB and Baldwin JA (1981) Mutant allele fre-quencies in the cats of Kingston, Jamaica. Carnivore Genet Newsl 4:203-205.
Morrill RB and Todd NB (1978). Mutant allele frequencies in the domestic cats of Denver, Colorado. J Hered 69:131-134. Nei M, Tajima F and Tateno Y (1983) Accuracy of estimated
phylogenetic trees from molecular data. Gene frequency data. J Mol Evol 19:153-170.
Pontier D, Rioux N and Heizmann A (1995) Evindence of selec-tion on the orange allele in the domestic cat,Felis catus: The role of social structure. Oikos 73:299-308.
Prevosti A (1974) La distancia genética entre poblaciones. Mis-cellanea Alcobé. Publicacions Universitat de Barcelona 12:109-118 (Abstract in English).
Robinson R (1972) Mutant gene frequencies in cats of Cyprus. Theor Appl Genet 42:293-296.
Robinson R (1977) Genetics for Cat Breeders.Pergamon Press, Oxford, 216 pp.
Robinson R and Silson M (1969) Mutant allele frequencies in cats of Southern England. Theor Appl Genet 39:326-329. Ruiz-Garcia M (1990) Mutant allele frequencies in the domestic
cat populations on the Spanish Mediterranean Coast, and their genetic distances from other European and North Afri-can cat populations. Genetica 82:215-221.
Ruiz-Garcia M (1994) Genetic profiles from coat genes of natural Balearic cat populations: An Eastern Mediterranean and North African origin. Genet Sel Evol 26:39-64.
Ruiz-Garcia M (1997) Genetic relationships among some new cat populations sampled in Europe: A spatial autocorrelation analysis. J Genet 76:1-24.
Ruiz-Garcia M (2000) Is there really natural selection affecting the l frequencies (long hair) in the Brazilian cat populations? J Hered 91:49-57.
Ruiz-Garcia M and Alvarez D (1996) The use of the domestic cat as an extragenic marker of the historical and commercial hu-man movements. Braz J Genet 19:184.
Ruiz-Garcia M and Alvarez D (1999) Análisis filogenético de 21 poblaciones latinoamericanas de gatos mediante 10 loci morfológicos utilizando métodos de matrices de distancias genéticas y de máxima parsimonia. Bol Real Soc Esp Hist Nat 95:43-168 (Abstract in English).
Ruiz-Garcia M and Alvarez D (2003) Posible origen europeo de seis poblaciones latinoamericanas de gatos y no existencia de paralelismo con el modelo colonizador británico al utili-zar genes del pelaje y microsatélites. Acta Zool Mex 89:261-286 (Abstract in English).
Ruiz-Garcia M, Campos HA, Alvarez D, Diaz S and Kajon A (2002) Coat gene profiles of several cat populations in Cuba, Costa Rica, Colombia, Paraguay, Chile and Argentina, and possible genetic origins of these populations. Russ J Genet 38:27-242.
Saitou N and Nei M (1987) The neighbor-joining method: A new method for reconstructing phylogenetic trees. Mol Biol Evol 4:06-425.
Searle AG (1949) Gene frequencies in London’s cats. J Genet 49:14-220.
Shostell JM, Staudinger J and Ruiz-Garcia M (2005) Mutant al-lele frequencies in domestic cat populations in Arkansas and Tennessee. J Hered 96:557-565.
Sneath PH and Sokal RR (1973) Numerical Taxonomy. W.H. Freeman, San Francisco, 568 pp.
Todd NB (1977) Cats and commerce. Sci Am 237:100-107. Todd NB (1978) An ecological, behavioural genetic model for the
domestication of the cat. Carnivore 1:52-60.
Todd NB and Jeanne RL (1972) Some cats of São Paulo, Brazil. J Hered 63:321-323.
Todd NB, Glass GE and Creel D (1976) Cat population genetics in the U.S. Southwest and Mexico. Carnivore Genet Newsl 3:43-54.
Todd NB, Glass GE and McLure I (1974) Gene frequencies in some cats of South America: Caracas, Venezuela and Willemstad, Curacao. Carnivore Genet Newsl 2:230-235. Watanabe MA (1981) Mutant allele frequencies in the domestic
cats of São Paulo, Brasil. Carnivore Genet Newsl 4:168-177. Watanabe MA (1983) Estudo populacional da cor de pelagem de gato doméstico (Felis catusL.) em dezesseis localidades do Brasil. PhD Thesis, Universidade de São Paulo, São Paulo.
Supplementary Material
The following online material is available for this article:
- Table S1. Allele frequencies. - Table S2. Hardy-Weinberg analysis.
- Table S3. Allele frequencies of ancestral popula-tions.
- Table S4. Temporal allele frequency changes. This material is made available as part of the online article from http://www.scielo.br/gmb.
Associate Editor: João S. Morgante
1
n
O
a
t
bT
Ad
l
s
W
c
SI
Acapulco
310
0.377±0.027 0.707±0.024 0.245±0.034 0 0.477±0.026 0.441±0.026 0.349±0.022 0.022±0.005 0.153±0.028 0.029±0.007Mexico D.F.
443
0.237±0.020 0.739±0.019 0.169±0.034 0 0.359±0.025 0.497±0.023 0.264±0.018 0.024±0.006 0.385±0.022 0.007±0.003Veracruz
241
0.310±0.019 0.742±0.026 0.119±0.041 0.004±0.004 0.204±0.033 0.472±0.031 0.347±0.025 0.011±0.005 0.291±0.031 0.014±0.006Alvarado
123
0.235±0.035 0.711±0.036 0.197±0.056 0.006±0.006 0.131±0.046 0.473±0.041 0.327±0.034 0.008±0.006 0.182±0.045 0.071±0.017Leticia-Tabatinga
423
0.159±0.034 0.628±0.021 0.325±0.029 0.012±0.044 0.123±0.025 0 0.298±0.033 0.003±0.034 0.239±0.024 0.012±0.036Manaus
116
0.133±0.069 0.707±0.037 0.189±0.066 0 0 0 0.361±0.065 0.044±0.065 0.275±0.047 0São Paulo
70
0.188±0.081 0.762±0.041 0 0 0 0.396±0.055 0.308±0.078 0.007±0.084 0.170±0.059 0Rio de Janeiro 357
0.139±0.036 0.755±0.014 0.292±0.036 0 0.318±0.025 0.294±0.025 0.379±0.034 0.010±0.037 0.053±0.027 0.012±0.037Santa Cruz
146
0.275±0.036 0.739±0.032 0.153±0.053 0 0.471±0.039 0.411±0.039 0.234±0.028 0.011±0.006 0.267±0.041 0.079±0.017La Paz
133
0.189±0.031 0.635±0.037 0.151±0.053 0 0.415±0.041 0.668±0.033 0.216±0.027 0.015±0.007 0.124±0.044 0.236±0.029Santo
2 - = not estimated.
Maximum Likelihood method
Directly sexed females
Population
O/- & O/O
O/+
+/- & +/+
χ
2p
O/O
O/+
+/+
χ
2p
Mexico D.F.
observed
54
63
243
0.1
NS
7
70
635.08
<0.05
expected
52.9
65.19
241.9
12.6
58.8
68.6
Acapulco
observed
73
72
144
0.33
NS
4
73
1732.01
<0.0001
expected
75.04
67.88
146.08
17.44
46.09
30.45
Veracruz
observed
47
40
129
1.13
NS
9
41
550.12
NS
expected
43.89
46.21
125.89
8.28
42.42
54.29
Alvarado
observed
20
15
82
2.38
NS
4
15
301.07
NS
expected
16.98
21.03
78.99
2.69
17.6
28.71
Leticia-Tabatinga
observed
39
48
309
0.11
NS
3
15
510.23
NS
expected
36.48
52.95
306.54
1.59
17.79
49.62
Manaus
observed
10
6
82
1.03
NS
2
4
160.63
NS
expected
7.38
11.3
79.32
0.72
6.54
14.72
São Paulo
observed
7
12
50
0.32
NS
-
-
-
-
-expected
8.92
10.53
50.76
-
-
-Rio de Janeiro observed
20
57
271
3.69
NS
2
11
190.03
NS
expected
27.55
41.65
278.89
1.75
11.47
18.78
Santa Cruz
observed
23
25
81
0.03
NS
3
25
380.19
NS
expected
22.61
25.72
80.66
3.64
23.72
38.64
La Paz
observed
18
12
97
3.98 <0.05
3
11
473.76
<0.05
expected
14.26
19.46
93.28
1.18
14.63
45.19
Santo
Domingo
observed
52
47
148
1.11
NS
15
47
611.53
NS
3
W, with (a) the population of Duitama as outgroup and (b) Leticia-Tabatinga as outgroup.
Numbers are the nodes of the trees of Figure 4.
a. Maximum Parsimony Tree
Duitama outgroup
O
a
t
bd
l
S
W
210.1-0.2
0.8-0.9
0.2-0.3
0.3-0.4
0.1-0.2
0.2-0.3
0
220.1-0.2
0.7-0.8
0.2-0.3
0.4-0.5
0.5-0.6
0.2-0.3
0 - 0.1
230.3-0.4
0.7-0.8
0.2-0.3
0.2-0.3
0.5-0.6
0.3-0.4
0 - 0.1
240.1-0.2
0.8-0.9
0.2-0.3
0.3-0.4
0.2-0.3
0.2-0.3
0 - 0.1
250.2-0.3
0.7-0.8
0.2-0.3
0.4-0.5
0.4-0.5
0.2-0.3
0 - 0.1
260.3-0.4
0.7-0.8
0.1-0.2
0.2-0.3
0.4-0.5
0.3-0.4
0 - 0.1
270.1-0.2
0.8-0.9
0.1-0.2
0.3-0.4
0.2-0.3
0.2-0.3
0 - 0.1
280.1-0.2
0.8-0.9
0.1-0.2
0.3-0.4
0.3-0.4
0.3-0.4
0 - 0.1
290.2-0.3
0.7-0.8
0.1-0.2
0.4-0.5
0.4-0.5
0.2-0.3
0 - 0.1
300.2-0.3
0.7-0.8
0.1-0.2
0.2-0.3
0.4-0.5
0.3-0.4
0 - 0.1
310.1-0.2
0.8-0.9
0.1-0.2
0.3-0.4
0.3-0.4
0.2-0.3
0 - 0.1
320.2-0.3
0.7-0.8
0.1-0.2
0.3-0.4
0.4-0.5
0.2-0.3
0 - 0.1
330.2-0.3
0.8-0.9
0.1-0.2
0.3-0.4
0.3-0.4
0.2-0.3
0 - 0.1
340.2-0.3
0.8-0.9
0.1-0.2
0.3-0.4
0.4-0.5
0.2-0.3
0 - 0.1
350.2-0.3
0.8-0.9
0 - 0.1
0.3-0.4
0.4-0.5
0.2-0.3
0
b. Maximum Parsimony Tree
Leticia - Tabatinga Outgroup
O
a
t
bd
l
s
W
210.3-0.4
0.7-0.8
0.2-0.3
0.2-0.3
0.5-0.6
0.3-0.4
0 - 0.1
220.2-0.3
0.7-0.8
0.1-0.2
0.2-0.3
0.4-0.5
0.3-0.4
0 - 0.1
230.2-0.3
0.7-0.8
0.1-0.2
0.3-0.4
0.4-0.5
0.2-0.3
0 - 0.1
240.2-0.3
0.8-0.9
0 - 0.1
0.3-0.4
0.4-0.5
0.2-0.3
0
250.2-0.3
0.8-0.9
0 - 0.1
0.3-0.4
0.4-0.5
0.2-0.3
0 - 0.1
260.2-0.3
0.8-0.9
0.1-0.2
0.3-0.4
0.3-0.4
0.2-0.3
0 - 0.1
270.3-0.4
0.7-0.8
0.1-0.2
0.2-0.3
0.4-0.5
0.3-0.4
0 - 0.1
280.2-0.3
0.7-0.8
0.2-0.3
0.4-0.5
0.4-0.5
0.2-0.3
0 - 0.1
290.3-0.4
0.7-0.8
0.2-0.3
0.2-0.3
0.5-0.6
0.3-0.4
0 - 0.1
4