C
O
M
U
N
I
C
A
Ç
Ã
O
O-Acetyl Agarose with Low Degree of Substitution
Rosangela B. Garciaand Rosangela R. L. Vidal
Departamento de Química, UFRN, Brasil
Marguerite Rinaudo
Centre de Recherches sur les Macromolécules Végétales, Grenoble, France
Abstract: Among the biodegradable polymers, the polysaccharides have been found to be promising carriers for bioactive molecules. From a general standpoint, they present several reactive groups, such as hydroxyl, carboxyl and amine, that can be modified in a number of ways, giving rise to suitable devices for controlled release. In this paper, agarose was submitted to O-acetylation reactions under heterogeneous conditions, using acetic anhydride and pyridine, aiming to observe the effect of acetyl groups on the agarose properties. The products were characterized by Infrared and 1H NMR spectroscopies. In the
range of average acetylation degrees (DA) 0.07-0.48, the polymers presented partial solubility in boiling water and in common organic solvents. The 1H NMR spectra presented evidences of non-homogeneous
acetyl group distribution along the chains, as concluded from the solubility of only one of the fractions with DA<0.09, in boiling water .
Keywords: Agarose, o-acetyl agarose, acetylation.
To whom correspondence should be addressed: Rosangela B. Garcia, Departamento de Química, Universidade Federal do Rio Grande do Norte, C.P. 1662, CEP: 59078-970, Natal, RN. E-mail: [email protected]
Introduction
Agarose is a polysaccharide obtained from red al-gae of the Rhodophyceae class which can be considered as an alternating copolymer of β-D-galactopyranosyl and 3,6-anhydro-α-L-galactopyranosyl units (Figure 1), linked in the backbone by 1→3 and 1→4 glycosidic bonds, respectively[1]. It has been extensively used in
pharmaceutical and food industries, mainly due to its gelling ability[2,3]. Agarose forms thermoreversible gels
in water at a concentration as low as 0.1% and at tem-peratures considerably below the temperature of gel melting (Tgelation ~ 40 oC and T
melting ~ 90 oC) depending
on the presence of substituents.
During the last decades, a number of studies has been dedicated to the development of systems for con-trolled release of drugs. A wide range of applications can be envisaged benefiting human beings and ani-mals, in addition to improving agricultural methods. The main goal of such studies is to obtain prolonged and constant delivering rate, reduced number of drug administrations and minimized risk of side effects re-lated to doses above toxic levels[4-5]. Both synthetic[6-13]
(polylactic acid, polyglycolic acid, poly (ε -capro-lactone) among others) and natural polymers[14,15]
(mainly collagen, gelatin and albumin) have been used. Different methods have been proposed to prepare sustained-release formulations for pharmaceutical applications. From a general standpoint, they are based either on the physical incorporation of active agents into a suitable polymeric matrix or on the synthesis of pharmacologically active polymers, in which the drug can either be part of the polymeric backbone or be bound to a side chain[16-28].
O
O OH
OH O
O
O OH
CH OH2
n
In the case of physical incorporation, a drug core can be surrounded by a polymeric film or, alterna-tively, it can be homogeneously distributed in a poly-mer matrix. Drug release can take place in a number of ways, including diffusion throughout the poly-mer film or matrix; degradation/dissolution of bioerodible polymers, or swelling of the polymeric matrix with formation of pores through which the drug can flow[28].
The efficiency of drug entrapment as well the rate of delivering depend on both the drug and polymer physicochemical properties. Promising results on slow drug releasing and high drug loading have been ob-tained for lipophilic drugs loaded into water insoluble polymers[16,22,27]. Nevertheless, contrary to free drug
systems, the encapsulated drug is not promptly avail-able to the biological system, regardless of the nature of the polymeric carrier used.
Natural polymers are preferable for human appli-cations, as they are usually more safe and biocom-patible. Due to their biodegradation and common solubility in aqueous medium, they are suitable for bioerodible drug delivery systems. However, the use of a water-soluble polymer as a major constituent pro-duces a highly hydrophilic polymer matrix completely permeated by water, increasing the rate of drug re-lease[18,23]. Therefore, crosslink reactions are
fre-quently performed to avoid (or at least minimize) the solubility of the polymer in aqueous environ-ments[19,24,29].
In order to evaluate the possibility of using acety-lation reactions to obtain less hydrophylic agarose derivatives with potential applications in controlled drug release, a study of structural characterization and solubility properties was performed on O-acetyl aga-rose with low degree of substitution.
Experimental
M aterials
Agarose was kindly supplied by CIALGAS – Companhia Industrial de Algas (São Paulo, Brazil), and was used as received. Acetic anydride, pyridine and solvents such as dimethylformamide (DMF), dimethylacetamide (DMA), chloroform, methyliso-buthylketone, dimethylsulphoxide (DMSO) and 1,2-dichloroethane were of pure grade and used as received.
Acetylation reactions
Two grams of agarose were dispersed in 80 mL of acetic anhydride (96%) and pyridine (4%) at room temperature. Just in the beginning of reactions, an ice bath was used to control the medium temperature. The reactions were carried out for 30 min, 2h, 4h, 10h and 20h, under constant stirring in heterogeneous conditions. At the end of reaction, ground ice was added. The insoluble acetylated samples were recov-ered by filtration and washed with cold water and methanol. The purification was performed by reflux of methanol for 5h in a Soxhlet extractor. Afterwards, the product was dried under vaccum for 24h. The yield of polymer recovery was always higher than 70%.
Characterization of o- acetyl agarose
Infrared Spectroscopy
FTIR spectra were obtained in the film form on a MIDAC Prospect Spectrometer, in the frequency range of 4000 – 500 cm-1. The polymers were dissolved in
DMA at 5g/L concentration; after filtration, the solu-tions were placed on teflon dishes and maintained for about 72h at 50 oC for complete evaporation of
sol-vent and formation of the film.
1H NMR Spectroscopy
1H NMR spectra were obtained using a 300 MHz
spectrometer from Bruker, at 80 oC, after dissolution
of the samples in dimethyl-d6-sulphoxide ([CD3]2SO).
Degree of acetylation (DA)
The average degree of substitution was determined from 1H NMR, using the ratio of integral signal at
2.0 ppm (CH3COO-) and that of the two separated
signals between 5.0 and 5.3 ppm which were used as internal standard on the basis of the integral of all the osidic protons; each of these two signals represents one proton.
Solubility tests
Intrinsic viscosity
The viscosity measurements were performed in a Ubbelohde capillary (f = 0.58 mm) at 25 oC ± 0.1,
using DMSO as solvent. The viscometer was capped with a column of silica to avoid atmospheric mois-ture absorption by the solvent.
Results and discussion
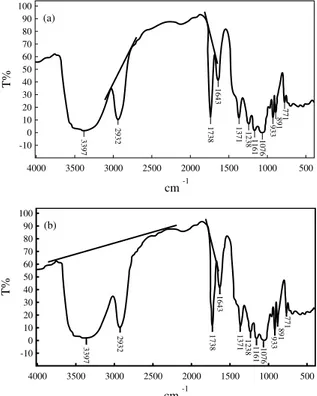
The infrared spectroscopy of agarose and O-acetyl agarose samples are presented in Figure 2. The prin-cipal bands for agarose were observed at 3395 cm-1
(OH, axial deformation), 2904 cm-1 (CH, axial
defor-mation), 1158 and 1071 cm-1 (C-O, axial
deforma-tion), 930 cm-1 (characteristic of 3,6-anhydrogalactose)
and 891 cm-1 (attributed to CH angular deformation
of β anomeric carbon). The band at 1741 cm-1 not
present in agarose spectrum was attributed to the C=O group and directly connected to the chemical modification.
In reality, depending on the species of marine red algae and the process of extraction used, several sub-stituents, such as methyl ethers, sulphate esters and pyruvate ketals can be found in agarose [30,31]; this
can be deduced from IR spectrum but it was not our purpose to identify these groups. The comparison of agarose and acetylated agarose spectra shows no modi-fication but only the appearence of the C=O band considered previously.
Then, the acetylation of agarose was followed by Infrared spectroscopy using the characteristic band of acetyl groups at 1740 – 1725 cm-1 (C=O, axial
deformation). A quantitative measurement of acety-lation was performed taking into account the absor-bance of C=O band at 1740 – 1725 cm-1 and the C-H
band at 2904 cm-1 (Figure 3a) or O-H band at 3395
cm-1 (Figure 3b) as internal standard, according the
baseline method. Figure 3 shows the baselines used for these determinations. It was observed a maximum of AC=O/AC-H and AC=O/AO-H for the reaction carried
out for 4h and smaller ratios with the increase of re-action time (10 and 20h). This unexpected behaviour can be related to the reversible character of acetyla-tion reacacetyla-tions or some fracacetyla-tionaacetyla-tion occurring during the step of purification due to change in solubility and heterogeneity of the reaction.
Figure 4 shows the 1H NMR spectrum of agarose
sample used in this work (a) and in (b) the spectrum obtained for acetylated agarose. From this, it is clear that only slight modifications are observed but the
Figure 2. Infrared spectra of agarose (a) and O-acetyl agarose: AGA20h (b); AGA0.5h (c); AGA2h (d); AGA10h (e); AGA4h (f).
Figure 3. Baselines used for determination of AC=O / AC-H (a) and AC=O /
AO-H(b) ratios.
4000 3500 3000 2500 2000 1500 1000 500
Wavenumber, cm-1
T%
(a)
(b) AC=O
AC-H
=0.27
(c) AC=O
AC-H =0.31
(d) AC=O
AC-H
=0.31
(e) AC=O
AC-H
=0.63
(f) AC=O
AC-H
=1.35
(a)
4000 3500 3000 2500 2000 1500 1000 500 100
90 80 70 60 50 40 30 20 10 0 -10
3397
2932 1738
1643
1371 1238 1161 1076
933
891
771
cm-1
T%
(b)
4000 3500 3000 2500 2000 1500 1000 500 100
90 80 70 60 50 40 30 20 10 0 -10
3397
2932 1738
1643
1371 1238 1161 1076
933
891
771
cm-1
characteristic signal for the protons of the –CH3
sub-stituent appears around 2ppm .
Figure 5 shows the acetylation pattern of the samples by H1 NMR. Three separate signals between
1.9 and 2.1 ppm were detected individually with the increase of DA, attributed to the methyl –proton groups of O-acetyl substituents in the different posi-tions of repeating units. Similar results have been taken for cellulose acetate in some solvents[32, 33]. The
signal at 2.01 ppm corresponds to the more reactive hydroxyl groups in agarose, probably the primary hydroxyls. As the degree of acetylation increases the signal at 1.94 ppm becomes more significant and the signal at 2.05 ppm maintains its relative intensity.
The determination of average acetylation degree (DA) by the traditional method of acetyl hydrolysis with sodium hydroxide followed by neutralisation ti-tration with hydrochloric acid[34] was not successful
for O-acetyl agarose samples, probably due to the removal by alkaline treatment of sulphate groups ini-tially present in agars, giving overestimated values for DA (results not published). The determination of DA per monomeric unit was estimated by the ratio between integration of –CH3 signal on modified
samples and the integral Iref of the two signals
be-tween 5 and 5.3 using the relation DA= 2ICH3/3Iref. A
relatively good linear relation was obtained between the DA determined by NMR and the ratio AC=O / AC-H
or AC=O / AOH (Table 1), as showed in Figure 6. These
calibration curves, following the equations DA = 0.36 x AC=O / AC-H
and DA = 0.76 x AC=O / AO-H
can be used for determination of average degree of acetylation from the Infrared spectra of O-acetyl aga-rose samples.
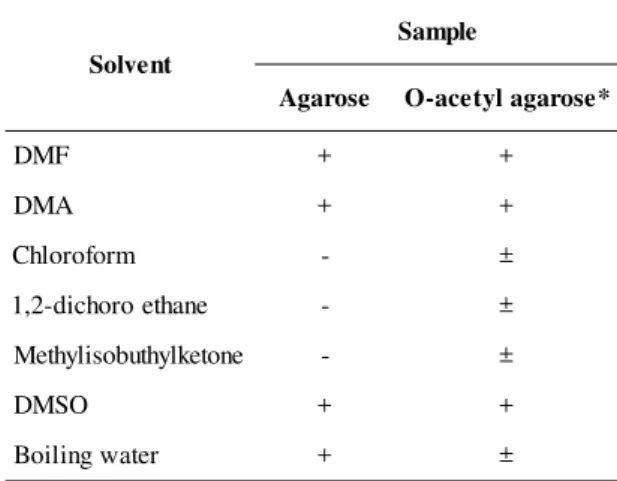
The solubility of agarose and its O-acetyl deriva-tives is illustrated in Table 2. No direct influence of the DA on solubility was observed for the samples studied. All O-acetyl agarose samples, in the two concentrations used (5 and 20 g/L), presented a better solubility in some organic solvents, as chloroform, methylisobuthylketone
Figure 4.1H NMR in DMSO at 80 °C for (a) agarose and (b) acetylated
agarose
Figure 5.1H NMR spectra of O-acetyl agarose samples at different
de-grees of acetylation.
5.4 5.0 4.6 4.2 3.8 3.4 3.0 2.6 2.2 1.8
(ppm)
b) a)
2.2 2.0 1.8
(ppm)
DA = 0.07
DA = 0.08
DA = 0.11
DA = 0.22
and 1,2-dichloroethane, than underivatized agarose. In addition, the solubility of these samples in boiling wa-ter was sensibly diminished.
The ability of O-acetyl agarose samples to form gel in water was also evaluated. After solubilization of the samples at 10 g/L concentration in boiling water, the insoluble fraction (and perhaps more substituted)
was separated through hot filtration. Afterwards, the clear solution was cooled down to room temperature. Comparing the gels obtained from agarose and O-acetyl agarose samples at 10 g/L (Table 3), with respect to how easily they break as hand pressed, the formation of weaker gels from acetylated samples especially with low DA (0.07 and 0.08) was observed. As the degree of acetylation increases, the gels become stronger, but yet weaker than initial agarose gels. To understand better these results, the intrinsic viscosity (Table 3) was de-termined for all samples.
The intrinsic viscosity in a good solvent (DMSO) for all O-acetyl agarose samples were smaller than for agarose. This means a decrease in molecular weight with the chemical modification of agarose. Although the insertion of acetyl groups leads to an increase in molecular weight, some degradation reac-tions can also occur. At low DA, this effect can over-come the first. Nevertheless, there is a tendency of
Table 1. Degree of acetylation and AC=O/AC-H and AC=O / AO-H ratio for
O-acetyl agarose samples.
Figure 6. Variation of degree of acetylation (DA) determined from 1H
NMR with the ratio AC=O / AC-H (<) or AC=O / AO-H (=) for O-acetyl
agarose samples.
Table 2. Solubility of agarose and O-acetyl agarosea.
Table 3: Properties of agarose and O-acetyl agarose.
0.0 0.2 0.4 0.6 0.8 1.0 1.2
0.0 0.2 0.4 0.6 0.8 1.0 1.2 1.4
DA
AC=O/Aref
e l p m a
S DA from NMR AC=O/AC-H AC=O/AO-H
h 5 . 0 A G
A 0.08 0.31 0.06
h 2 A G
A 0.07 0.31 0.07
h 4 A G
A 0.48 1.35 0.60
h 0 1 A G
A 0.22 0.63 0.15
h 0 2 A G
A 0.11 0.27 0.06
t n e v l o S e l p m a S e s o r a g
A O-acetylagarose*
F M
D + +
A M
D + +
m r o f o r o l h
C - ±
e n a h t e o r o h c i d -2 ,
1 - ±
e n o t e k l y h t u b o s i l y h t e
M - ±
O S M
D + +
r e t a w g n i l i o
B + ±
* All degree of substitution.
a (+) soluble; (-) insoluble; (±) partially soluble.
e l p m a S d n a e s o r a g a f o s e i t r e p o r P O S M D n i e l b u l o s e s o r a g a l y t e c a -O l y t e c a -O f o n o i t c a r f e h t f o s e i t r e p o r P r e t a w g n i l i o b n i e l b u l o s e s o r a g a R M N m o r f A
D [ηηηηη]
) g / L m
( k’ DA Stiffnessofthegel
e s o r a g
A — 112.7 0.45 — Verystrong
h 2 A G
A 0.07 58.2 0.40 0.08 Weak
h 5 . 0 A G
A 0.08 72.8 0.54 0.07 Veryweak
h 0 2 A G
A 0.11 98.2 0.42 — Strong
h 0 1 A G
A 0.22 65.4 0.47 0.06 Weak
h 4 A G
increasing intrinsic viscosity when the DA increases or time of reaction decreases. This evolution is not understood up to now, but it may be related to some heterogeneity in the substitution.
Comparing the characteristics of O-acetyl agar-ose gels (Table 3) with the corresponding intrinsic viscosities, and considering yet the partial solubility of the acetylated samples in water, the formation of weak gels for the acetylated samples with DA 0.07, 0.08 and 0.22 can be explained by the reduction of gelling molecules concentration and to a decrease in molecular weight, disturbing the coil – helix confor-mational transition and the critical overlap concen-tration C* for gelation respectively (as C*~[η]-1).
The Huggins constant (k’) determined from the equation ηreduced = [η] + k’ [η]2c, indicated good
solu-bility of the polymers in DMSO, since k’ was in the average range 0.3 – 0.5[35].
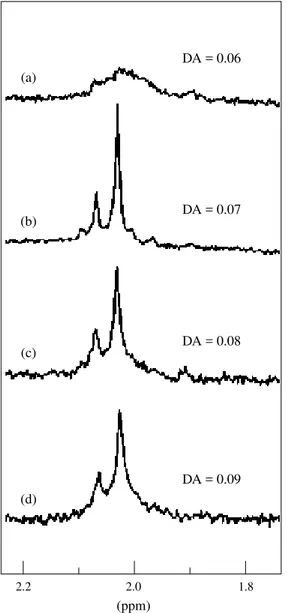
Certainly, the results shown above are related to the pattern of distribution of acetyl groups in the back-bone. Figure 7 shows the 1H NMR of the water soluble
fraction of O-acetyl agarose samples in the range of the acetyl signal (2.2 to 1.8 ppm). These polymers pre-sented at about the same DA of the original O-acetyl agarose samples after two hours reaction (Table 3), and a large signal at 2.02 ppm without any signal at 1.94 ppm. This result means that the solubility in wa-ter is attributed only to molecules of low degree of acetylation i.e. a maximum degree of acetylation of 0.09 and that the distribution of acetyl groups in the polymer is not homogeneous, probably related to the heterogeneous reaction system used. In addition, the degree of solubility (water soluble fraction yield) de-creases when the average degree of acetylation of the agarose increases.
Conclusion
O-acetyl agarose samples with low degree of acety-lation were prepared in heterogeneous conditions. These polymers presented a reduction both in the boiling water solubility and in the gel ability even with a DA as low as 0.07. On the other hand, the solubility in organic solvents, i.e. the hydrophobic character, was increased. A linear relation was obtained between the average degree of acetylation determined by H1 NMR and the
absorbance of carbonyl band in the Infrared spectra, indicating that the calibration curve proposed is a suit-able way to determine the DA by Infrared.
Acknowledgements
The authors are much grateful to Conselho Nacional de Desenvolvimento Científico e Tecnológico (CNPq, CNPq-RHAE, CNPq-PIBIC) for financial support and to J. Brugnerotto (CERMAV) for his technical help.
References
1. Araki, C. – Proc. Int. Seaweed Symp., 5, p.3 (1966).
2. Meer, W. – “Agar”, in: Handbook of Water–Soluble
Gums and Resins, cap.7, Davidson, R.L. (ed.), McGraw Hill Inc., New York (1980).
Figure 7.1H NMR spectra of O-acetyl agarose fractions solubilized in
boiling water. (a) from O-acetyl agarose 10h; (b) from O-acetyl agarose 0.5h; (c) from O-acetyl agarose 2h; (d) from O-acetyl agarose 4h.
2.2 2.0 1.8
(ppm) (a)
(b)
(c)
(d)
DA = 0.06
DA = 0.07
DA = 0.08
3. Andrade, C. T. & Garcia, R. B. - “Agarose
(Over-view)”, in: The Polymeric Materials
Encyclope-dia, p. 137, Salamone, J.C. (ed.), CRC Press Inc., Boca Raton (1996).
4. Kydonieus, A. G. - “Fundamental Concepts of
Con-trolled Release”, in: Controlled Release
Tech-nologies: Methods, Theory, and Applications, vol.1, p.1, Kydonieus, F. (ed.), CRC Press Inc., Boca Raton (1980).
5. Ferruti, P. & Tanzi, M. C., “New Polymeric and
Oligo-meric Matrices as DrugCarriers” in: CRC
Criti-cal Reviews in Therapeutics, vol.2, p.175, CRC Press Inc., Boca Raton (1986).
6. Zhu, K.J.; Hendren, R.W.; Jensen, K. & Putt, C.G. -Macromolecules, 24, p.1736 (1991).
7. Nathan, A.; Bolikal, D.; Vyavahane, N.; Zalipsky, S. & Koln, J. - Macromolecules, 25, p.4476 (1992).
8. Niekraszewicz, A. - Int. Polym. Sci. Technol., 21(3), p.90 (1994).
9. Storey, R.F. & Hickey, T.P. – Polymer, 35(4), p.830 (1994).
10. Abe, H.; Doi, Y. & Kumagai, Y., Macromolecules, 27, p.6012 (1994).
11. Löfgen, A.; Albertsson, A.-C.; Dubois, Ph.; Jérôme, R. & Teyssié, Ph. - Macromolecules, 27, p.5556 (1994).
12. Hayashi, T.; Nakanishi, E.; Iizuka, Y.; Oya, M. &
Iwatsuki, M. – Eur. Polym. J., 30(9), p.1065
(1994).
13. Degêe, Ph.; Dubois, Ph.; Jérôme, R. & Teyssié, Ph. – J. Polym. Sci.: part A, 31, p.275 (1993).
14. Kemnitzer, J. E.; McCarthy, S. P. & Gross, R. A. – Macromolecules, 25, p.5927 (1992).
15. Kanesawa, Y.; Tanahashi, N. & Saito, Y. - Polymer Degradation and Stability, 45, p.179 (1994).
16. Maulding, H. V. - J. Controlled Release, 6, p.167 (1987).
17. Oliveira, A. G.; Scarpa, M. V.; Bueno, J. H. F.& Evangelista, R. C. - Rev. Ciênc. Farm.,14, p.37 (1992).
18. Remuñán-Lopez, C.; Lorenzo,M. L.; Portero, A.; Vila
Jato, J. L. & Alonso, M. J. - “Site-specific drug
delivery using chitosan microparticles”, in:
Pro-ceedings of the 7th International Conference on
Chitin Chitosan and Euchis’97, p.600, Lyon – France, set (1997).
19. van Dijk-Wolthuis, W. N. E.; Hoogeboom, J. A. M.; van Steenbergen, M. J.; Tsang, S. K. Y. & Hennink, W. E. - Macromolecules, 30, p.4639 (1997).
20. McGee, J. P.; Singh, M.; Li, X.-M.; Qiu, H. & O’Hagan, D. T. - J. Microencapsulation, 14(2), p.197 (1997).
21. Quintanar-Guerrero, D.; Allémann, E.; Fessi, H. & Doelker, E. - Drug Dev. Ind. Pharm., 24(12), p.1113 (1998).
22. Mandal, T. K. – Drug Dev. Ind. Pharm., 24(7), p.623 (1998).
23. Giunchedi, P.; Genta, I.; Conti, B.; Muzzarelli, R. A. A. & Conte, U. – Biomaterials, 19, p.157 (1998).
24. Genta, I.; Costantini, M.; Asti, A.; Conti, B. & Montarani, L. – Carbohydr. Polym., 36, p.81 (1998).
25. Lee, S. C.; Oh, J. T.; Jang, M. H. & Chung, S. I. - J. Controlled Release, 59, p. 123 (1999).
26. Andreo Filho, N. & Oliveira, A.G. - Infarma, 9(1/5), p.18 (1999).
27. Cruaud, O.; Benita, S.; Benoit, J. P. – Int. J. Pharm., 177, p.247 (1999).
28. Dumitriu, S. – “Polymeric Biomaterials”, Marcel
Dekker Inc., New York (1994).
29. Goldberg, E. P.; Longo, W. & Iwata, H., “Hydrophilic
Albumin and Dextran Ion Exchange Microspheres
for Localized Chemotherapy”, in: Microsphere
Drug Delivery, Elsevier, Amsterdam (1984).
30. Lahaye, M.; Revol J. F.; Rochas C.; Mc Lachlan J. & Yaphe W. – Bot. Mar., 31, p.491 (1988).
31. Rochas, C.; Lahaye, M. & Yaphe, W. - Bot Mar., 29, p.335 (1986).
32. Kamide, K.; Okajima, K. & Saito, M. - Polym. J., 13, p.115 (1981).
33. Kamide, K. & Okajima, K. - Polym . J., 13, p.127 (1981).
34. Method ASTM D871-72 - American Society for Test-ing and Materials, part 21 (1975).
35. Tanford, C. – “Physical Chemistry of
Macromol-ecules”, John Wiley & Sons, New York, 1961.