(Annals of the Brazilian Academy of Sciences) ISSN 0001-3765
www.scielo.br/aabc
Spatial changes in the water quality of
Itajaí-Açú Fluvial-Estuarine System, Santa Catarina, Brazil
JURANDIR PEREIRA-FILHO1, LEONARDO R. RÖRIG2, CARLOS A.F. SCHETTINI3, MARIANA A. SOPPA4, BRUNO L. SANTANA1 and JOSÉ EDUARDO DOS SANTOS5
1Universidade do Vale do Itajaí, CTT Mar, Rua Uruguai, 458, 88302-202 Itajaí, SC, Brasil 2Laboratório de Ficologia, Departamento de Botânica, Universidade Federal de Santa Catarina
Campus Universitário, Trindade, Caixa Postal 476, 88040-900 Florianópolis, SC, Brasil 3Instituto de Ciências do Mar, LABOMAR, Universidade Federal do Ceará
Av. da Abolição, 3207, Meireles, 60165-081 Fortaleza, CE, Brasil
4Centro Regional Sul de Pesquisas Espaciais, Instituto Nacional de Pesquisas Espaciais, INPE Av. Roraima, 1000, Camobi, 97105-970 Santa Maria, RS, Brasil
5Universidade Federal de São Carlos, PPG ERN, Rod. Washinton Luiz, km 235, 13565-905 São Carlos, SP, Brasil
Manuscript received on March 3, 2009; accepted for publication on April 26, 2010
ABSTRACT
This study was carried out with the aim of evaluating the spatial variation of the water quality in the Itajaí-Açú River estuary. Seven stations along the estuary were monitored on a weekly basis, from October 2003 to December 2004, plus two stations in tributaries (Itajaí-Mirim River, the main tributary, and one reference station). This monitoring included measurements of salinity, pH, dissolved oxygen, temperature, nutrients (NH+
4, NO−2, NO−3, PO34−, H4SiO4), Biochemical Oxygen Demand (BOD), total phosphorous and dissolved organic phosphorus (TP and DOP), particulate organic carbon (POC), suspended particulate matter (SPM) and chlorophyll-a (Cla). Multivariate analyses demon-strated the compartmentalization of the system based on the deterioration in water quality and marine influence. Urban development was the main factor responsible for the spatial variation of the monitored variables, resulting in increases in the indicators for organic matter and a progressive decrease in O2. Despite the effect of dilution by marine influence, there was an increase in ammonium, attributed to the influence of the municipal districts of Itajaí and Navegantes, close to the river mouth.
Key words:Itajaí Estuary, nutrients, organic matter, river, Santa Catarina.
INTRODUCTION
Estuaries are defined as restricted bodies of water in which the seawater is diluted, in a measurable way, by the fresh water (Pritchard 1967). These environments are generally located in places with high population den-sities and, as a result, they have been extensively ex-ploited and destroyed, although they still remain one of the most resilient environments on Earth (Elliot and McLusky 2002). Particles and dissolved material, as
Correspondence to: Jurandir Pereira Filho E-mail: [email protected]
well as the biota itself, are transported from the fresh water to the salt water over relatively short distances.
(Diaz 2001, Rowe 2001) as the result of the high O2
consumption to oxidize the surplus of organic matter. The coastal systems are densely populated areas in general and receive the influence directly from human activities that originate in the drainage basins (C.H.A. Ribeiro, unpublished data). The environmental impact of this influence depends on the type and amount of present substances, which are related to the type of ac-tivity of the drainage basin. Regions with high popu-lation densities are continually throwing organic matter and nutrients into their water bodies. Industrial regions throw heavy metals, hydrocarbons and organic matter on them. Agricultural activity has contributed to the entry of many compounds to the water bodies with fer-tilizers (rich in nutrients), pesticides and herbicides (C.H.A. Ribeiro, unpublished data).
In this context, the aim of this study is to determine how the water quality is modified along the Itajaí-Açú River estuary from its source, where there is no tidal influence, to its mouth, around 90 km downstream, asso-ciating this variation with the main activities carried out in its drainage basin.
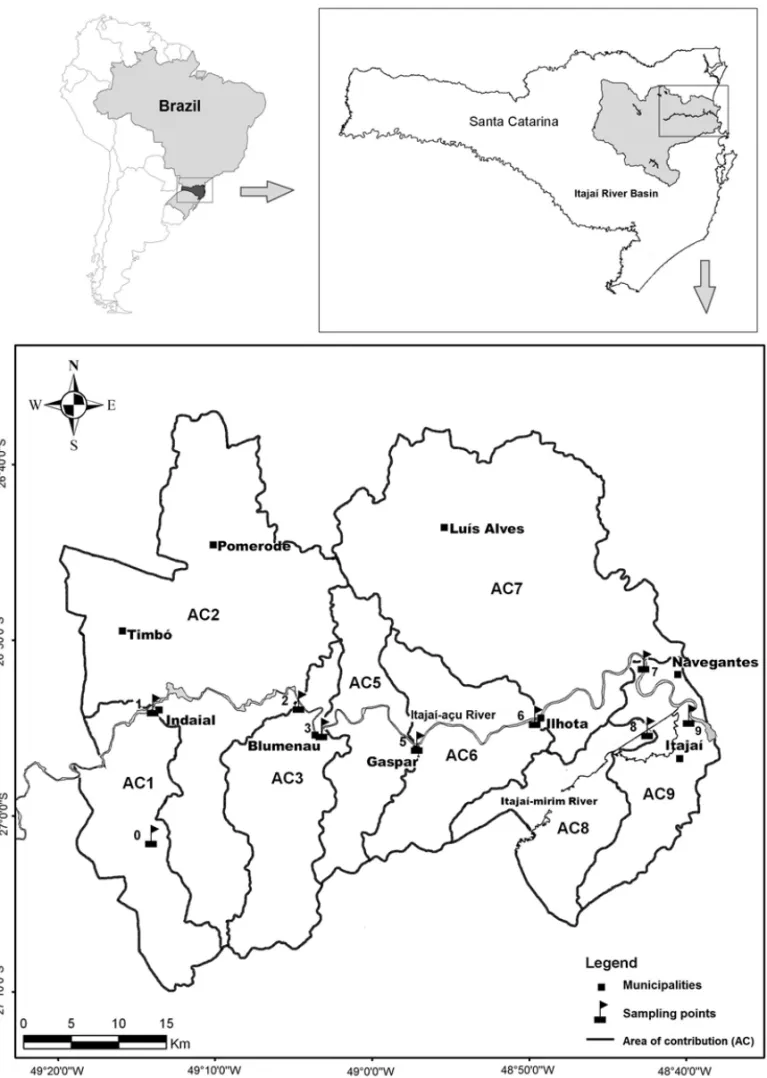
AREA OFSTUDY
The Itajaí-Açú River estuary is located in the South Brazil, 26.9◦S and 48.66◦W, in the State of Santa
Cata-rina. Its hydrographic basin comprises an area of about 15,500 km2, which is close to 16% of the state area. The
climate of the region, according to Köpen’s classifica-tion, is humid subtropical without hydric deficit and with well-distributed rainfall throughout the year (Cfa). The average temperature in the region is higher than 18◦C, with annual average rainfall and
evapotranspira-tion of about 1400 mm and 1080 mm, respectively (Gaplan 1986).
The Itajaí-Açú River represents about 90% of the fluvial inflow to the estuary, with the remainder being attributed to smaller affluents such as the Luiz Alves and Itajaí Mirim Rivers. The average long-term discharge of the Itajaí-Açú River, which measured about 90 km upstream from the river mouth, is near 228 m3.s−1, with
minimum and maximum values of 17 m3.s−1and 5390
m3.s−1, respectively(Schettini 2002a).
Port of Itajaí and many fish processing factories are located around the mouth of the estuary. The final
portion of the lower estuary is continually dredged to maintain the navigation channel and the access to the port. The port region is of great economic importance and is the main shipping route in the state. It also has the largest fishing port in the country (Schettini 2002a). Due to the occupation of its drainage basin, the main polluting agents of the river are sanitary waste, solid garbage and the throwing of industrial wastewater, par-ticularly from the textile, metallurgy and galvanoplastic industries.
MATERIALS AND METHODS
LANDUSE
To assist in the characterization and interpretation of the results, maps of land use were used, for the final portion of the basin from the town of Indaial, which is considered by this study as the point of entry to the sys-tem. The characterization of land use was based on to-pographical maps of the IBGE of 2004 (scale 1:50.000) and Landsat satellite’s images from 2002 in the composi-tion RGB-453. The study area was divided into sub-units (Fig. 3), which represent areas of contribution or direct influence on the different collection stations (#1, #2, #3, #5, #6, #7, #8 and #9) and are termed the area of contri-bution (AC) (Rörig 2005).
SAMPLING
plan also included a station 4 located in a tributary of the Itajaí-Açú River, but it was not sampled during the monitoring, which explains its absence in the sequence of sample stations.
ANALYTICALMETHODS
At the time of sampling, salinity, temperature, pH and dissolved oxygen were determined, using a Horiba U-10 multianalyzer. In the laboratory, the samples were filtered in precalcinated Whatmann GF/F fiberglass fil-ters (approximate porosity of 0.7µm). The filtered
ma-terial was separated into aliquots and frozen for subse-quent determination of the nutrients through the tradi-tional colorimetric methods. After drying in an oven (65◦C), the filters were frozen for subsequent
determina-tion of the particulate organic carbon (POC). Fracdetermina-tions of the raw, filtered samples were digested by the potas-sium persulfate autoclave method to determine the to-tal organic phosphorus (TOP) and toto-tal dissolved phos-phorous (TDP), according to Grasshoff et al. (1983). Aliquots of the raw samples were incubated at 20◦C
to determine the BOD5, according to
APHA-AWWA-WPCF (1998).
The dissolved nutrients (NH+
4, NO−2, NO−3, PO34−
and H4SiO4) were determined for the filtered sample
using the traditional colorimetric methods, based on Strickland and Parsons (1972). The ammonium was de-termined using the indophenol blue method. The nitrite and nitrate were determined using the Griess reaction af-ter reducing the nitrate to nitrite in a cadmium column prior to determination. The phosphate was determined after the addition of ammonium molybdate and ascor-bic acid. The silicon was determined after the forma-tion of a reduced silicomolybdate blue complex. All of them were read in a UV 160 A Shimadzu UV-V spec-trophotometer.
To determine the SPM, aliquots of known volumes of water samples were filtered in pre-weighted filters of cellulose ester membrane with porosity of 0.45µm.
After filtering, the filters were dried in an oven at 60◦C
for 24 hours, and weighed again. The SPM was obtained by the difference in weight before and after filtering in relation to the filtered volume.
The organic matter was estimated based on the determination of BOD5and particulate organic carbon.
The BOD5 was determined for the raw water
accord-ing to the method adapted from APHA-AWWA-WPCF (1998). The particulate organic carbon was determined for the material trapped in the filters (Whatman GF/F, porosity of 0.7µm). At the time of determination, the
filters were digested with sulfuric acid and excess of potassium dichromate. After digestion, the excess of dichromate was tritiated against an ammonium iron sul-phate solution, according to Carmouze (1994).
The total and dissolved phosphorus was deter-mined from aliquots of the raw and filtered sample, to obtain the total phosphorous (TP) and dissolved phos-phorous (DP). The samples were digested by the potas-sium persulfate autoclave method at 120◦C for 45
min-utes. After digestion, the phosphate was determined col-orimetrically as orthophosphate after reacting with am-monium molybdate according to Carmouze (1994). The dissolved organic phosphorous (DOP) was determined by the difference between the dissolved phosphorous (determined in the filtered sample after digestion) and the phosphate ions.
To determine the chlorophyll-a, aliquots of a known volume of samples were filtered in a GF/F fiberglass filter with a 25 mm diameter and the filters were ex-tracted with 10 mL of 90% acetone (v/v) for 24 hours in darkness, inside the freezer (–15◦C) (Parsons et al.
1989). The extracted samples were read in a Turner Designsr TD-700 fluorometer. For its calibration, a Skeletonema costatummicroalgae culture was used in
exponential growth.
STATISTICALANALYSIS
Due to the large amount of obtained data obtained, and to assist in their interpretation, the data were analyzed through 2 multivariate techniques: Cluster analysis and the technique of ordering through principal components analysis (PCA). The analyses were carried out on the standardized data matrix by the average and standard deviation according to Clarke and Warwick (2001). The analyses were initially carried out considering all the stations sampled in the 56 campaigns, including all the monitored variables (Table I).
en-TABLE I
Abbreviations of the variables used in the multivariate analyses. In the spatial analysis, the overall average of each variable was used,
in each station. In the temporal analysis, the overall average of each variable was used,
for each sampling campaign. Abreviation Variable
Cla md Chorophylla
COP md Particulated Organic Carbon DBO md Biochemical Oxygen Demand Dsc md Average of River Discharge,
including the day of sampling and the two days before it MPS md Particulated Suspended Material N:P md DIN:PO4 Ratio
NH4md Amonium NO2md Nitrite NO3md Nitrate
OD md Dissolved Oxygen
pH md pH
PO4md Phosphate Ions
POD md Dissolved Organic Phosphorus POT md Total Organic Phosphorus PT md Total Phosphorus Sal md Salinity
Sat md Saturation of Oxygen (%) Si md Silicate
Temp md Temperature
vironmental variables are included (Clarke and Warwick 2001) for the interpretation of ecological data. The Clus-ter method was the Ward method, or ClusClus-ter method by minimum variance.
RESULTS
LANDUSE
The estuary of the Itajaí-Açú River is situated in the final portion of the Itajaí River basin. This region in-cludes the towns of Indaial, Blumenau, Gaspar, Ilhota, Luis Alves, Itajaí and Navegantes (Table II). The area of study was classified based on land use and occupation, considering 6 classes of land use: native forest, urban area, creeping vegetation (including cultivated areas), reforestation area, exposed soil and water bodies (Rörig 2005). The area of the final portion of the drainage basin covered by the estuary was about 2500 km2, which
is equivalent to 16% of the Itajaí River basin. This to-tal consists of: 60,5% native forest, 7,6% urban area, 26,6% areas with creeping vegetation (mainly agricul-ture), 1,4% exposed soil, 2,1% areas of reforestation, and 0,7% water courses. The values for the areas of each class of land use considered in each area of con-tribution are shown in Table III.
Urban development and agriculture are two types of land use in each area of contribution that potentially exert a greater influence over the quality of water in the system. Concerning the urban development, it is worth mentioning that the area found in AC 2 and 3 which cor-responds to the town of Blumenau, and those located in AC 7 and 9 to the towns of Itajaí and Navegantes. Regarding the agriculture, although no specific classifi-cation has been done for this use, it is within the region of ground vegetation, which is found mainly on the banks of the Itajaí River estuary. The main agricultural activity practiced in the region is irrigated rice farming (Icepa 2005), which occurs on the coastal plain of the Itajaí Basin, in the region of Gaspar, Ilhota and Itajaí, which is the area of this study (Table II).
RIVERDISCHARGE
The river discharge in Indaial (station #1 of the moni-toring) presented an average of 204,2 m3/s, varying
be-tween 48,5 and 1938 m3/s in the monitored period.
De-spite the high variability most of the time, the discharge was low (mode = 83,4), with sporadic peaks of high dis-charge. This was the case of December 2003 and July, September and October 2004. These peaks of high dis-charge were interspersed by prolonged periods of low discharge.
PHYSICAL-CHEMICALVARIABLES
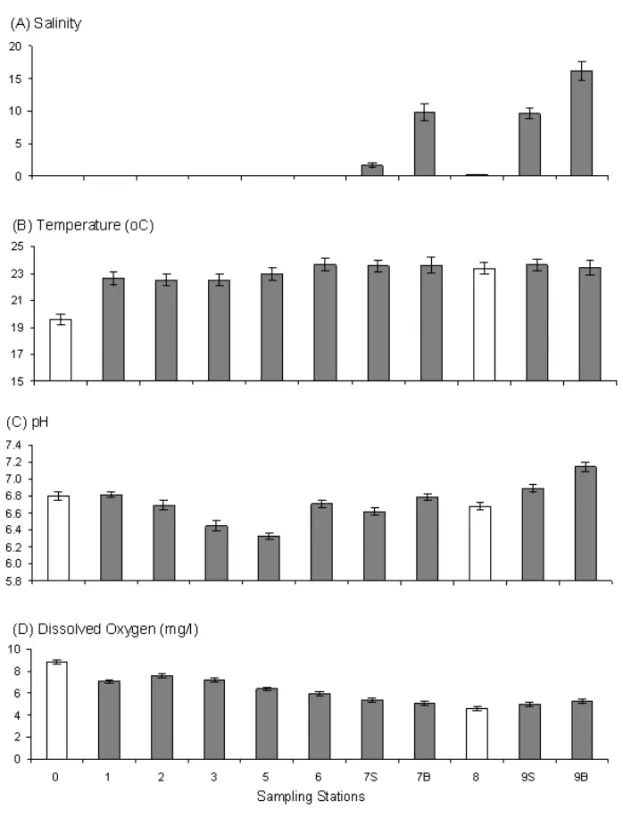
Table IV shows a summary of the average results ob-tained at the sampling stations during the studied pe-riod. The spatial variability of the salinity reflected the marine influence in the estuary. The stations that were directly subject to the marine influence (#7 and #9) pre-sented average salinity ranging from 0 to 16, with higher values always recorded at the bottom due to saline intru-sion (Fig. 2A). The average water temperature during the monitored period varied from 19,6 to 26,4◦C. The
TABLE II
Socio-economic indicators for the municipal districts of the region around the Itajaí estuary. Source: IBGE (2004), ICEPA (2005), PNUD (2003).
Total
Area Demographic Rural Urban Rice culture Main District population
(km2) density population population area (ha) culture (ha)
(2000) (2000) (2000) (2000) (2002) (2002)
Blumenau 261,808 510.3 513.0 19,865 241,943 40 Maize (500)
Brusque 76,058 280.6 271.1 2,802 73,256 125 Manioc (250)
Gaspar 46,414 369.8 125.5 16,813 29,601 3,200 Rice (3.200)
Ilhota 10,574 245.2 43.1 4,129 6,445 2,100 Rice (2.100)
Indaial 40,194 429.9 93.5 1,812 38,382 240 Rice (240)
Itajaí 147,494 303.6 485.8 5,544 141,950 2,020 Rice (2.020)
Luiz Alves 7,974 260.8 30.6 5,850 2,124 550 Banana (3.900)
Navegantes 39,317 119.3 329.6 2,667 36,650 736 Rice (736)
Total 629,833 2519.5 – 59,482 570,351 9,011 –
Media – 314.9 236.5 7,480 71,294 – –
Total Santa Catarina 5,356,360 95,285 – 1,138,429 4,217,931 137,340* –
Media Santa Catarina – – 56.1 3,885 14,395 – –
*In 2004, the total area of rice culture in Santa Catarina increased to 151,800 ha.
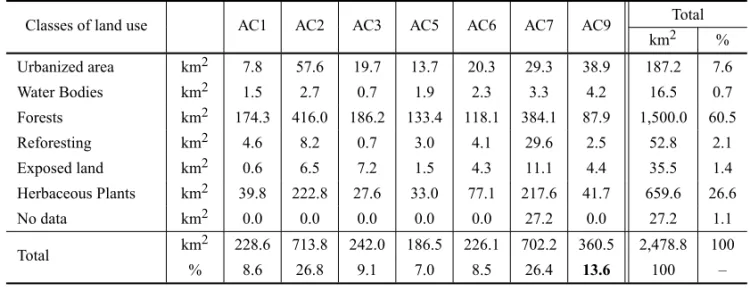
TABLE III
Areas and classes of land use in each area of contribution (AC) in the terminal region of the Itajaí River basin.
Classes of land use AC1 AC2 AC3 AC5 AC6 AC7 AC9 Total
km2 %
Urbanized area km2 7.8 57.6 19.7 13.7 20.3 29.3 38.9 187.2 7.6
Water Bodies km2 1.5 2.7 0.7 1.9 2.3 3.3 4.2 16.5 0.7
Forests km2 174.3 416.0 186.2 133.4 118.1 384.1 87.9 1,500.0 60.5
Reforesting km2 4.6 8.2 0.7 3.0 4.1 29.6 2.5 52.8 2.1
Exposed land km2 0.6 6.5 7.2 1.5 4.3 11.1 4.4 35.5 1.4
Herbaceous Plants km2 39.8 222.8 27.6 33.0 77.1 217.6 41.7 659.6 26.6
No data km2 0.0 0.0 0.0 0.0 0.0 27.2 0.0 27.2 1.1
Total km2 228.6 713.8 242.0 186.5 226.1 702.2 360.5 2,478.8 100
% 8.6 26.8 9.1 7.0 8.5 26.4 13.6 100 –
lower temperatures. The greatest ranges were recorded for station #0, in Indaial, due to the shallow depth of the Warnow River (Fig. 2B).
The pH throughout the estuary presented an overall average of 6,7, with minimum and maximum specific values of 4,5 and 7,9, respectively. In general, the pH was lower in stations #3 and #5. On the other hand, an increase in pH was observed in the Stations #7 and #9, due to the marine influence (Fig. 2C).
The concentrations of dissolved oxygen presented
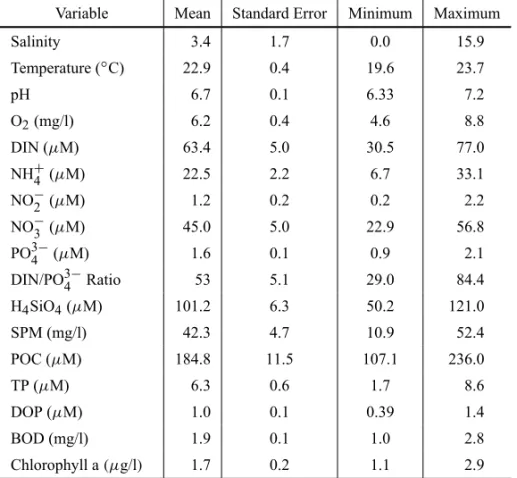
TABLE IV
Summary of the results obtained in the Itajaí River estuary, in samples carried out in 2003 and 2004. The averages, standard, minimum and maximum
errors were calculated among the averages obtained for the sampling stations.
Variable Mean Standard Error Minimum Maximum
Salinity 3.4 1.7 0.0 15.9
Temperature (◦C) 22.9 0.4 19.6 23.7
pH 6.7 0.1 6.33 7.2
O2(mg/l) 6.2 0.4 4.6 8.8
DIN (µM) 63.4 5.0 30.5 77.0
NH+
4 (µM) 22.5 2.2 6.7 33.1
NO−
2 (µM) 1.2 0.2 0.2 2.2
NO−
3 (µM) 45.0 5.0 22.9 56.8
PO3−
4 (µM) 1.6 0.1 0.9 2.1
DIN/PO3−
4 Ratio 53 5.1 29.0 84.4
H4SiO4(µM) 101.2 6.3 50.2 121.0
SPM (mg/l) 42.3 4.7 10.9 52.4
POC (µM) 184.8 11.5 107.1 236.0
TP (µM) 6.3 0.6 1.7 8.6
DOP (µM) 1.0 0.1 0.39 1.4
BOD (mg/l) 1.9 0.1 1.0 2.8
Chlorophyll a(µg/l) 1.7 0.2 1.1 2.9
NUTRIENTS
Dissolved Inorganic Nitrogen (DIN)
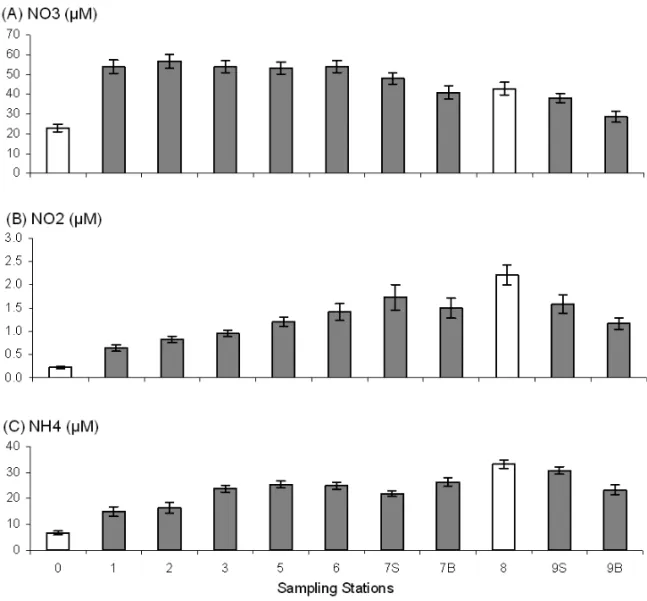
The dissolved inorganic nitrogen (DIN), which means the sum of ammoniac nitrogen (N-NH+
4), nitrite
(N-NO−
2) and nitrate (N-NO−3), varied from 11,0 to
175,0µM. The main form of DIN, in general, was NO−3,
particularly in the stations at the fluvial extremity of the estuary. The NO−
3, which varied from 5,3 to 135,6µM,
showed a tendency to decrease towards the mouth of the estuary (Fig. 3A) in the stations influenced by the sea-water (#7 and #9). Compared with station #0, the other stations presented much higher concentrations of NO−
3
(Fig. 3A). The NO−
2 was the nitrogenated nutrient that
pre-sented the lowest concentrations, varying between 0,1 and 10,6µM in the estuary. On average, the NO−2 tended
to increase towards the mouth of the estuary, ranging from an average of 0,6µM in station #1 to 1,7µM in
station #7 (Fig. 3B).
The NH+
4 presented concentrations ranging from
1,3 to 99,8µM in the estuary. The highest
concentra-tions were recorded in staconcentra-tions #1 and #2 in a specific situation in July 2004. However, the general variation trend in NH+
4 was to increase spatially after the town of
Blumenau (stations #2 and #3) and close to the mouth (Fig. 3C).
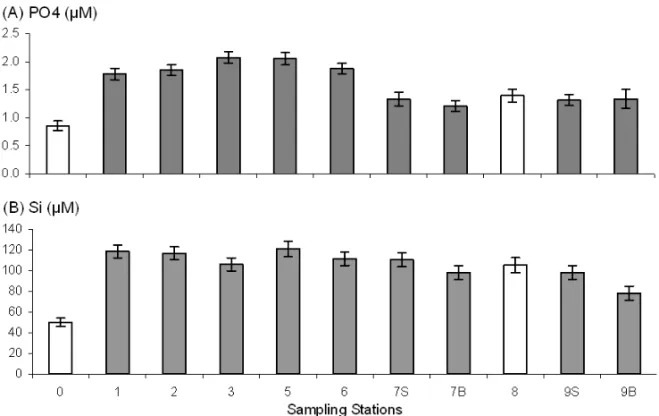
Phosphate and silicate
The dissolved inorganic phosphorous, which is repre-sented by the phosphate ions (PO3−
4 ), ranged from 0,1
to 6,2µM. The general variation trend in PO34−showed
a decrease in the stations close to the mouth, which suf-fered a mixture of seawater, as in stations #7 and #9 (Fig. 4A).
The origin of the dissolved silicon, normally pres-ent in the form of orthosilicic acid (H4SiO4), is related
Fig. 2 – Spatial variation of (A) salinity, (B) temperature, (C) pH and (D) dissolved oxygen in the fluvial-estuarine system of the Itajaí-Açú River. Overall average and Standard Error for each sampling station, considering the entire period sampled (October 2003 to December 2004). The columns in gray represent the stations located in the estuary, and the others in the tributaries.
standard of spatial variation of Si was observed, and the average concentrations were similar among the stations (Fig. 4B). However, all the stations presented much higher Si concentrations than those of the refer-ence station (#0) (Fig. 4B). Although the spatial vari-ation of Si was apparently low, temporally it presented high variability, with concentrations ranging from 15 to 260 µM. These data are described in a separate work
(J. Pereira Filho et al., unpublished data).
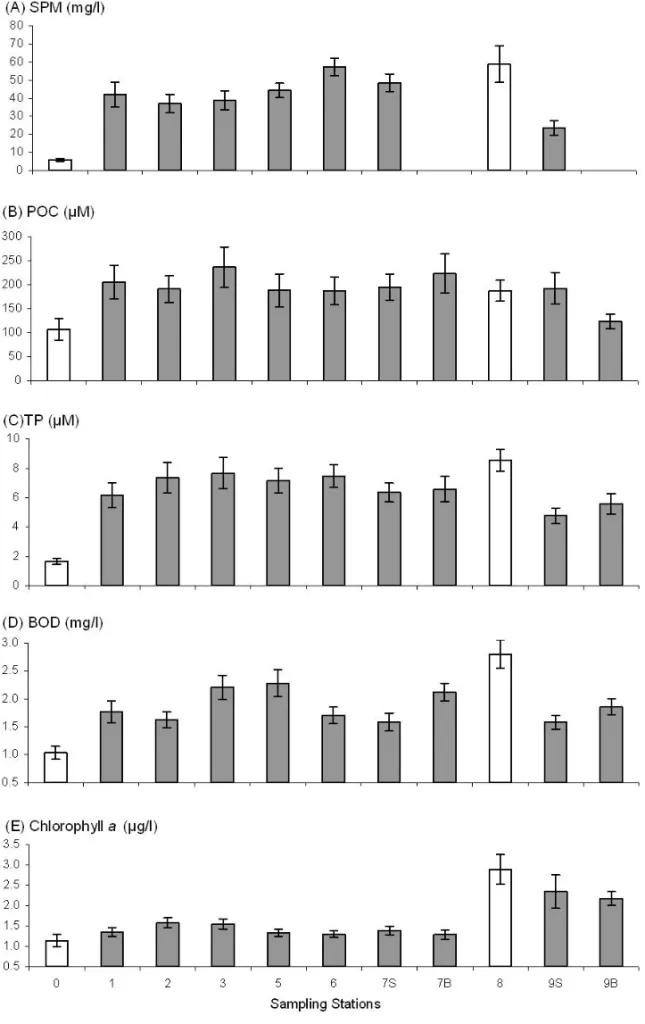
ORGANICMATTER ANDSUSPENDED PARTICULATEMATTER(SPM)
SPM
Fig. 3 – Spatial variation of (A) nitrate, (B) nitrite and (C) ammonium in the fluvial-estuarine system of the Itajaí-Açú River. Overall average and Standard Error for each sampling station, considering the entire period sampled (October 2003 to December 2004). The columns in gray represent the stations located in the estuary, and the others in tributaries.
Particulate Organic Carbon (POC)
The particulate organic carbon (POC) presented aver-age concentrations ranging from 107 to 222µM
through-out the Itajaí estuary (Fig. 5B). No clear standard of spatial variation was observed, as demonstrated by the variation in averages for each station.
Phosphorous
The total phosphorous (TP) corresponds to all the forms of phosphorous that are present in the water, includ-ing the organic and inorganic forms, both particulate and dissolved. The TP presented an overall average of 6,2µM, varying from 0,3 to 45,5 µM throughout the
sample stations. Spatially, no major differences were observed in TP among the sample stations, but a small decrease can be noted at the estuarine extremity of the estuarine (Fig. 5C).
The dissolved organic phosphorous (DOP), making up around 17% of the TP, presented an average concen-tration of 1,1µM, ranging from values close to zero to
8,4µM. The standard variation in DOP was similar to
the variation in TP, temporally and spatially.
Biochemical Oxygen Demand (BOD)
The biochemical oxygen demand (BOD) is a variable that indicates the concentration of organic matter in aquatic systems. In the sampled period, the BOD was moni-tored between April and December 2004. In this period, the BOD presented an overall average of 1,9 mg/l, vary-ing from 0,2 to 6,5 mg/l O2. Spatially, an increase in
Fig. 4 – Spatial variation of (A) phosphate (PO3−
4 ) and (B) orthosilicic acid (H4SiO4) in the fluvial-estuarine system of the Itajaí-Açú River. Overall average and Standard Error for each sampling station, for the entire period sampled (October 2003 to December 2004). The columns in gray represent the stations located in the estuary, and the others in tributaries.
CHLOROPHYLL-A
Chlorophyll-a presented low values throughout the es-tuary, for most of the study period, with measurements ranging from<0,1 and 16,5µg/l and an overage
aver-age of 1,7µg/l, but generally below 2,0µg/l (Fig. 5E).
For the stations situated close to the mouth of the es-tuary, the chlorophyll-a presented more significant con-centrations in some stations. The highest of these oc-curred at the beginning of September, when the chloro-phyll reached 16,5µg/l. These low concentrations are
the result of the high turbidity in the estuary, which re-sults in low light intensity throughout the water column.
DATAANALYSIS
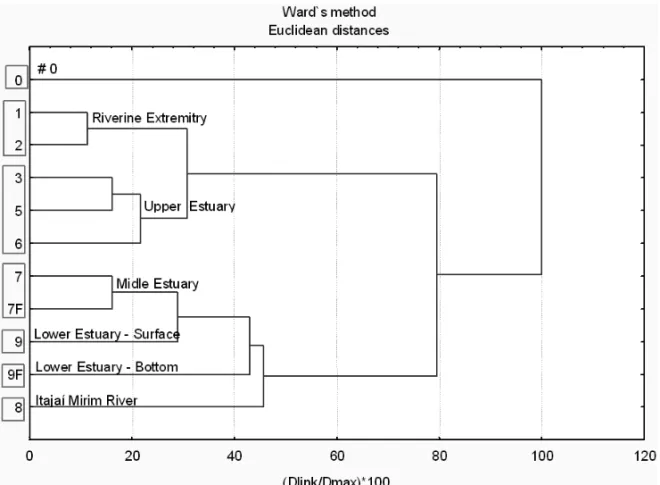
Cluster analysis
The analysis shown in the form of a dendrogram (Fig. 6) resulted in the Cluster of sampling stations, which demonstrated similar behavior for the monitored vari-ables. These Clustered stations were, therefore, treated as a whole and denominated compartments.
The first main trend observed is the separation of station #0 from all the other compartments. With the exclusion of station #0, 2 more clusters of stations were
identified; the first one consisted of stations #1, #2, #3, #5 and #6 and the second, stations #7, #7F, #8, #9 and #9F (Fig. 6).
The first-formed Cluster corresponded to the flu-vial portion of the system and was divided into 2 sub-groups, one including stations #1 and #2 and the other, stations #3, #5 and #6 (Fig. 6). The first subgroup, which included the stations further upstream from the system, corresponded to the compartment termed here as the Fluvial Extremity. The second subgroup, which included #3, #5 and #6, was called the Upper Estuary compartment.
The second major group included the stations fur-ther downstream from the system, which are influenced by the effect of salinity. Within this group, station #8 was clearly isolated from the others in that it repres-ented the Itajaí-Mirim River, which is a tributary of the Itajaí River and was called the Itajaí-Mirim compartment. Station #9F was isolated from the others, which
corre-sponds to bottom samples of the estuarine extremity of the system that are heavily influenced by the seawater. This compartment corresponds to the Lower Estuary – Bottom. The surface samples of station #9were, then,
partments. Finally, the subgroup comprised of stations #7 and #7F was termed the Middle Estuary compartment. The subgroups formed by the cluster analysis are shown in Table V and Figure 6. The denominations Upper, Middle and Lower Estuary are in accordance with those proposed by Schettini (2002a) based on the distribution of salinity in the estuary. The main characteristics are shown in Table IV.
Ordering analysis
The principal components analysis (PCA) was applied to the same data matrix as that used in the cluster anal-ysis. The factoral axes were calculated based on Pear-son’s r correlation matrix among the variables. The first two factoral axes of the ordering were interpreted, which explains 77% of the total variance of the data. The plane formed by factorial axes 1 and 2 showing the ordering of the variables is shown in Figure 7 (mode R). The order-ing of the samples (mode Q) is shown in Figure 8.
•Axis 1
The first component was formed by the positive coor-dinates of the variables dissolved oxygen (in concentra-tion and saturaconcentra-tion) and pH. At the negative extremity, there are the variables TDP, TOP and TP, temperature, SPM, NH+
4, NO+2, BOD, POC and Si.
The distribution of the samples along axis 1 corrob-orated the result of the cluster analysis, which discrimi-nates station #0at the positive extremity of the axis from
the others. Stations #1, #2 and #9F were also at the pos-itive end, but closer to the center. Station #8 was at the negative end, located in the Itajaí-Mirim River, together with stations #3, #5, #6, #7 and #7F, which were also at the negative end, close to the center.
This first axis shows the main difference in charac-teristics of station #0in relation to the other collection stations of the study. It also reflects the variation in wa-ter quality throughout the estuary, with station #0being presented by the high levels of dissolved oxygen and the lower values for organic matter (TOP, BOD, POC), particulate matter (SPM, TP) and nutrients and lower temperatures. In contrast, station #8 (Itajaí-Mirim River) had the worst indicators of water quality in the study. The other stations were positioned somewhere between these two extremes.
•Axis 2
The second axis was positively linked to salinity, pH, chlorophyll, nitrite, ammonium and N:P ratio. Dissolved oxygen, phosphate, nitrate and Si were at the negative extremity.
Concerning the collection stations, the structure seen in the cluster analysis once again repeated itself, with the stations at the fluvial extremity of the Itajaí River (#1 and #2) and Upper Estuary (#3, #5 e #6) be-ing at the negative side of the axis. The stations of the Middle Estuary (station #7 and #7F), Itajaí-Mirim (sta-tion #8) and Lower Estuary were on the positive side. The axis is, therefore, reflected in the gradual influence of salinity the closer the stations were to the mouth of the estuary, with an increase in salinity, pH and chloro-phyll-a, and a decrease in Si, nitrate and phosphate. By contrast, the ammonium and nitrate tended to increase in the Lower Estuary and Itajaí Mirim River, remaining on the positive side of the axis.
DISCUSSION
The influence of the seawater on the distribution of nutri-ents and organic matter in estuarine and coastal systems generally results in a decrease in the concentrations of these compounds as the salinity increases (Gago et al. 2005, Pereira Filho et al. 2001, 2002, Schettini et al. 2000, Cabeçadas et al. 1999, Morris et al. 1995). This decrease may be conservative due to the dilution (when it occurs in a form that is linearly proportional to the increase in salinity), or non-conservative (when the de-crease does not linearly follow the inde-crease in salinity). The standard of variation occurs because the origin of these compounds, whether natural or anthropogenic, is generally associated with the drainage basin. However, this standard can be modified if there is significant an-thropogenic inflow throughout the salinity gradient due to activities carried out in the in the surrondings of the water body. The non-passive use of the land (agriculture, urbanization) in the areas near the water bodies results in increases in the entry of particulate and dissolved matter to the system and, therefore, in the decrease of quality of the water in the water body (Basnyat et al. 1999).
Fig. 6 – Dendrogram showing the clusters formed based on the cluster analysis carried out on the measurements of variables in each collection station, in the Itajaí-Açú River estuary. The clustered stations correspond to the compartments of the estuary, from its fluvial extremity in the municipal district of Indaial (station 1), to the river mouth (station 9). The station #0 was also included.
studied area is still native forest, it is concentrated mainly in the higher regions of the basin. The main activities of anthropogenic influence and with greatest potential impact, such as urban development and agriculture, are concentrated mainly on the banks of Itajaí River and estuary. The urban areas include the regions of Blume-nau and Gaspar, in the region of the Upper Estuary and Itajaí and Navegantes, at the river mouth (Fig. 1).
The standard of spatial variation for the variables, which are indicative of water quality, reflected the influ-ence of the activities carried out in the surroundigs, in particular urban development, as well as the marine in-fluence at the estuarine extremity of the system. The Itajaí estuary is a stratified system of saline intrusion type (Schettini et al. 1996), such that seawater pene-trates from the bottom and forms the saline intrusion. During the period of the study, the direct influence of seawater was observed up to station #7, about 17 km upstream from the mouth, particularly at the bottom. This trend follows Schettini (2002b), according to whom the saline intrusion extends up to 30 km upstream from
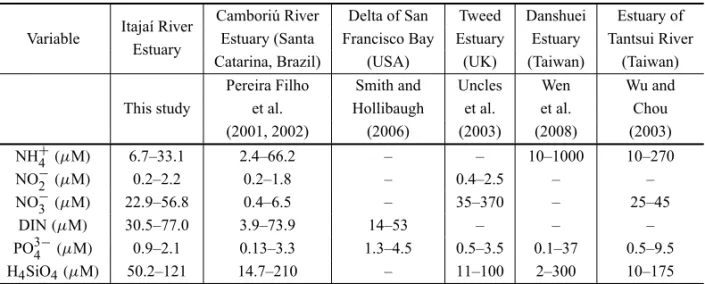
the mouth. In the following station (station #6), located 36 km from the mouth, no influence of salinity was ob-served, with the presence of freshwater throughout the study (Fig. 2A). Thus, an initial distinction can be made for the studied system, with stations #0, #1, #2, #3, #5 and #6 presenting only river water, and stations #7 and #9 suffering from the effect of the mixture of sea-water and freshsea-water. It is important to emphasize that the stations #1, #2, #3, #5, #6, #7 and #9 were located along the main flow of the estuary. Station #0 is a flu-vial station sampled only as a reference station, which means a blank point, as it evaluates the quality of the water in a site that suffers little impact. Station #8 is located in the Itajaí Mirim River, which is the main tributary of the estuary and flows out into the main river between stations #7 and #9 (Fig. 1). In general, the nutrient concentrations in this paper are in the range of another subtropical estuarine systems in the world (Table VI).
TABLE V
Main characteristics of the individual compartments by cluster analysis, and the stations included in each compartment. Sampling stations Names Characteristics
Blank Point #0 •High levels of
dissolved oxygen.
•Low concentrations of
nutrients, organic matter, SPM and Chlorophyll-a Riverine #1 and #2 •Low pH and Chlorophyll-a.
Extremity •High concentrations of nitrate,
Higher Estuary #3, #5 and #6 phosphate, silicate and SPM. Middle Estuary #7 and #7F •Influence of salinity.
•High pH.
Lower Estuary #9 •High concentrations of
– Surface chlorophyll-a, ammonium
Lower Estuary #9F and nitrite.
– Botom •Low concentrations of
Itajaí-Mirim River #8 dissolved oxygen.
Fig. 8 – Plane formed by axes 1 and 2 of the PCA carried out on the spatial averages, showing the sampling stations (mode Q). The ellipses illustrate the associations found in the cluster analysis.
TABLE VI
Nutrient concentrations in subtropical estuarine systems.
Itajaí River Camboriú River Delta of San Tweed Danshuei Estuary of Variable
Estuary Estuary (Santa Francisco Bay Estuary Estuary Tantsui River Catarina, Brazil) (USA) (UK) (Taiwan) (Taiwan)
Pereira Filho Smith and Uncles Wen Wu and
This study et al. Hollibaugh et al. et al. Chou
(2001, 2002) (2006) (2003) (2008) (2003) NH+
4 (µM) 6.7–33.1 2.4–66.2 – – 10–1000 10–270
NO−
2 (µM) 0.2–2.2 0.2–1.8 – 0.4–2.5 – –
NO−
3 (µM) 22.9–56.8 0.4–6.5 – 35–370 – 25–45
DIN(µM) 30.5–77.0 3.9–73.9 14–53 – – –
PO3−
4 (µM) 0.9–2.1 0.13–3.3 1.3–4.5 0.5–3.5 0.1–37 0.5–9.5
H4SiO4(µM) 50.2–121 14.7–210 – 11–100 2–300 10–175
the compartmentalization of the system. The first trend shown was the separation of station #0 from all the
others. This trend is reflected in the level of occupa-tion of the region surrounding this environment by vari-ables that indicate water quality. Station #0, which is located at a site with little anthropogenic influence, has the best indicators of water quality, with the highest
val-ues of dissolved oxygen (Fig. 2D) and the lowest con-centrations of nutrients (Figs. 3 and 4), SPM (Fig. 6A) and organic compounds (Figs. 5B, C and D) of all the stations in the study.
salinity (#7, #8 and #9). The river stations were marked by high concentrations of nitrate and phosphate (Figs. 3A and 4A). Considering the river environment, stations #1 and #2, which correspond to the extremity of the sys-tem (the towns of Indaial and Blumenau), were sepa-rated from stations #3, #5 and #6 (the towns of nau, Gaspar and Ilhota). The urban center of Blume-nau is among these compartments, which is cut through by the Itajaí River. This separation, therefore, reflects the influence of the town of Blumenau on the chemical composition of the water. In this section of the river, increases were observed in concentrations of organic matter, which were indicated by the POC and BOD (Figs. 5B and D) and ammonium and phosphate (Figs. 3C and 4A), with all of them indicating the recent entry of wastewater.
The town of Blumeanu is one of the most impor-tant and populous towns in Santa Catarina and, like al-most all the state, does not have a system for collect-ing and treatcollect-ing domestic waste. This increase in the indicators for organic matter, ammonium and phos-phate reflects this precarious situation. Besides the in-fluence of wastewater, the surface flow of urban areas also shows a correlation between the deterioration of the water quality of the rivers and estuaries (Jeng et al. 2005, Crabill et al. 1999). A gradual decrease in dis-solved oxygen was also observed (Fig. 2D) from station #3 up to the mouth of the estuary, which indicates an in-crease in its consumption to oxidize the organic matter.
The following group, which is comprised of sta-tions #3, #5 and #6, was called the Upper Estuary and corresponds to the portion of estuary that is not directly influenced by salinity, but is subject to the variation of water level due to the tidal wave. Besides the municipal district of Blumenau, this compartment also includes the municipal districts of Gaspar and Ilhota. In both, agri-culture extends over a large area, particularly over the area covered by irrigated rice farming along the banks of the estuary and to the rural part of the municipal district of Itajaí. This region is marked by the almost complete absence of shoreline fringe forest in practically the en-tire area (Rörig 2005), which, together with the agricul-tural activity, explains the increase in SPM observed in station #6(Fig. 5A).
Stations #7, #9 and #8 form the group that
suffers the influence of salinity, which corresponds to the Middle and Lower Estuary of the Itajaí and Itajaí-Mirim Rivers, respectively (Fig. 6). This region was marked by the decrease in phosphate (Fig. 4A) and ni-trate (Fig. 3A), and an increase in ammonium (Fig. 3C) and nitrite (Fig. 3B). This standard variation is asso-ciated with the combined effect of the increased influ-ence of the seawater close to the mouth, and the passage of the estuary trough the towns of Itajaí and Navegantes. An increase in chlorophyll-a was also observed in sta-tion #9, which corresponds to the mouth of the estuary
(Fig. 5E) and is the only station that presented signif-icant values for this variable. The increase in salinity reflects the increase in the influence of seawater on the system as a result of saline intrusion. As the seawater represents low concentrations of nutrients and organic matter compared with the fresh water, it causes the con-centrations of these substances to become diluted. Thus, with the increase in salinity, a decrease in the concen-trations of these substances would be expected. This fact ocurred for the nitrate and phosphate. Nitrate rep-resents the more oxidized form of dissolved inorganic nitrogen (DIN). It is formed by the oxidation of ammo-nium into nitrite and, finally, nitrate through nitrification (Wada and Hattori 2000). Its presence in the water is an indication of a non-recent entry to the system, and is probably associated with the continental drainage and the effect of diffuse entries through surface drainage. Its decrease at the extremity of the estuary can, there-fore, be explained by the dilution by the seawater.
phyto-plankton assimilation, which results in reduced concen-trations of phosphate when the chlorophyll-a concentra-tions are high (Lebo and Sharp 1993). The decrease in phosphate in the Middle and Lower Estuary is, therefore, related to the combined effect of the dilution caused by the entry of coastal water to the estuary. The latter is associated with the effect of the phytoplankton assimila-tion in the Lower Estuary, which is the only region that has significant values of chlorophyll-a. Data on primary productivity of the Lower Estuary suggest that the phos-phate acts as a limiting factor on the biological pro-duction in the limit region of the estuarine plume and coastal region in situations of lower river discharge (Pereira Filho et al. 2009).
Despite the decrease in nitrate and phosphate, am-monium and nitrite present an increase in the area sur-rounding the mouth of the estuary, as reported in a pre-vious study (Pereira Filho et al. 2003). This increase reflects the influence of the passage of Itajaí Mirim River, by the municipal districts of Itajaí and Navegantes on the chemical composition of the estuarine water. To-gether, the population of both towns is over 200.000 in-habitants. None of them has a system of collection and treatment of domestic waste, which results in high lev-els of ammonium in the system. The towns of Itajaí and Navegantes also have the largest fishing port in Brazil (Gep 2001). A significant amount of the fish is pro-cessed by the some plants that are spread along the banks of the estuary, which totals about 66 registered plants in the region (Gep 2001). The fish processing results in the release of wastewater that typically con-tains high concentrations of N, particularly in the form of ammonium (Unep 2001), as well as phosphorous and other organic compounds. Thus, the effect of the en-try of seawater in the estuary, which tends to reduce the ammonium concentrations by dilution, is insufficient to reduce the concentrations of this nutrient in the system, which suggests that the levels of ammonium and/or or-ganic matter transported into the system is very high. The increase in nitrite is constant with the increase in ammonium, which results in nitrification in the estuary. The variation in the different forms of DIN resulted in a progressive increase in the influence of ammonium on the DIN throughout the estuary.
The variation in Si (H4SiO4) showed a unique
be-havior. Given that its origin is related to the harden-ing of the Earth’s crust, Si generally presents a variation related to the increase in the level of exposure of the soil. However, its distribution did not demonstrate this relation by evaluating the averages for each station (Fig. 4B). The average concentrations of Si were relatively constant throughout the estuary, despite the increase in agriculture activity in the region surrounding stations #5, #6 and #7.
The Itajaí-Mirim River (station #8) should also be
highlighted. Its confluence with the estuary is located close to the river mouth (Fig. 1). This river presented the most altered chemical conditions of all the evaluated stations, as shown by the higher concentrations of ni-trite, ammonium, SPM, total and organic phosphorous, and BOD (Figs. 3, 4 and 5). This tributary can be con-sidered another source of negative influence on the water quality of the Itajaí River estuary. These changes in the characteristics of the Itajaí Mirim River are related to the fact that it receives all the influence from the town of Brusque, which is another important urban center in the state, and also because it receives the drainage water from extensive farming areas.
This variation trend was corroborated by the ana-lysis of principal components carried out on the average spatial data. The distribution of the variables along the first axis (Fig. 7) showed the association among them that indicate the presence of organic and particulate matter (TOP, DOP, TP, POC, SPM and BOD) and are positioned at the negative extremity of the axis. The nutrients were also positioned on the negative side. By contrast, dissolved oxygen and pH were at the positive extremity of the estuary . This first axis, therefore, re-flected the variation in the quality of the water in the system. The second axis showed the salinity and pH at the positive extremity, followed by nitrite, chlorophyll and ammonium. The opposite extremity was character-ized by dissolved oxygen, phosphate and nitrate. The second axis reflected the influence of the seawater on the estuary, in contrast to the freshwater environment.
The understanding of the distribution of the vari-ables was clearer when the distribution of the sample stations was analyzed on the factorial plan, formed by the axes 1 and 2 (Fig. 8). Station #0, which presented
at the positive extremity of axis 1. By contrast, station #8was plotted at the negative extremity. It represents
the Itajaí Mirim River, which presented the worst set of values with high concentrations of nutrients and or-ganic matter, and low values of dissolved oxygen. The other stations of the Itajaí estuary were ordered between these 2 extremes, which reflects the variation in limno-logical conditions due to the activities carried out in the basin. In this context, it is important to note that sta-tion #9F, which corresponds to the samples at the
bot-tom of the Lower Estuary, was positioned on the pos-itive side of the axis showing the improvement in the indicators as a result of the entry of the seawater. The second axis showed the separation of the sample sta-tions based on salinity. The stasta-tions of the Lower and Middle Estuary of the Itajaí River were positioned at the positive extremity, being influenced by salinity and pH. Stations #1 and #2 were positioned at the opposite extremity, forming the Fluvial Extremity group in the cluster analysis, and stations #3, #5 and #6 correspond to the Upper Estuary.
The spatial characterization of the Itajaí-Açú River estuary showed that the estuary presents a change in the water quality indicators due to the marine influence and the influence of the urban centers. Multivariate ana-lyses show that the system was compartmentalized in two main groups: the portion without direct influence of salinity (#1 to #6) and the stations influenced by salin-ity (#7 and #9). The region without the influence of salinity showed a decrease in water quality due to the influence of the town of Blumenau, which results in the compartmentalization of stations #1 and #2, located up-stream from the town, and #3, #5 and #6, located down-stream. In the stations influenced by salinity (#7 and #9), particularly the station closest to the mouth of the estuary (#9), the effect of dispersion/dilution resulted by the entry of the seawater at the extremity of the estu-ary tended to minimize.
ACKNOWLEDGMENTS
The authors thank Sandro Urban, Marcos Biribeli, Mar-cos Adonai, Maycon Furtado and Rodrigo Sperb who helped in the sampling surveys and laboratory analysis, and Cynthia Philipps who assisted in the preparation of the manuscript with English language editing.
RESUMO
Esse estudo foi realizado com o intuito de avaliar a variação espacial da qualidade de água no Estuário do Rio Itajaí-Açú. Sete estações ao longo do estuário foram monitoradas semanal-mente, de outubro de 2003 a dezembro de 2004, além de duas outras estações em tributários (o Rio Itajaí-Mirim, principal tributário e uma estação de referência). Esse monitoramento incluiu medidas de salinidade, pH, oxigênio dissolvido, tem-peratura, nutrientes (NH+
4, NO−2, NO−3, PO34−, H4SiO4), de-manda bioquímica de oxigênio (DBO), fósforo total e fósforo orgânico dissolvido (PT e POD), carbono orgânico particulado (COP), material particulado em suspensão (MPS) e clorofila-a. Análises multivariadas demonstraram a compartimentação do sistema em função da deterioração da influência marinha e da qualidade da água. A ocupação urbana foi o principal fator responsável pela variação especial das variáveis monitoradas, resultando em aumentos dos indicadores de matéria orgânica e uma progressiva diminuição no oxigênio dissolvido. Próximo à desembocadura do estuário, mesmo com o efeito de diluição provocado pela intrusão da água marinha, foi observado au-mento nas concentrações de amônio, atribuído à influência de municípios de Itajaí e Navegantes.
Palavras-chave:estuário do Itajaí, nutrientes, matéria orgâni-ca, rio, Santa Catarina.
REFERENCES
APHA-AWWA-WPCF. 1998. Standard Methods for the Ex-amination of Water and Wastewater, 17th ed., Washing-ton, DC: American Public and Health Association, Amer-ican Water Works Association and Water Pollution Con-trol Federation.
ASTONSR. 1980. Nutrients, Dissolved Gases and General Biogeochemistry in Estuaries. In: OLAUSSONE AND CATOI (Eds), Chemistry and Biogeochemisty of Estuar-ies. New York: J Wiley & Sons Ltd. Ed, p. 233–262. BASNYATPET AL. 1999. Relationships Between Landscape
Characteristics and Nonpoint Source Pollution Inputs to Coastal Estuaries. Environ Manage 23(4): 539–549. CABEÇADASG, NOGUEIRAMANDBROGUEIRAMJ. 1999.
Nutrient Dynamics and Productivity in Three European Estuaries. Mar Polln Bull 38(12): 1092–1096.
CLARKE RM ANDWARWICK RM. 2001. Change in Ma-rine Communities: an Aproach to Statistical Analysis and Interpretation. 2nded., Plymouth, PRIMER-E, Ltd. CRABILL C ET AL. 1999. The Impact of Sediment Fecal
Coliforms Reservoirs on Seasonal Water Quality in Oak Creek, Arizona. Water Res 33: 2163–2171.
DIAZRJ. 2001. Overview of Hypoxia Around the World. J Environ Qual 30(2): 275–281.
ELLIOT MANDMCLUSKY D. 2002. The need for defini-tions in understanding estuaries. Estuar Coast Shelf Sci 55: 815–827.
GAGOJET AL. 2005. Continental Inputs of C, N, P and Si Species to the Ría de Vigo (NW Spain). Estuar Coast Shelf Sci 65: 74–82.
GAPLAN. 1986. Atlas de Santa Catarina. Gabinete de Plane-jamento e Coordenação Geral, Rio de Janeiro, RJ, Brasil, 173 p.
GEP – AÇÕES PRIORITÁRIA AODESENVOLVIMENTO DA PESCA EAQÜICULTURA NOSUL DOBRASIL. 2001. Re-latório Final, Volume IV. (Convênio Ministério da Agri-cultura e do Abastecimento – Univali).
GRASSHOFF K, EHRHARDTK ANDKREMLING K. 1983. Methods of Seawater Analysis. Weinheim, Verlag Che-mie, 417 p.
IBGE – INSTITUTO BRASILEIRO DE GEOGRAFIA E ES-TATÍSTICA. 2004. Cidades@ – O Brasil município por Município. Disponível em:
<http://www.ibge.gov.br/cidadesat/default.php>. Aces-so em Julho de 2004.
ICEPA. 2005. Instituto de Planejamento e Economia Agrícola de Santa Catarina. Síntese Anual da Agricultura de Santa Catarina 2003-2004. Florianópolis, SC, Brasil, ICEPA – Secretaria de Estado da Agricultura e Política Rural, 377 p.
JENGHACET AL. 2005. Impact of Urban Stormwater Run-off on Estuarine Environmental Quality. Estuar Coast Shelf Sci 63: 513–526.
LEBO ME AND SHARP JH. 1993. Distribution of Phos-phorus Along the Delaware, an Urbanized Coastal Plain Estuary. Estuaries 16(2): 290–301.
MEYBECK M. 1982. Carbon, Nitrogen and Phosphorus Transport by World Rivers. Am J Sci 282: 401–450.
MORRISAWET AL. 1995. The Estuary Plume Zone: Source or Sink for Land-derived Nutrient Discharges. Estuar Coast Shelf Sci 40: 387–402.
PARSONSTR, MAITAYANDLALLICM. 1989. A Manual of Chemical and Biological Methods for Seawater Ana-lysis. Oxford: Pergamon Press, 173 p.
PEREIRA FILHO J ET AL. 2001. Intratidal variation and net transport of dissolved inorganic nutrients, POC and chlorophyll-a in the Camboriú River Estuary, Brazil. Es-tuar Coast Shelf Sci 53: 249–257.
PEREIRAFILHOJET AL. 2002. Estuário do Rio Camboriú-SC: variação intramareal e transporte residual de nutri-entes, COP e clorofila-a em condições de quadratura e sizígia. N Tecn Facimar 6: 137–151.
PEREIRA FILHO J, SPILLERE LC AND SCHETTINI CAF. 2003. Dinâmica de Nutrientes na Região Portuária do Estuário do Rio Itajaí-Açú. Atlântica 25: 11–20. PEREIRAFILHOJET AL. 2009. Primary and Bacterial
Pro-duction Processes in the Lower Itajaí-Açú Estuary, Santa Catarina, Brazil. Braz J Aquat Sci Technol 13: 1–10. PRITCHARDD. 1967. Observations of circulation in coastal
plain estuaries. In: LAUFFG (Ed), Estuaries, Am Assoc for the Advanc of Sci Publ N 83, Washington, D.C., p. 37–44.
REVILLAMET AL. 2002. Microplankton Metabolism Along a Trophic Gradient in a Shallow-Temperate Estuary. Es-tuaries 25: 6–18.
RÖRIG LR. 2005. Usos Múltiplos e Qualidade das Águas da Bacia do Baixo Itajaí-Açú, SC: Elementos para um Gerenciamento Integrado. Tese (Doutorado em Ecologia e Recursos Naturais), UFSCar, São Carlos, SP, Brasil. ROWEGT. 2001. Seazonal hypoxia in the bottom water of
the Mississipi River Delta. J Environ Qual 30: 281–290. SCHETTINICAF. 2002a. Caracterização Física do Estuário
do Rio Itajaí-açú. Rev Bras Recur Hidr 7: 123–142. SCHETTINICAF. 2002b. Near bed Sediment Transport in the
Itajaí-Açú River Estuary Southern Brazil. In: WINTER-WERPJC ANDKRANENBURG CS, Fine Sediment Dy-namics in the Marine Environment. Amsterdam: Elsevier, p. 499–512.
SCHETTINI CAF, CARVALHO JLB AND JABOR P. 1996. Comparative Hydrology and Suspended Matter Distribu-tion of Four Estuaries in Santa Catarina State – Southern Brazil. In: Workshop on Comparative Studies of Temper-ate Coast Estuaries, Proceedings, p. 29–32.
SMITHSVANDHOLIBAUGHJT. 2006. Water, Salt and Nu-trient Exchanges in San Francisco Bay. Limnol Oceanogr 51(1 part 2): 504–517.
SPENCERCP. 1975. The Micronutrient elements. In: RILEY JPANDSKIRROWG (Eds), Chem Oceanogr, Vol. 3, New York, Academic Press, p. 245–299.
STRICKLANDJDANDPARSONSTR. 1972 A practical hand-book of seawater analysis. Fish Res Board of Can Bull, 2nded., 311 p.
UNCLES RJ, FRICKERS PE ANDHARRIS C. 2003. Dis-solved Nutrients in the Tweed Estuary, UK: Inputs, Distri-butions and Efects of Residence Time. Sci Total Environ 314-316: 727–736.
UNEP – UNITED NATIONS ENVIRONMENT PROGRAM. 2001. Overview of Fish Processing. In: UNEP (Ed), Cleaner Production and Assesment in Fish Processing. UNEP-Earthprint Ed, 99 p.
WADAEANDHATTORIA. 2000. Nitrogen in the sea: forms, abundances and rate processes. Boca Raton, Florida, CRC Press, 208 p.
WENL-S, JIANNK-TANDLIUK-K. 2008. Seasonal Vari-ation and Flux of Dissolved Nutrients in the Danshuei Estuary, Taiwan: a Hypoxic Subtropical Mountain River. Estuar Coast Shelf Sci 78: 694–704.