Do Managers Herd when Choosing the Firm’s Capital
Structure? Evidence from a Small European Economy
Mariana Fernandes Pais up201400194@fep.up.pt
Master Dissertation in Finance
Supervisor:
Júlio Fernando Seara Sequeira da Mota Lobão, PhD
i
Biographical Note
Mariana Fernandes Pais was born in Viseu, in April 1993. In 2014, she received her bachelor’s degree in Management at the faculty of Economics of University of Coimbra. In the same year, she joined the Master in Finance course at the faculty of Economics of University of Porto.
Meanwhile, under the Erasmus Program, she studied at Ghent University between February 2015 and June 2015.
Furthermore, during the last two years, she has actively been involved in an academic association, FEP Finance Club, where she has been a member of Career Development’s department.
ii
Acknowledgements
I would like to express my gratitude to my supervisor, Professor Júlio Lobão (PhD), for his availability, comprehension and support. Thank you for your sympathy, patience and confidence in my work. To my mother, father, brother and grandparents for their unconditional support, concerns and encouragement, by helping me to achieve my goals and to never give up. To all my friends, especially to Inês, Filipa, Rita, Catarina and Mónica, for their advices, help, friendship and motivation.
iii
Abstract
To achieve an optimal capital structure, managers should determine the best level of debt and equity. Most research on corporate financial policy suggests that these decisions are made as a result of factors such as agency costs, bankruptcy costs, earnings variability and underinvestment. However, this determination is a costly and uncertain process for an individual firm. Therefore, this research intends to study the herding behavior of managers of Portuguese firms, whether an individual firm is sensitive to peer firms within the industry on capital structure decisions and whether peer firm behavior is driven by a leader-follower model in which less successful firms are influenced by more successful firms. Since there is controversy and lack of studies regarding this subject, it becomes relevant to contribute with new studies in this field. The results show that herding behavior is concentrated among smaller and less successful firms, which reveals more sensitivity to their peer firms than the counterparts within the industry, being consistent with the study made by Leary and Roberts (2014). However, only some followers’ firms are influenced by the capital structure of their more successful counterparts within the industry.
Key-words: Herding behavior, Capital structure, Leader firm, Follower firm, Industry. JEL-Codes: G30, G32, G14
iv
Resumo
Para alcançar uma estrutura de capital ótima, os gestores devem determinar o melhor nível de dívida e capital próprio. A maioria das pesquisas sobre política financeira corporativa sugere que essas decisões são feitas como resultado de fatores como custos de agência, custos de falência, variabilidade de ganhos e baixo investimento. No entanto, essa determinação é um processo dispendioso e incerto para uma empresa individual. Posto isto, esta pesquisa pretende estudar o efeito de rebanho dos gestores de empresas Portuguesas, analisando se uma empresa individual é sensível às empresas homólogas dentro da indústria em decisões de estrutura de capital e se o comportamento de uma empresa homóloga é conduzido por um modelo líder-seguidor em que empresas menos bem-sucedidas são influenciadas por empresas mais bem-sucedidas. Uma vez que existe controvérsia e falta de estudos sobre este assunto, torna-se relevante contribuir com novos estudos neste campo. Os resultados mostram que o efeito de rebanho está concentrado entre as empresas mais pequenas e menos bem-sucedidas, o que revela mais sensibilidade às suas empresas homólogas do que as contrapartes da indústria, sendo consistente com o estudo realizado por Leary e Roberts (2014). Contudo, apenas algumas empresas seguidoras são influenciadas pela estrutura de capital de empresas bem-sucedidas dentro da indústria.
Palavras-chave: Efeito de rebanho, Estrutura de capitais, Empresa líder, Empresa seguidora,
Indústria.
v
Index
1. Introduction ... 1
2. Literature Review ... 3
2.1. Capital Structure ... 3
2.1.1. Modigliani and Miller Contributions ... 3
2.1.2. Capital Structure Theories ... 4
2.1.3. Determinants of Capital Structure ... 6
2.2. Herding Behavior ... 9
2.3. Related Research – Herding Behavior in Capital Structure decisions ... 11
3. Methodology and Sample Selection ... 14
3.1. The Empirical Model ... 14
3.2. Sample Selection and Data ... 16
3.3. Summary Statistics ... 17
4. Empirical Results ... 19
4.1. Basic Empirical Model ... 19
4.2. Sensitivity of Peer Firms ... 22
4.3. Leader-follower Model ... 24 4.4. Robustness Tests ... 26 4.4.1. Leader-follower Model ... 26 4.4.2. Follower-leader Model ... 28 5. Conclusions ... 30 References ... 32 Appendixes ... 37
vi
Index of tables
Table 1 – Determinants of capital structure and their impact on leverage, according to the
different theories ... 9
Table 2 – Summary of the dependent variable and firm-specific characteristics’ variables 16 Table 3 – Descriptive Statistics ... 17
Table 4 – Estimation results for the total sample ... 20
Table 5 – Number of firms in each group classification of leaders and followers ... 22
Table 6 – Estimation results of Sensitivity Analysis of Peer Firms ... 23
Table 7 – Estimation results of the Leader-follower Model ... 25
Table 8 – Estimation results of the Leader-follower Model, excluding low third of follower firms’ distribution ... 27
1
1. Introduction
The importance of determining an appropriate capital structure is that it allows firms to reduce their cost of financing and maximize their value. Managers to reach an optimal capital structure should determine the best level of debt and equity. Finance theories suggest that the capital structure decisions are made as a result of factors such as agency costs, non-debt tax shields, earnings variability, bankruptcy costs and underinvestment. However, for the individual firm, this determination is a costly and uncertain process and hard to measure. Since Modigliani and Miller (1958), most research on corporate financial policy has been dedicated to explaining differences in the capital structure of firms, assuming the capital structure decisions are determined independently of the actions or characteristics of their peer firms. Consequently, the role of herding behavior in determining capital structure is often ignored, assuming there is no impact on its firm-specific determinants.
Many authors have studied whether herding behavior matters for corporate capital structure decisions. Filbeck et al. (1996) found no support for herding behavior of firms and weak support for capital structure decisions on following some industry leader. Furthermore, Oruç and Sen (2009) did not find significant effect in the sense of following sector averages or following leverage level of leader firms on capital structure decisions. However, more recent research has shown that peer firm behavior in capital structure has large impact on its determination (Leary and Roberts, 2014). Moreover, Frank and Goyal (2009), Welch (2004), and MacKay and Phillips (2005) show that the industry average leverage ratios have a significant influence on firms’ capital structures. Damodaran (2010) also suggests that firms tend to follow the leader firm within the industry, hoping to mimic its success. Given this, and since there is controversy and lack of studies regarding this subject, it becomes relevant to come with new researches in this field.
In this research, the main goals are to identify whether an individual firm is sensitive to peer firms within the industry on capital structure decisions and whether peer firm behavior is driven by a leader-follower model in which less successful firms are influenced by more successful firms. Managers are insecure of how to determine the optimal capital structure, and so, they may consider the characteristics and the financial policy decisions of peer firms
2 as informative for their own choices. The research sample is composed by 85 Portuguese firms of 9 industries and comprises data over the period between 2007 and 2015.
The results show that, compared to firm-specific characteristics, peer firm financial policies have a significantly larger impact on capital structure, suggesting that the primary channel through which peer firms may influence capital structure is via peer firms’ policy decisions. Moreover, we also conclude that smaller and less successful firms are more sensitive to their peers than are the leaders within the industry, being consistent with the conclusion of the study made by Leary and Roberts (2014). However, only some followers are influenced by the capital structure decisions of their more successful counterparts within the industry. The structure of this study will proceed as follows. In Chapter 2, a literature review about the topic is made, in which is presented the main theoretical models of capital structure and their characteristics, the herding behavior concept and its influence on capital structure decisions, and the main approaches and results of similar studies. In Chapter 3, the methodological considerations of the study are described, including the empirical model and variables’ description, the data collected and the descriptive statistics for each of the variables we used in the analysis. The Chapter 4 presents the results and its analysis, concerning peer firm effects in determining capital structure. Lastly, in Chapter 5, we present the conclusions and limitations of the study, and suggestions for further research.
3
2. Literature Review
This section is divided into three different subsections; the first one presents the main theoretical models concerning capital structure and their characteristics. The second subsection presents the herding behavior concept and its influence on managers’ decisions. Lastly, the third subsection synthesizes the main contributions and results from previous studies related to herding behavior in capital structure decisions.
2.1. Capital Structure
Since Modigliani and Miller (1958), most research on corporate financial policy has been dedicated to explaining factors and differences in the capital structure decisions of firms. Consequently, an important question in financial theory and practice has remained ‘how to determine the optimal capital structure’, which is crucial to decide the financial decision-making.
In this section, there will be presented the Modigliani and Miller contributions, the main capital structure theories and a review of the empirical studies in determining capital structure.
2.1.1. Modigliani and Miller Contributions
The capital structure issue has been discussed since Modigliani and Miller (1958). The importance of determining an optimal capital structure is that it allows firms to reduce their cost of financing and maximize their value.
According to the Proposition I of those authors, the value maximization of firm is independent of its capital structure, assuming perfect capital markets, no personal or corporate taxes and the independence of financing and investment decisions. However, there are market imperfections and therefore most of the capital structure models are based on their existence.
Posteriorly, in 1963, Modigliani and Miller made an adjustment to their previous paper. They found that the capital structure is not irrelevant to maximize the value of the company, due to the dependence of firm’s market value on the tax rate, on the expected return of tax and on
4 the degree of leverage. However, although the debt is related to a tax shield, they argue that it does not mean that firms should be solely financed by debt. Firstly, there are several alternatives of financing that can be cheaper, like the retained earnings. Secondly, some lenders restrict the amount they lend to a given company. And finally, the data collected by the authors did not demonstrate that the leverage increases with high tax rates, which means higher tax advantages.
Thus, knowing that the way a firm is financed is important for its valuation and the markets have frictions, several theories of firm capital structure have emerged.
2.1.2. Capital Structure Theories
The traditional finance on formation of capital structure presented the three following theories: Trade-off Theory, Pecking Order Theory and Market Timing Theory.
Trade-off theory, suggested by Myers (1984), considers that to reach an optimal capital structure, the firm’s debt ratio should be determined by a balance of the costs and benefits of corporate and personal income tax, impact of potential agency costs and bankruptcy and financial distress costs, since the firm may not realize value maximization when it uses only liabilities or does not use liabilities to define its capital structure. Furthermore, according to this theory, the debt financing can bring tax avoidance; however, the bankruptcy risk will be higher when the debt levels rise, at the same time the financing costs will increase.
According to the Pecking Order theory, proposed by Myers and Majluf (1984), the capital structure of a firm is formed by taking into account the priorities of different sources to meet financial requirements. Thus, to minimize asymmetric information and financing costs, firms should finance new investments, first internally with retained earnings, then with low-risk debt, and finally with equity only as a last option.
In more recent years, the Market Timing Theory which was proposed by Baker and Wurgler (2002) defended that the capital structure is a cumulative outcome of past attempts to explore the market opportunities, being not associated with the existence of an optimal capital structure. This theory argues that the firms have the tendency to issue equity when market-to-book ratios are high and repurchase when market value is lower than its book value.
5 Many other studies based on the existence of imperfections on capital markets were carried out in order to help explaining the differences between the average capital structures among industries. Therefore, most research on corporate financial policy suggests that the capital structure decisions are made as a result of the following factors: agency costs, non-debt tax shields, bankruptcy costs, asset redeployment, and underinvestment.
The agency conflicts are generated by the divergence of interests between the managers and shareholders of the firm. Jensen and Meckling (1976) defined agency costs as the sum of: “the monitoring expenditures by the principal, the bonding expenditures by the agent, and the residual loss.” (p. 308). They argued that an optimal capital structure can be achieved by balancing the agency costs and benefits of debt.
DeAngelo and Masulis (1980) formulated a model of corporate leverage decision in which personal and corporate tax treatment of debt and equity exists. The existence of non-debt corporate tax shields, such as depreciation deductions, depletion allowances, and investment tax credits, leads to a market equilibrium in which each firm has a single optimum leverage decision.
Bradley et al. (1984) developed a model that synthesizes the balancing theory of firm’s optimal capital structure. This model includes positive personal taxes on equity and on bond income, the expected costs of financial distress (agency costs and bankruptcy costs), and the level of non-debt tax shields. Their analysis suggests that the variability of firm earnings is related inversely to the optimal firm leverage when costs of financial distress are significant. Most studies said that, under market imperfection, bankruptcy consequences arise and the trade-off between the tax subsidy and the bankruptcy costs makes possible an optimal capital structure. Haugen and Senbet (1987) challenged this view by arguing that bankruptcy costs, which affect the capital structure decisions, must be insignificant or nonexistent if one simply assumes that capital market prices are determined by rational investors.
Williamson (1988) stated that whether the financing of a project should be by debt or by equity depends mainly on the assets’ characteristics. Transaction-cost reasoning supports the
6 use of equity to finance non-redeployable assets, while redeployable assets are financed by debt.
Myers and Majluf (1984) developed a model of the issue-invest decision under the assumption of the firm’s managers have superior information. This model suggests that firms may refuse to issue common stock, and therefore may not take a valuable investment opportunity. Moreover, it also suggests justifications for several aspects of corporate financing behavior, such as the tendency to rely on internal sources of funds, and to prefer debt instead of equity when external financing is required.
2.1.3. Determinants of Capital Structure
Many researchers have been studying the influence of the theories described above and attempting to find the determinants of firms’ capital, which can be connected to firm-specific characteristics, or can be influenced by the macroeconomic environment and industry conditions.
According to Harris and Raviv (1991), in their summary from the existing literature, the characteristics of firm usually claimed to have some impact on corporate leverage decisions are the amount of fixed assets hold by firms, the nondebt tax shields, the investment opportunities, the firm’s size, the volatility, the advertising expenditure, the probability of bankruptcy, the profitability and uniqueness of the product. Although the influence of each of these factors may differ across studies, in our study we will only focus on the following determinants of capital structure: profitability, firm size, growth opportunities, industry conditions, and the nature of assets.
a) Profitability
According to Pecking Order Theory, more profitable firms will become less levered over time because they prefer internal finance instead of external funds. Thus, a negative relation of profitability on leverage would be expected (Myers and Majluf, 1984). Fan et al. (2012) and Hall et al. (2004) also found a negative relation between profitability and debt, and between profitability and short-term debt, respectively.
7 On the other hand, Trade-off Theory predicts a positive relation between profitability and leverage whether the market for corporate control is effective and forces firms to commit managers to use the internal resources in a responsible manner. Furthermore, profitable firms face lower expected costs of financial distress and have interest tax shields more valuable, and so, under the tax and the bankruptcy costs perspective, these firms use more debt (Jensen, 1986).
b) Firm Size
Larger firms tend to be more diversified and to face lower default risk (Ferri and Jones, 1979). Furthermore, older firms have better reputations in debt markets and so they tend to face lower debt-related agency costs. Therefore, the Trade-off theory expects that more mature and larger firms have more debt.
By contrast, the Pecking Order theory predicts an inverse relation between leverage and firm age and between leverage and firm size. Larger firms are better known, older firms collect retained earnings and younger firms need to raise external funds (Petersen and Rajan, 1994; Michaelas et al., 1999; Hall et al., 2004).
c) Growth Opportunities
Growth increases costs of financial distress, decreases problems of free cash flow, and intensifies agency problems related with debt. Therefore, the trade-off theory predicts a negative relation between growth opportunities and the debt level, reducing the firm’s leverage.
Moreover, the Market Timing theory supports that firms prefer to issue equity when the stock price is high relative to earnings or book value, since they can sell the new shares at higher prices, and therefore, reducing the amount of debt. Thus, growth opportunities and leverage are negatively related under this theory, as it was pointed out by Rajan and Zingales (1995) and by Antoniou et al. (2002). For Frank and Goyal (2009) and Fan et al. (2012), this relation is also inverse.
In opposition, the Pecking Order theory suggests that firms with more investments projects will need more external funds, thus, debt is preferred against equity (Myers and Majluf,
8 1984). So, this theory predicts a positive relation between growth opportunities and leverage. Nevertheless, Ozkan (2001) and other researchers, found evidence that support a negative relation, arguing that firms may be prevented from issuing more debt with the existence of risky debt on their balance sheets, overlooking some investment opportunities.
d) Industry Conditions
The leverage ratios across industries present significant variation, as it was pointed out by Ross et al. (2008), and by Lemmon et al. (2008). These differences have several possible interpretations.
First, managers to contemplate their own firm’s leverage, they maybe use industry median leverage as a reference. Therefore, industry median leverage is regularly used as a proxy for target capital structure (Gilson, 1997; Hull, 1999; Hovakimian et al. 2001). Hovakimian et
al. (2001) show that firms actively adjust their debt ratios according to the industry average.
Second, industry effects exhibit a set of correlated factors, although they are omitted. In the same industry, firms tend to face mutual forces that influence their financing choices. These could reflect product market interactions or the nature of competition, and industry heterogeneity, such as the business risk, technology, types of assets, or regulation.
Welch (2004), and MacKay and Phillips (2005) show that the industry average leverage ratios have a significant influence on firms’ capital structures. Moreover, Frank and Goyal (2009) take into consideration two industry variables, the industry median leverage and the industry median growth. According to Trade-off theory, higher industry median leverage should result in more debt, while higher industry median growth should result in less debt. The Pecking Order theory predicts that the industry is only considered when it serves as a proxy for the firm’s financing deficit. Under the Market Timing perspective, the industry is only considered whether valuations are correlated across firms in an industry.
e) Nature of Assets
Ferri and Jones (1979) found that tangible assets have a negative impact on leverage, as this type of assets can increase the variability of firm’s income, delaying the access to debt. Hall
9 On the other hand, according to Michaelas et al. (1999) (and Hall et al. (2004) for the long-term), the higher the amount of tangible assets, the higher the debt level that firm will have on its capital structure. Due to that, the tangible assets can be used as collateral in debt contracts and lenders will ask for a low risk premium. Furthermore, the use of funds produced by managers is limited when there are collaterals in a debt contract, which it reduces the agency costs. Consequently, under the Trade-off theory, the relation between leverage and tangibility is positive (Zurigat, 2009). The Pecking Order theory also predicts this positive effect, once the assets used as collateral will enable to issue debt at interesting rates. Other researchers, such as Rajan and Zingales (1995), Frank and Goyal (2009), Fan et al. (2012), and Acedo-Ramírez and Ruiz-Cabestre (2014), had the same results. Antoniou et al. (2002) discover evidence that support both the negative and the positive effect between leverage and tangible assets.
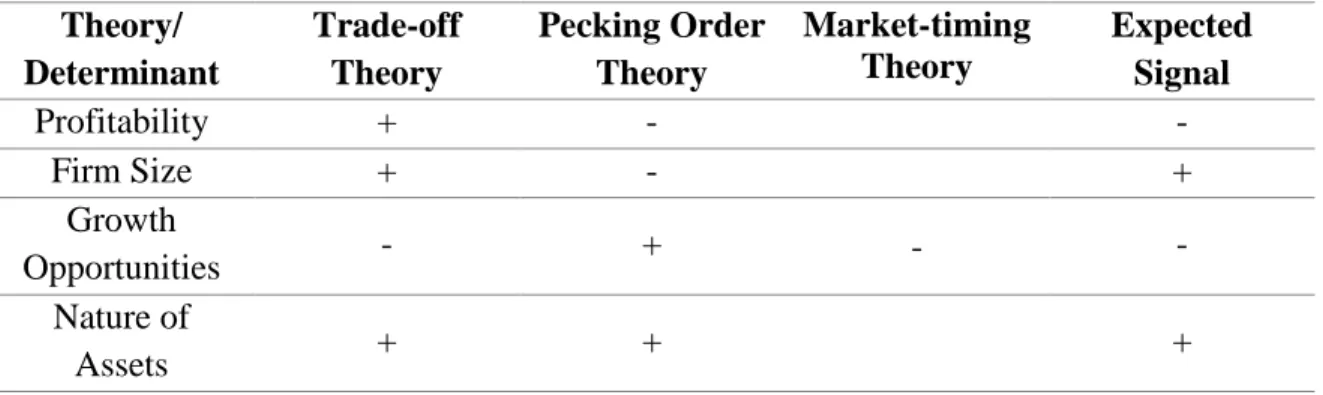
Table 1 – Determinants of capital structure and their impact on leverage, according to the
different theories Theory/ Determinant Trade-off Theory Pecking Order Theory Market-timing Theory Expected Signal Profitability + - - Firm Size + - + Growth Opportunities - + - - Nature of Assets + + + 2.2. Herding Behavior
Under the research perspective of bounded rational individuals and groups, Behavioral Finance theory concerns about irrational investors and managers, who have impact on firm’s capital allocation behavior and performance. It also considers influence of psychological factors in financial decisions. The market timing hypothesis of corporate financing, brought by Shefrin (2000), explores the agents’ irrational behavior on capital structure decisions. Although the theoretical hypothesis of traditional finance theory is the rational agent and
10 effective market, the theoretical basis of behavioral finance is restricted rationality and limited arbitrage.
Keynes (1936) proposed that the investment of non-rational investor will have the influence the company financing behavior, to certain level, the investment activity is affected by the stock dealer's average anticipation, but not controlled by entrepreneur's average anticipation. Furthermore, he suggested that professional managers will "follow the herd" if they worry about how others will evaluate their capacity to make decisions.
There are two ways of herding behavior, the irrational and rational. Focused on manager psychology, the irrational way of herding behavior suggests that individuals are irrational when they behave by herd instinct. People in groups have the tendency to think and behave similarly which suggests some kind of irrationality, such as loyalty-induced psychological incentive to be in agreement with the group members (Shiller, 1995). On the other hand, regarding to the rational way, several studies have been developed to explain why rational individuals behave together: informational cascades, agency reputation based models and information inefficiencies.
The more common explanation for herding behavior is informational cascades. It occurs when an individual acquires information in sequence by observing the actions of those ahead of him, and follows the behavior of the preceding individual ignoring his own information (Bikhchandani et al., 1992; Hirshleifer and Hong Teoh, 2003). Moreover, Devenow and Welch (1996) show that informational cascades may justify the decisions of managers when they assume debt because, without an optimal model, the managers may follow the choice from peer firms.
An alternative explanation is reputational risk: under certain circumstances, managers tend to mimic the investment decisions of other managers, disregarding their own personal information. This behavior is inefficient from the social angle, but it can be rational from the perspective of managers who care about their professional reputations, i.e., herding behavior is considered more important than making efficient investment decisions because blame is undertaken together in the case of a bad result (Scharfstein and Stein, 1990). Furthermore,
11 the implicit incentives encourage managers to herd more during the progress of their career (Boyson, 2010).
Lastly, herding behavior could be a consequence from the way investors deal with information: investors may prefer to use only private information shared by other investors, instead of their own information. Thus, resource allocation concerning information acquisition is inefficient (Froot et al. 1992).
The specialists in Behavioral finance consider that corporate financing decision is the dispute between firms and the capital market, and this decision is connected to capital market conditions. Hovakimian et al. (2001) stated that the research of capital structure has ignored the capital market supply condition that has influence on corporate financing decision, i.e., this decision should pay more attention to the deviations of capital market financing condition, than to a trade-off between the costs and benefits of debt and equity financing. Most studies about the capital structure usually adopt the traditional finance theory, but this research will carry on discussion from the behavior finance's perspective, using herding behavior of managers to explain corporate financing decisions.
2.3. Related Research – Herding Behavior in Capital Structure decisions
Herding behavior in capital structure decisions can arise for a diversity of reasons. For instance, financial policy mimicking could be caused by interactions between financial structure and product market competition. According to Bolton and Scharfstein (1990), firms with high leverage will mimic the financial policies of their less-levered rivals, when the expected cost of the predatory price competition from less-levered firms is severe enough. Moreover, Chevalier and Scharfstein (1996) present a model in which the investments of firms with high leverage are affected by an industry decline, losing market share to more conservatively financed rivals, which can lead to a mimicking behavior of the more conservative leverage policies of their peer firms.
Brander and Lewis (1986) present a duopoly market model in which capital structure mimicking among competitors is generated by the reactions and comments between product markets and financial policy. This interaction is also examined by Maksimovic and Zechner
12 (1991). Nevertheless, in contrast to herding behavior, the implications of this study are led more in the direction of differential positioning within the industry.
Some studies have focused on investigating whether peer firms effect matters for financial policy. Hereafter, there are introduced some of the most important empirical studies’ results concerning herding behavior in determining capital structure decisions.
Zeckhauser et al. (1991) propose the “herd migration” theory, which suggests that managers may reveal herding behavior in capital structure policies by following average debt-equity ratio of the sector. They find low level of meaningful herd behavior in three sectors considered and high level in seven sectors, based on the sample of 182 U.S. firms of 10 sectors based on two-digit SIC codes from the period of 1971-1989.
Filbeck et al. (1996) examine the tendency to keep the capital structure decisions according to the industry from a sample of 120 U.S. firms among 4 industries during the period 1981 to 1990.They find no support for herding behavior of firms and weak support for capital structure decisions on following some industry leader.
Oruç and Şen (2009) study the influence of herd psychology on capital structure decisions of 45 firms listed in ISE (Istanbul Stock Exchange) of 4 industries from the period of 1999-2006. They do not find significant effect in the sense of following sector averages or following leverage level of leader firms on capital structure decisions.
Lastly, Leary and Roberts (2014) analyze the peer firm behavior in determining corporate capital structures and financial policies for a sample of 9126 U.S. firms of 217 industries based on three-digit SIC code over the period from 1965 to 2008. The authors report that peer firm behavior in corporate capital structure has large impact on its determination, larger than any other determinant. They conclude that “Mimicking behavior is concentrated among
smaller, younger, less successful, and more financially constrained firms. By contrast, industry leaders are not influenced by the financial policy choices of their less successful peers.” (Leary and Roberts, 2014, p. 173).
Given this, the previous studies do not present consensus on the influence of herding behavior in capital structure decisions. Moreover, the majority of the studies focus on U.S. firms (e.g.
13 Zeckhauser et al., 1991; Filbeck et al., 1996; Leary and Roberts, 2014) or on Turkish firms (e.g. Oruç and Sen, 2009). As such, and since there is controversy and lack of studies regarding this subject, it becomes relevant to come with new researches in this field. Therefore, the present research will differentiate because it is applied to a Portuguese sample, studying whether firms are sensitive to peer firms within the industry on financial policy decisions and whether less successful firms are influenced by more successful firms.
14
3. Methodology and Sample Selection
This section is divided into three different subsections; the first one presents the empirical model and describes the respective variables. The second subsection describes the data that was collected. And, the last one presents the descriptive statistics for each of the variables that were used in the analysis.
3.1. The Empirical Model
In order to better understand the impact of peer effects in determining variation on corporate leverage ratios across firms of the same industry, there were considered some factors that have influence in the capital structure decisions. The empirical model of capital structure followed was developed by Leary and Roberts (2014), based on the empirical capital structure literature of previous studies (Rajan and Zingales, 1995; Frank and Goyal, 2009). The empirical model (3.1) is as follows:
𝐿𝐸𝑉𝑖𝑗𝑡 = 𝛽1+ 𝛽2𝐿𝐸𝑉_𝐴𝑉𝐺−𝑖𝑗𝑡+ 𝛽3𝑆𝐼𝑍𝐸_𝐴𝑉𝐺−𝑖𝑗𝑡−1
+ 𝛽4𝑃𝑅𝑂𝐹_𝐴𝑉𝐺−𝑖𝑗𝑡−1+ 𝛽5𝑇𝐴𝑁𝐺_𝐴𝑉𝐺−𝑖𝑗𝑡−1
+ 𝛽6𝐺𝑅𝑂𝑊𝑇𝐻_𝐴𝑉𝐺−𝑖𝑗𝑡−1+ 𝛽7𝑆𝐼𝑍𝐸𝑖𝑗𝑡−1+ 𝛽8𝑃𝑅𝑂𝐹𝑖𝑗𝑡−1
+ 𝛽9𝑇𝐴𝑁𝐺𝑖𝑗𝑡−1+ 𝛽10𝐺𝑅𝑂𝑊𝑇𝐻𝑖𝑗𝑡−1+ 𝜇𝑖𝑗𝑡 (3.1)
Where i refers to the firm, j to the industry and t to the year period. Peer firm average characteristics and firm-specific characteristics are lagged 1-year to reduce the problem of endogeneity, and to determine their influence on firm leverage by observing the previous period.
Variables Description
Leverage (LEV) – The dependent variable is a measure of capital structure policy. This variable is calculated using the ratio between Total Debt and Book Value of Total Assets, proposed by Ferri and Jones (1979).
Peer firm averages measure the influence of peer firm actions and characteristics on capital structure decisions.
15 • Leverage (LEV_AVG) – According to Frank and Goyal (2009), the median industry leverage has a positive and significant influence on firm leverage. Welch (2004), and MacKay and Phillips (2005) also consider that this is an economically important factor for firm’s capital structure. Ferri and Jones (1979), Bradley et al. (1984), Michaelas et al. (1999), and Chui et al. (2002) present that the type of industry impacts a firm’s capital structure.
• Characteristics (SIZE_AVG, PROF_AVG, TANG_AVG, GROWTH_AVG) – We average each characteristic, described below, of all firms within an industry-year combination, excluding the ith observation, to measure the impact of peer effects on financial policy choices.
Firm-specific characteristics:
• Firm Size (SIZE) is proxied by the natural Logarithm of Sales (Rajan and Zingales, 1995; Leary and Roberts, 2014). According to Wooldridge (2002), the use of the natural logarithm allows to limit the range of the variable, making this variable less sensitive to extreme observations.
• Profitability (PROF) is calculated by the ratio of Earnings Before Interest and Taxes (EBIT) to Total Assets (Chui et al., 2002). The use of EBIT, in place of other measures of earnings, allows to compare firms with different capital structures.
• Asset Tangibility (TANG) corresponds to the ratio between Property, Plant, and Equipment (PPE) and Total Assets, following the approach of Michaelas et al. (1999), Hall et al. (2004) and Fan et al. (2012).
• Growth Opportunities (GROWTH) are proxied by the change in Logarithm of Total Assets, that represents outflows (Frank et al., 2009). According to Shyam-Sunder et
al. (1999), it directly increases the financing deficit. In the literature, there are some proxies for growth opportunities. Barclay and Smith (1995) and other capital structure researchers measure by the market-to-book ratio. Unfortunately, since most firms are not traded, the market value of assets is not available.
The reasons for choosing the firm characteristics mentioned above as the main determinants of capital structure are as follow: they have presented most consistently as being correlated
16 with leverage in previous studies (Bradley et al., 1984; Long and Malitz, 1985; Harris and Raviv, 1991). In addition, the data available severely restricts the capacity to develop proxies for other determinants.
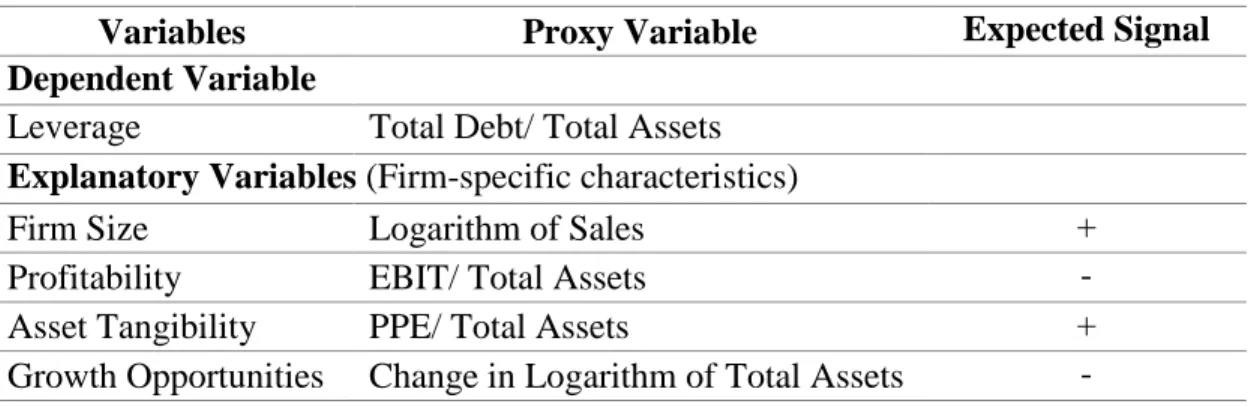
Table 2 – Summary of the dependent variable and firm-specific characteristics’ variables
Variables Proxy Variable Expected Signal
Dependent Variable
Leverage Total Debt/ Total Assets
Explanatory Variables (Firm-specific characteristics)
Firm Size Logarithm of Sales +
Profitability EBIT/ Total Assets -
Asset Tangibility PPE/ Total Assets +
Growth Opportunities Change in Logarithm of Total Assets -
3.2. Sample Selection and Data
The data was extracted from the database Sabi, provided by Bureau Van Dijk, in an annual basis, from the period of 2006 to 2015. From it, it was possible to collect the annual reports of firms for which accounting data necessary to calculate the dependent variable and the firm-specific characteristics was available. To avoid capital structures dictated by regulatory considerations, it was excluded financial firms, utilities and government entities. Furthermore, it was also excluded subsidiaries’ firms controlled by non-Portuguese companies. Moreover, due to the proxy variable used for growth opportunities and to the fact that the firms’ characteristics are lagged 1-year, the final period excludes two years (2006 and 2007). After these adjustments, the final sample consists of 680 firm-year observations corresponding to 85 firms with non-missing data for all analysis variables in study from the period of 2008 to 2015 (8 years).
The industry groups are defined by three-digit CAE-Rev.31 code. Additionally, the industries’ selection is based on the following criteria: they should have at least 5 firms with non-missing data for all analysis variables. Given this, there are 9 industries represented in the sample; 11 firms in the aquaculture industry (032. Aquacultura), 11 firms in the extractive industries not specified (089. Indústrias extractivas, n.e.), 10 firms in the manufacture of
17 pulp, paper and paperboard industry (171. Fabricação de pasta, de papel e cartão (excepto
canelado)), 5 firms in the manufacture of refined petroleum products and fuel pellets industry
(192. Fabricação de produtos petrolíferos refinados e de aglomerados de combustíveis), 7 firms in the manufacture of cement, lime and plaster industry (235. Fabricação de cimento,
cal e gesso), 10 firms in the manufacture of computers and peripheral equipment (262 - Fabricação de computadores e de equipamento periférico), 13 firms in the shipbuilding
industry (301. Construção naval), 9 firms in the wastewater collection, drainage and treatment industry (370. Recolha, drenagem e tratamento de águas residuais), and 9 firms in the air passenger transport industry (511. Transportes aéreos de passageiros).
3.3. Summary Statistics
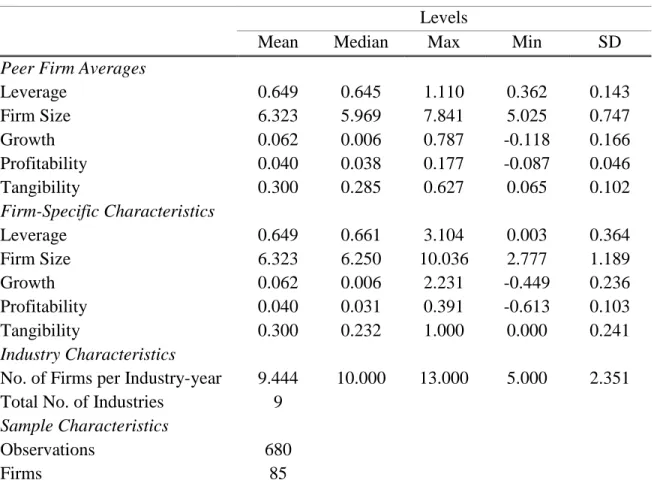
Table 3 – Descriptive Statistics
Levels
Mean Median Max Min SD
Peer Firm Averages
Leverage 0.649 0.645 1.110 0.362 0.143 Firm Size 6.323 5.969 7.841 5.025 0.747 Growth 0.062 0.006 0.787 -0.118 0.166 Profitability 0.040 0.038 0.177 -0.087 0.046 Tangibility 0.300 0.285 0.627 0.065 0.102 Firm-Specific Characteristics Leverage 0.649 0.661 3.104 0.003 0.364 Firm Size 6.323 6.250 10.036 2.777 1.189 Growth 0.062 0.006 2.231 -0.449 0.236 Profitability 0.040 0.031 0.391 -0.613 0.103 Tangibility 0.300 0.232 1.000 0.000 0.241 Industry Characteristics
No. of Firms per Industry-year 9.444 10.000 13.000 5.000 2.351 Total No. of Industries 9
Sample Characteristics
Observations 680
Firms 85
Table 3 presents means, medians, maximum, minimum, and standard deviations (SD) for variables of 85 firms over the period 2008 to 2015.Peer firm averages correspond to variables constructed as the average of all firms within an industry-year combination, not including the ith observation. Firm-specific characteristics correspond
18 Table 3 presents descriptive statistics for each variable we use in the analysis. Variables are divided into two different groups: peer firm averages and firm-specific characteristics. Peer firm averages correspond to variables constructed as the average of all firms within an industry-year combination, not including the ith observation. Firm-specific characteristics correspond to variables constructed as firm i’s value in year t (Leary and Roberts, 2014). For example, considering the Transportes Aéreos Portugueses, S.A. firm, peer firm averages, for each variable, correspond to the average of all firms in the air passenger transport industry, excluding the TAP, S.A. variables. These variables that were excluded are designated by firm-specific characteristics.
19
4. Empirical Results
In this section, we present the results of the regressions analysis (3.1), which is divided into four different subsections. Firstly, we present and analyze the results of the basic empirical model. Secondly, the conclusions concerning the sensitivity of peer’s financial policies of some firms within the industry are described. Then, we present more directly if peer firm behavior is driven by a leader-follower model in which less successful firms are influenced by more successful firms. Lastly, we perform robustness tests to complement the previous subsections and the empirical analysis.
4.1. Basic Empirical Model
The results of the estimation of equation (3.1) are presented in Table 4. Additionally, in model (1) is also presented the results without the peer firm average variables.
In order to find the most appropriate model, we perform three statistic tests: F-test, Breush-Pagan Lagrande multiplier (LM) and the Hausman test (Breusch and Breush-Pagan, 1980; Hausman, 1978). First, the F-test identifies whether the observed and unobserved fixed effects are equal across all units. The p-value is significant, validating the fixed effects model. Then, we perform the Breusch-Pagan Lagrange multiplier (Breusch and Pagan, 1980), which allows us to choose between pooled OLS and random effects. The result rejects the null hypothesis, so pooled OLS model is not suitable. Lastly, in order to help us to choose the most appropriate model between the fixed effects and random effects models, we perform the Hausman (1978) test. The probability of this test suggests that the most appropriate model is the fixed effects model.
Therefore, the most suitable model includes industry and year dummies to control for variables that are constant across industries and over time, respectively, and to capture the influence of aggregate trends. Furthermore, in order to validate our inference, we perform standard errors robust to heteroscedasticity. Finally, we also perform the Wald test. The p-value is significant, suggesting that the industry and year dummies are globally significant.
20
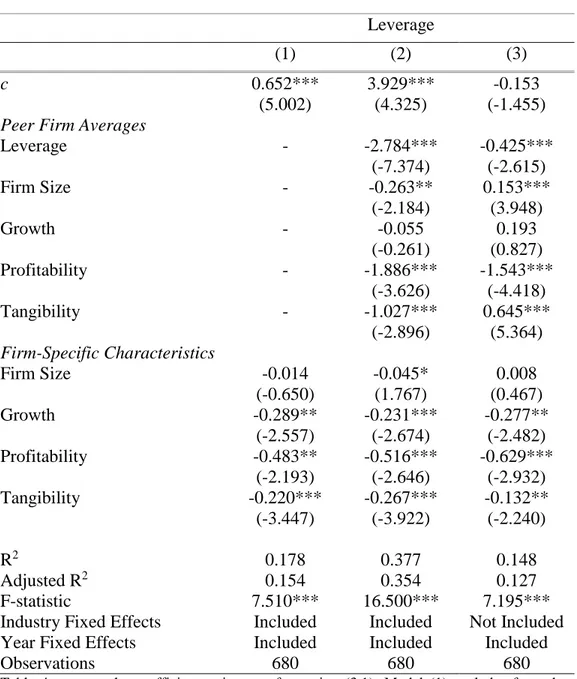
Table 4 – Estimation results for the total sample
Leverage (1) (2) (3) c 0.652*** (5.002) 3.929*** (4.325) -0.153 (-1.455)
Peer Firm Averages
Leverage - -2.784*** (-7.374) -0.425*** (-2.615) Firm Size - -0.263** (-2.184) 0.153*** (3.948) Growth - -0.055 (-0.261) 0.193 (0.827) Profitability - -1.886*** (-3.626) -1.543*** (-4.418) Tangibility - -1.027*** (-2.896) 0.645*** (5.364) Firm-Specific Characteristics Firm Size -0.014 (-0.650) -0.045* (1.767) 0.008 (0.467) Growth -0.289** (-2.557) -0.231*** (-2.674) -0.277** (-2.482) Profitability -0.483** (-2.193) -0.516*** (-2.646) -0.629*** (-2.932) Tangibility -0.220*** (-3.447) -0.267*** (-3.922) -0.132** (-2.240) R2 0.178 0.377 0.148 Adjusted R2 0.154 0.354 0.127 F-statistic 7.510*** 16.500*** 7.195***
Industry Fixed Effects Included Included Not Included Year Fixed Effects Included Included Included
Observations 680 680 680
Table 4 presents the coefficient estimates of equation (3.1). Model (1) excludes from the equation the peer firm average variables. Model (2) and (3) present, respectively, the results with and without industry fixed effects. The dependent variable is the firm leverage. Industries are defined by three-digit CAE-Rev. 3 code. Peer firm average characteristics and firm-specific characteristics’ variables are lagged 1 year relative to the dependent variable. T-statistics robust to heteroskedasticity are reported in parenthesis under each coefficient. Statistical significance is represented by * at 10%, ** at 5% and *** at 1%.
The R-square value of the model (2) shows that 37.7% of the variance regarding the firm leverage is explained by the independent variables. Furthermore, the p-value of the F-test indicates a high accuracy and confidence of the independent variables to explain the
21 dependent variable. The adjusted R-square of the model (2) is 20% greater than the model (1), which means that the factors which capture the potential herding behavior (i.e., peer firm averages) help to understand managers' decisions. Although the model (1) and (3) are also presented for comparison analysis, our analysis in this subsection is focused on the results of the model (2), following the approach of Leary and Roberts (2014).
Concerning the firm-specific characteristics, all capital structure determinants chosen are significant in explaining the level of leverage, which reinforces what was shown in previous studies (Bradley et al., 1984; Long and Malitz, 1985; Harris and Raviv, 1991). The negative impact of the growth opportunities on debt level is related to the existence of intangible assets that cannot be used as collateral in debt contracts, and so lenders will demand higher interest rates, creating a diminution in the leverage level (Zurigat, 2009). Besides, profitability and debt are also negatively related, i.e., more profitable firms will become less levered over time because they prefer internal finance instead of external funds, as predicted by the Pecking Order Theory. However, the relation between the tangibility and leverage is against the expectations. According to Ferri and Jones (1979), this happens because tangible assets can increase the variability of firm’s income, delaying the access to debt. Moreover, firm size and leverage are negatively related, as predicted by the Pecking Order Theory, which is also against the expectations. Nevertheless, the exclusion of industry dummy variables presents a positive relation between firm size and leverage, although this variable loses statistical significance.
Concerning the peer firm averages, the independent variables that present significant effect in explaining the leverage level are the peer firm leverage, firm size, profitability and tangibility. The peer firm average leverage presents a strongly negatively relation with the firm leverage. The negative sign suggests that peer firms’ leverage affects firm i in a similar way as firm i’s leverage. In addition, compared to firm-specific characteristics, peer firm financial policies have a significantly larger impact on capital structure, suggesting that the primary channel through which peer firms may influence capital structure is via peer firms’ policy decisions. In both models (2) and (3), the peer firm average characteristic that presents
22 more impact is profitability, while growth opportunities have not shown a statistical significance.
According to Appendix A, none of the explanatory variables are extremely correlated, except the growth opportunities of firms and their peer firms within the industry, which could explain why growth opportunities of peer firms have not a statically significance. All the other coefficients below 0.5 suggest that there is no significant multicollinearity between those variables.
In sum, the results indicate that firms’ leverage decisions are significantly influenced by the leverage decisions of their peers within the industry, which reveal that the peer firms have a significant effect and an important role in determining variation in corporate leverage ratios.
4.2. Sensitivity of Peer Firms
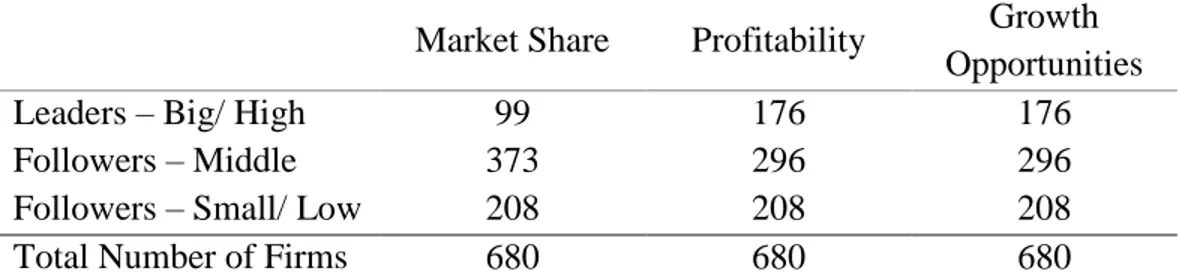
Given the importance of herding behavior in the sense of determining the firms’ capital structure, this section examines whether firms mimic one another. First of all, for each industry-year combination, firms are classified into three groups (Table 5) based on lagged values for firm-specific characteristics, such as market share (sales divided by industry sales), profitability and growth opportunities. Leaders are those firms above the third quartile of the distribution. However, the leaders’ firms according to market share were defined above 25%, being more consistent with values obtained. Followers are those firms below the third quartile of the distribution, in which the middle group of firms are those between the first and the third quartile, and the low group of firms are those below the first quartile.
Table 5 – Number of firms in each group classification of leaders and followers
Market Share Profitability Growth Opportunities
Leaders – Big/ High 99 176 176
Followers – Middle 373 296 296
Followers – Small/ Low 208 208 208
Total Number of Firms 680 680 680
Table 5 presents the number of firms in each group classification based on lagged values for firm-specific characteristics, such as market share, profitability and growth opportunities. Industries are defined by three-digit CAE-Rev. 3 code.
23
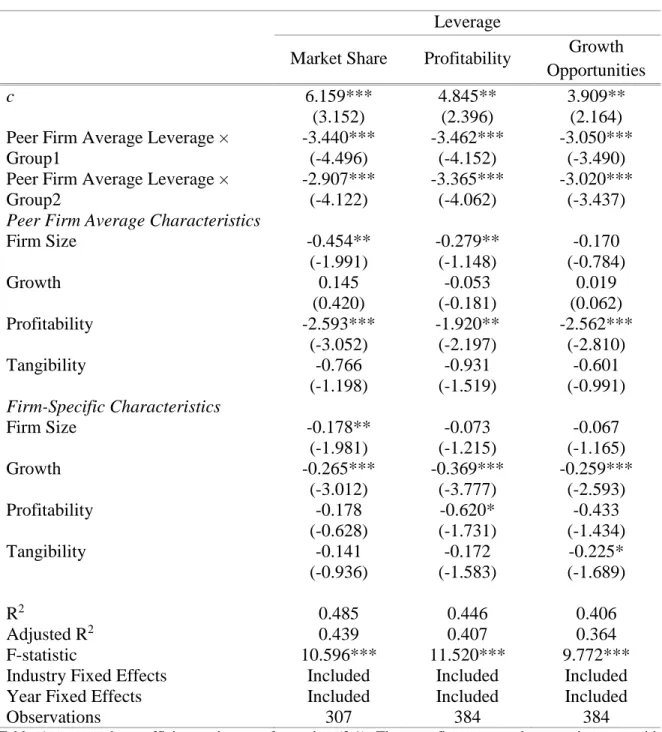
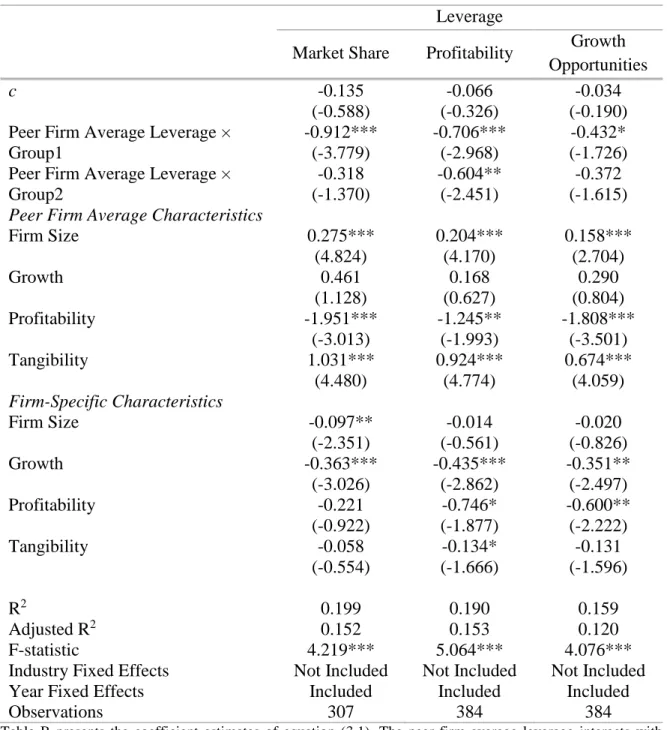
Table 6 – Estimation results of Sensitivity Analysis of Peer Firms
Leverage
Market Share Profitability Growth Opportunities c 6.159*** (3.152) 4.845** (2.396) 3.909** (2.164) Peer Firm Average Leverage ×
Group1 -3.440*** (-4.496) -3.462*** (-4.152) -3.050*** (-3.490) Peer Firm Average Leverage ×
Group2 -2.907*** (-4.122) -3.365*** (-4.062) -3.020*** (-3.437)
Peer Firm Average Characteristics
Firm Size -0.454** (-1.991) -0.279** (-1.148) -0.170 (-0.784) Growth 0.145 (0.420) -0.053 (-0.181) 0.019 (0.062) Profitability -2.593*** (-3.052) -1.920** (-2.197) -2.562*** (-2.810) Tangibility -0.766 (-1.198) -0.931 (-1.519) -0.601 (-0.991) Firm-Specific Characteristics Firm Size -0.178** (-1.981) -0.073 (-1.215) -0.067 (-1.165) Growth -0.265*** (-3.012) -0.369*** (-3.777) -0.259*** (-2.593) Profitability -0.178 (-0.628) -0.620* (-1.731) -0.433 (-1.434) Tangibility -0.141 (-0.936) -0.172 (-1.583) -0.225* (-1.689) R2 0.485 0.446 0.406 Adjusted R2 0.439 0.407 0.364 F-statistic 10.596*** 11.520*** 9.772***
Industry Fixed Effects Included Included Included
Year Fixed Effects Included Included Included
Observations 307 384 384
Table 6 presents the coefficient estimates of equation (3.1). The peer firm average leverage interacts with indicator variables identifying the lower and higher third of distribution of lagged values within industry-year combination for firm-specific measures, such as market share, profitability, and growth opportunities. Group 1 is defined by follower firms and group 2 by leader firms. The subsample of firms excludes the middle third of the distribution for each regression. The dependent variable is the firm leverage. Industries are defined by three-digit CAE-Rev. 3 code. Peer firm average characteristics and firm-specific characteristics’ variables are lagged 1 year relative to the dependent variable. T-statistics robust to within-firm correlation and heteroskedasticity are reported in parenthesis under each coefficient. Statistical significance is represented by * at 10%, ** at 5% and *** at 1%.
24 Table 6 presents the sensitivity of peer’s financial policies of some firms within the industry, if they are more or less sensitive to their peer firms. So, we estimate the equation (3.1) for each firm-specific characteristic presented in Table 5, excluding the middle third of the distribution, as adopted by Leary and Roberts (2014). Group 1 is defined by follower firms and group 2 by leader firms.
Similarly, to the previous section, we perform three statistic tests for each indicator variable: F-test, Breush-Pagan Lagrande multiplier (LM) and the Hausman test, to identify the most appropriate model, (Breusch and Pagan, 1980; Hausman, 1978). The most suitable model includes industry and year dummies to control for variables that are constant across industries and over time, respectively, and to capture the influence of aggregate trends. However, the model with only year dummy variables included are also displayed as well in Appendix B. The results show that follower firms are more sensitive to their peers than are the leader firms within the industry. Market share is the indicator variable that presents the most significant difference between peer firms’ average leverage, i.e., smaller firms are more sensitive to their peer firms than the bigger firms, as presented by Leary and Roberts (2014). Moreover, less profitable firms also reveal more sensitivity to peer firms than their counterparts. Concerning growth opportunities, there is also evidence, although not as strong as the other indicator variables mentioned previously.
4.3. Leader-follower Model
Table 7 analyzes whether peer firms reveal herding behavior, following a leader-follower model in which less successful firms are influenced by more successful firms within the industry. Thus, firms are classified into two groups, leaders and followers, within each industry-year, in which we define these groups according to different measures of success, such as market share and profitability (see Table 5). The leader firms are excluded from the sample, analyzing only the follower firms. Then, we estimate the model (3.1) on this subsample using the peer firm leverage of the leader firms, instead of the follower firms. Hereupon, we are examining whether follower firms are sensitive to the corporate financial policies of leader firms.
25
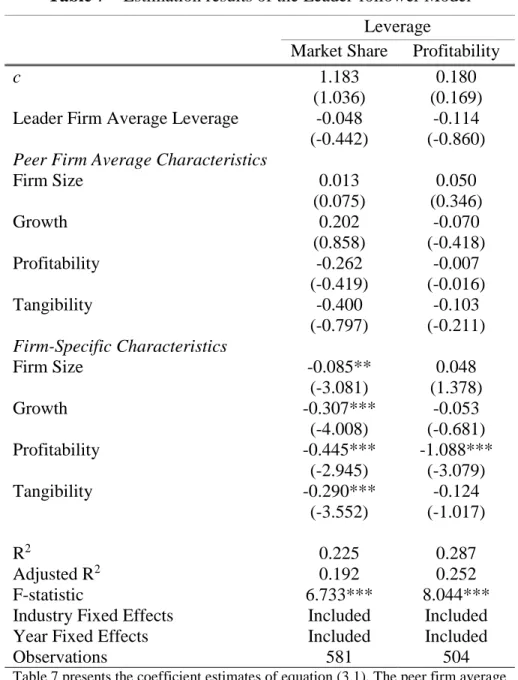
Table 7 – Estimation results of the Leader-follower Model
Leverage
Market Share Profitability
c 1.183
(1.036)
0.180 (0.169) Leader Firm Average Leverage -0.048
(-0.442)
-0.114 (-0.860)
Peer Firm Average Characteristics
Firm Size 0.013 (0.075) 0.050 (0.346) Growth 0.202 (0.858) -0.070 (-0.418) Profitability -0.262 (-0.419) -0.007 (-0.016) Tangibility -0.400 (-0.797) -0.103 (-0.211) Firm-Specific Characteristics Firm Size -0.085** (-3.081) 0.048 (1.378) Growth -0.307*** (-4.008) -0.053 (-0.681) Profitability -0.445*** (-2.945) -1.088*** (-3.079) Tangibility -0.290*** (-3.552) -0.124 (-1.017) R2 0.225 0.287 Adjusted R2 0.192 0.252 F-statistic 6.733*** 8.044***
Industry Fixed Effects Included Included
Year Fixed Effects Included Included
Observations 581 504
Table 7 presents the coefficient estimates of equation (3.1). The peer firm average leverage is replaced by leader firm average leverage. The subsample of firms includes the lower and middle third of the distribution (i.e., Followers firms) for each regression. The dependent variable is the firm leverage. Industries are defined by three-digit CAE-Rev. 3 code. Peer firm average characteristics and firm-specific characteristics’ variables are lagged 1 year relative to the dependent variable. T-statistics robust to within-firm correlation and heteroskedasticity are reported in parenthesis under each coefficient. Statistical significance is represented by * at 10%, ** at 5% and *** at 1%.
Similarly, to the previous section, we perform three statistic tests for each measure of success: F-test, Breush-Pagan Lagrande multiplier (LM) and the Hausman test, to identify the most
26 appropriate model, (Breusch and Pagan, 1980; Hausman, 1978). The most suitable model includes industry and year dummies to control for variables that are constant across industries and over time, respectively, and to capture the influence of aggregate trends. However, the model with only year dummy variables included are also displayed as well Appendix C. According to the table 7, the results show no statistically significance, which suggests that follower firms are not sensitive to leader firms in financial policy choices. Therefore, the capital structure of smaller firms and less profitable firms are not influenced by the leverage of their more successful counterparts within the industry. This result contradicts the conclusion obtained by Leary and Roberts (2014). Furthermore, for both measures of success, peer firm average characteristics also present no significant effect on firm leverage.
4.4. Robustness Tests
In this section, we further perform two robustness checks to test the results presented in the previous section, complementing the empirical analysis. Firstly, the group of follower firms was divided into two groups within each industry-year (see Table 5), estimating only whether middle third of follower firms’ distribution are driven by a leader-follower model. Lastly, we perform a falsification test by re-estimating the regression analysis using the sample of leader firms and the peer firm leverage of the followers.
4.4.1. Leader-follower Model
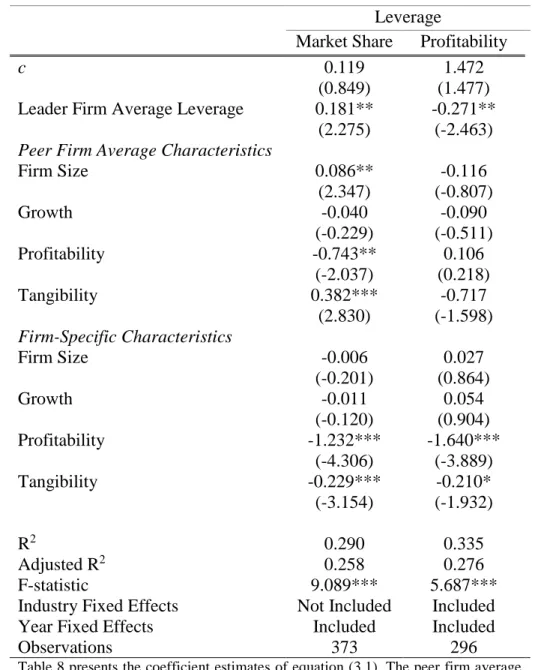
The results presented in table 8 show statistically significance, suggesting that some follower firms within the industry are sensitive to leader firms in financial policy decisions. Therefore, for both measures of success considered, the capital structure of middle third firms’ distribution are influenced by the leverage of their more successful counterparts within the industry. However, the leader firm average leverage variables of the different measures of success present opposite signals. Market share presents a positive signal of this variable, which means that leader firm leverage has a positive impact in follower firm leverage. The negative signal presented by profitability suggests that leader firm leverage affect follower firm leverage in a similar way as follower firm leverage. Apart from that, there was also analysed whether low third of follower firms’ distribution are driven by a leader-follower
27 model (see Appendix D). Nevertheless, the results presented no statistically significance, being consistent to the previous section.
Table 8 – Estimation results of the Leader-follower Model, excluding low third of follower
firms’ distribution
Leverage
Market Share Profitability
c 0.119
(0.849)
1.472 (1.477) Leader Firm Average Leverage 0.181**
(2.275)
-0.271** (-2.463)
Peer Firm Average Characteristics
Firm Size 0.086** (2.347) -0.116 (-0.807) Growth -0.040 (-0.229) -0.090 (-0.511) Profitability -0.743** (-2.037) 0.106 (0.218) Tangibility 0.382*** (2.830) -0.717 (-1.598) Firm-Specific Characteristics Firm Size -0.006 (-0.201) 0.027 (0.864) Growth -0.011 (-0.120) 0.054 (0.904) Profitability -1.232*** (-4.306) -1.640*** (-3.889) Tangibility -0.229*** (-3.154) -0.210* (-1.932) R2 0.290 0.335 Adjusted R2 0.258 0.276 F-statistic 9.089*** 5.687***
Industry Fixed Effects Not Included Included
Year Fixed Effects Included Included
Observations 373 296
Table 8 presents the coefficient estimates of equation (3.1). The peer firm average leverage is replaced by leader firm average leverage. The subsample of firms excludes the lower and upper third of the distribution for each regression. The dependent variable is the firm leverage. Industries are defined by three-digit CAE-Rev. 3 code. Peer firm average characteristics and firm-specific characteristics’ variables are lagged 1 year relative to the dependent variable. T-statistics robust to within-firm correlation and heteroskedasticity are reported in parenthesis under each coefficient. Statistical significance is represented by * at 10%, ** at 5% and *** at 1%.
28
4.4.2. Follower-leader Model
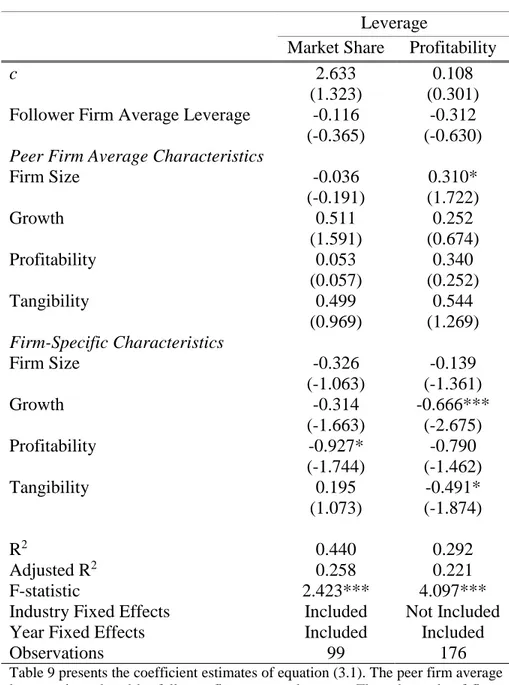
Table 9 – Estimation results of the Follower-leader Model
Leverage
Market Share Profitability
c 2.633
(1.323)
0.108 (0.301) Follower Firm Average Leverage -0.116
(-0.365)
-0.312 (-0.630)
Peer Firm Average Characteristics
Firm Size -0.036 (-0.191) 0.310* (1.722) Growth 0.511 (1.591) 0.252 (0.674) Profitability 0.053 (0.057) 0.340 (0.252) Tangibility 0.499 (0.969) 0.544 (1.269) Firm-Specific Characteristics Firm Size -0.326 (-1.063) -0.139 (-1.361) Growth -0.314 (-1.663) -0.666*** (-2.675) Profitability -0.927* (-1.744) -0.790 (-1.462) Tangibility 0.195 (1.073) -0.491* (-1.874) R2 0.440 0.292 Adjusted R2 0.258 0.221 F-statistic 2.423*** 4.097***
Industry Fixed Effects Included Not Included
Year Fixed Effects Included Included
Observations 99 176
Table 9 presents the coefficient estimates of equation (3.1). The peer firm average leverage is replaced by follower firm average leverage. The subsample of firms includes the upper third (i.e., Leaders firms) of the distribution for each regression. The dependent variable is the firm leverage. Industries are defined by three-digit CAE-Rev. 3 code. Peer firm average characteristics and firm-specific characteristics’ variables are lagged 1 year relative to the dependent variable. T-statistics robust to within-firm correlation and heteroskedasticity are reported in parenthesis under each coefficient. Statistical significance is represented by * at 10%, ** at 5% and *** at 1%.
29 Table 9 analyzes whether leader firms are driven by a follower-leader model, i.e., whether more successful firms are influenced by less successful firms. The results show no significant effect, statistically or economically, which allows us to conclude that leader firms’ capital structure decisions appear insensitive to the follower firms. This conclusion is also presented by Leary and Roberts (2014).
30
5. Conclusions
The main goal of this research was to investigate whether an individual firm is sensitive to peer firms within the industry on capital structure decisions and whether peer firm behavior is driven by a leader-follower model in which less successful firms are influenced by more successful firms, using panel data of 85 Portuguese firms of 9 industries for the period of 2008 to 2015.
The results show that peer firm averages that present significant effect in explaining the capital structure policy are the leverage, firm size, profitability and tangibility of peer firms. The peer firm average leverage presents a strongly negatively relation with the firm leverage, which suggests that peer firms’ leverage affects firm i in a similar way as firm i’s leverage. In addition, compared to firm-specific characteristics, peer firm financial policies have a significantly larger impact on capital structure, suggesting that the primary channel through which peer firms may influence capital structure is via peer firms’ policy decisions. These results contradict the researches developed by Filbeck et al. (1996), and Oruç and Sen (2009), in which they found no support for herding behavior of firms within the industry.
Furthermore, it is possible to conclude that herding behavior is concentrated among smaller and less successful firms, which reveals more sensitivity to their peer firms than the counterparts within the industry, being consistent with the conclusion of the study made by Leary and Roberts (2014). However, only some followers’ firms are influenced by the leverage of their more successful counterparts within the industry. Given this, since some smaller and less successful firms are sensitive to their leader peer firms within the industry, the herding behavior of managers in capital structure decisions might suggest a connection to the informational cascade theory. By contrast, the capital structure decisions of leader firms are insensitive to their less successful peer firms.
The peer firm effect, that captures the potential herding behavior in capital structure decisions, helps to understand the managers' behavior. Most theories about the capital structure usually ignore the herding effect in corporate financing decisions, which leads to asking if they are not incomplete considering the results obtained.
31 In sum, this research has shown that managers do not make isolated decisions in determining the optimal capital structure of firms. As such, the financing decisions and characteristics of peer firms are significant determinants of corporate financial policies.
This research presents some limitations. The first one is the use of book leverage and the exclusion of market leverage. Moreover, the data available severely restricts our capacity to develop proxies for other determinants of capital structure, which could affect the statistical inference and consequentially the results. Lastly, the sample period includes the international financial crisis, which may have affected the results, and therefore the question remains whether the conclusions are generalizable.
Lastly, regarding future research suggestions, this work can be applied to a more extent sample based on the significant and other countries. Most of the studies developed are for firms from United States. Besides, the sample can also include more years in order to estimate a dynamic model for firms’ capital structure, thus making it possible to isolate the “crisis” effect.
32
References
Acedo-Ramirez, M. A. and F. J. Ruiz-Cabestre (2014), “Determinants of Capital Structure: United Kingdom Versus Continental European Countries”, Journal of International
Financial Management & Accounting, Vol. 25, No. 3, pp. 237-270.
Baker, M. and J. Wurgler (2002), “Market Timing and Capital Structure”, Journal of
Finance, Vol. 57, No. 1, pp. 1-32.
Bikhchandani, S., D. Hirshleifer and I. Welch (1992), “A Theory of Fads, Fashion, Custom, and Cultural Change as Informational Cascades”, Journal of Political Economy, Vol. 100, No. 5, pp. 992-1026.
Bolton, P., and D. Scharfstein, (1990), “A theory of predation based on agency problems in financial contracting”, American Economic Review, Vol. 80, pp. 93–106.
Boyson, N. M. (2010), “Implicit incentives and reputational herding by hedge fund managers”, The Journal of Empirical Finance, Vol. 17, No. 3, pp. 283-299.
Bradley, M., G. Jarrell and E. Kim (1984), “On the Existence of an Optimal Capital Structure: Theory and Evidence,” Journal of Finance, Vol. 39, No. 3, pp. 857-878.
Brander, J.A. and T.R. Lewis (1986), “Oligopoly and Financial Structure: The Limited Liability Effect”, American Economic Review, Vol. 76, pp. 956-970.
Breusch, T. S. and A. R. Pagan (1980), “The Lagrange Multiplier Test and its Applications to Model Specification in Econometrics”, The Review of Economic Studies, Vol. 47, No. 1, pp. 239-253.
Chevalier, J. A. and D. S. Scharfstein (1996), “Capital-market imperfections and counter-cyclical markups: Theory and evidence”, American Economic Review, Vol. 85, pp. 703–725. Chui, A. C. W., A. E. Lloyd and C. C. Y. Kwok (2002), “The Determination of Capital Structure: Is National Culture a Missing Piece to the Puzzle?”, Journal of International
Business Studies, Vol. 33, No. 1, pp. 99-127.
Damodaran, A. (2010), Applied Corporate Finance, 3rd edn. (John Wiley & Sons, Hoboken, NJ).