INSTITUTO DE INVESTIGAÇÃO E FORMAÇÃO AVANÇADA ÉVORA, Dezembro 2016
ORIENTADOR (A/ES):Carlos Alberto Falcão Marques Maria Teresa Pinto Correia Tese apresentada à Universidade de Évora para obtenção do Grau de Doutor em Gestão Interdisciplinar da Paisagem
Ana Margarida Pinto da Fonseca
EMERGETIC EVALUATION OF CATTLE
UNIVERSIDADE DE ÉVORA
Emergetic evaluation of cattle rearing in a Montado farm
Ana Margarida Pinto da Fonseca
ORIENTADOR (A/ES): Professor Doutor Carlos Alberto Falcão
Marques
Professora Doutora Maria Teresa Pinto Correia
Dissertação Dezembro de 2016
“In fact, the crisis is the result of the overgrowth of financial assets
relative to growth of real wealth – basically the opposite of too little
liquidity. We need to take a step back and explore some of the
fundamentals that growth-obsessed economists and commentators
tend to neglect”
ix
Acknowledgements
I am grateful to my supervisors, Professors Carlos Falcão Marques and Teresa Pinto-Correia for their support and encouragement throughout my graduate studies. Professor Daniel Campbell from Environmental Protection Agency, United States, supervised closely my studies, introducing and guiding me through the emergy evaluation method and the energy systems approach, always accompanied with great friendship and affection. Special thanks are also due to the farm owner, his father and the accounting officer of the farm for their patience, constant availability and sympathy. I am grateful to Centro de Geofísica de Évora (Évora Geophysics Center) for their kind help in the collection of meteorological data and to the Soil Laboratory of University of Évora for the soil analyses. I am also grateful to Professor Carlos Oliveira, from Lusíada University, for his friendship and for sharing the determination of the Emergy to Money Ratio for Portugal for the year 2012. This work has been supported by Fundação para a Ciência e Tecnologia (Foundation for Science and Technology) through a PhD grant attributed to Ana Fonseca (SFRH/BD/76814/2011) under the POPH-QREN-Tipologia 4.1 Programme. This work was funded by FEDER Funds through the Operational Programme for Competitiveness Factors - COMPETE and National Funds through FCT - Foundation for Science and Technology under the Strategic Projects PEst-C/AGR/UI0115/2011 and PEst-C/QUI/UI0062/2011. I also would like to acknowledge ISAER - International Society for the Advancement of Emergy Research for the two grants that allowed me to participate in the 7th and 8th Biennial Conferences of ISAER at Gainesville, University of Florida. Finally I would like to acknowledge to my parents for their permanent support, interest and friendship.
1
Resumo
Avaliação emergética de uma exploração pecuária em Montado
O Montado, em Portugal, é um complexo sistema silvopastoril de uso da terra, tipicamente Mediterrânico, com diversos estratos de vegetação, incluindo sobreiro e azinheira em várias densidades, onde é frequente a criação de gado. Esta actividade pecuária beneficia das pastagens no sob-coberto, de algumas espécies arbustivas e também das bolotas que caem do coberto arbóreo, contribuindo para evitar a invasão da pastagem por matos. No entanto, dependendo da sua gestão, este gado pode comprometer a regeneração do sistema. Nos últimos 20 anos, os subsídios no âmbito da Política Agrícola Comum da União Europeia têm promovido a criação de gado bovino em detrimento de outras espécies e raças mais leves, bem como a intensificação desta produção. Esta intensificação pode impossibilitar a regeneração natural das árvores ameaçando o equilíbrio do Montado. Por esta razão é necessária uma avaliação focada na criação de gado bovino e nos seus impactos sobre o sistema. O objectivo deste estudo foi obter uma melhor compreensão do funcionamento de uma exploração silvopastoril num sistema de Montado, através da aplicação do Método de Avaliação Emergética e do cálculo de índices emergéticos. Pretende-se assim compreender a melhor forma de o gerir, bem como conceber estratégias que maximizem o fluxo de emergia na exploração. Uma comparação deste método com a avaliação económica permitiu perceber em que aspectos esta pode ser complementada pelo método da avaliação emergética. O método da avaliação emergética permite a avaliação de sistemas multifuncionais complexos à escala de uma exploração individual, fornecendo informação extra em relação à avaliação económica como a renovabilidade dos inputs do sistema, ou a quantidade de fluxos livres da natureza que é valorada por preços de mercado. Este método permite a integração das emternalidades e das externalidades à contabilização económica, transformando uma avaliação tendencialmente separada do seu sistema mais vasto, numa avaliação de um sistema em conexão com aqueles mais vastos nos quais se integra.
3
Abstract
The Montado, in Portugal, is a complex silvo-pastoral system of land use, typically Mediterranean, with different strata of vegetation, including cork and holm oaks in various densities, and where cattle rearing is common. This stockfarm benefits from the herbaceous layer under the trees, as well as from some species in the shrub layer, and also from the acorns faling down from the tree cover, while contributing to prevent the invasion of pastures by shrubs. Nevertheless, depending on its management, livestock can affect the system regeneration. Over the past 20 years, subsidies of the European Union's common agricultural policy have promoted the cattle rearing at expense of other lighter species and breeds, as well as its intensification. This intensification may impair the natural regeneration of trees threatening the balance of the Montado. Therefore an assessment focused on cattle and their impact on the system is required. The purpose of this study was to obtain a better understanding of the functioning of a silvo-pastoral farm in a Montado system, by applying the emergy evaluation method and through the calculation of emergy indices. It is intended to understand the best way to manage and design strategies that maximize the emergy flow on the farm. A comparison of this method with the economic evaluation allowed to realize in what aspects it can be complemented by the emergy evaluation method. The emergy evaluation method alows the assessment of complex multi-functional systems at the scale of an individual farm, providing extra information in relation to economic avaluation as the renewability of the inputs to a system and the amount of free flows of nature that is valued by market prices. This method allows the integration of the emternalities and the externalities to the economic accounting, transforming an evaluation tended separated from its wider system, in an evaluation of a system in connection with the larger ones on which it is incorporated.
5
List of Figures
FIGURE 1 – ENERGY TRANSFORMATION HIERARCHY. (A) SPATIAL VIEW OF UNITS AND THEIR TERRITORIES. (B) ENERGY NETWORK INCLUDING TRANSFORMATION AND FEEDBACKS. (C) AGGREGATION OF ENERGY NETWORKS INTO AN ENERGY CHAIN. (D) BAR GRAPH OF THE ENERGY FLOWS FOR THE LEVELS IN ENERGY HIERARCHY. (E) BAR
GRAPH OF SOLAR TRANSFORMITIES. ADAPTED FROM ODUM (1996). ...29
FIGURE 2 – THE MAXIMUM POWER PRINCIPLE IN ESL (ADAPTED FROM ODUM AND ODUM 2000). ...31
FIGURE 3 – ENERGY SYSTEMS LANGUAGE (ODUM 1983, 1994) USED IN THE CONSTRUCTION OF ALL DIAGRAMS OF THIS STUDY. ...31
FIGURE 4 – INDEPENDENT SOURCES OF AVAILABLE ENERGY (SOLAR RADIATION, S, DEEP EARTH HEAT, E, AND THE GRAVITATIONAL ATTRACTION OF THE MOON AND SUN, G) RECEIVED BY THE EARTH. ADAPTED FROM ODUM (2007). ...32
FIGURE 5 – ESL DIAGRAM FOR A PINE PLANTATION ADAPTED FROM ODUM (2007). ...34
FIGURE 6 – SYSTEMS DIAGRAM OF THE ECONOMIC USE OF ENVIRONMENTAL PRODUCTS. ADAPTED FROM ODUM (2007). ...35
FIGURE 7 - AGGREGATE ENERGY SYSTEMS LANGUAGE DIAGRAM DESCRIBES A PROCESS BASED ON RENEWABLE INPUTS RECEIVED IN THE SYSTEM (R), LOCAL NONRENEWABLE INPUTS (N) AND INPUTS PURCHASED FROM OUTSIDE (F) THAT INCLUDE GOODS (M) AND SERVICES AND LABOR (S). SYMBOLS: ENERGY SOURCE (CIRCLE), ENVIRONMENTAL PRODUCTION SYSTEM (BULLET-SHAPE), STORAGE (TANK), LINES WITH ARROWHEADS (PATHWAYS CARRYING ENERGY, MATERIAL, OR INFORMATION), RECTANGLE (GENERAL PURPOSE SYMBOL, IN THIS CASE ECONOMIC USE) AND HEAT SINK (ARROW TO GROUND). SOURCE: (BROWN & ULGIATI, 1997; ODUM, 1996, P. 83). ...37
FIGURE 8 – OVERALL STRUCTURE OF AN EMERGY ACCOUNTING TABLE. ...37
FIGURE 9 - MAP WITH THE LOCATION OF THE HOLM OAKS FARM. ...56
FIGURE 10 - AERIAL PHOTOGRAPH OF HOLM OAKS FARM, WITH THE LIMITS AND DELIMITATION OF THE LAND USE USING THE LETTERS OF TABLE 2...58
FIGURE 11 - BOUNDARIES OF THE SYSTEM STUDIED IN THIS APPROACH (NOT TO SCALE). ...60
FIGURE 12 - ESL DIAGRAM OF THE HOLM OAKS FARM ...61
FIGURE 13 - DIAGRAM REPRESENTING THE WATER FLOWS (IN LITERS PER YEAR) IN THE HOLM OAKS FARM. ...70
FIGURE 14 – DISTINCTION BETWEEN OUTPUT SPLITS (A)) AND CO-PRODUCTS (B)). ... 109
FIGURE 15 - SIMPLIFIED DIAGRAMS OF THE EMERGY FLOWS IN HOLM OAKS FARM FOR THE WHOLE SYSTEM AS A) AN INTEGRATED PRODUCTION SYSTEM, B) FOR CATTLE PRODUCTION, C) CORK AND D) FIREWOOD. ... 129
FIGURE 16 – ESL REPRESENTATION OF THE EMERGY PERSPECTIVE ABOUT THE INTEGRATION OF THE ECONOMIC SYSTEM IN THE GLOBAL SYSTEM. ADAPTED FROM ODUM (1996) ... 139
FIGURE 17 – BAR CHART WITH THE COMPARISON BETWEEN THE REAL PRICES ($) AND THE EMDOLLAR EQUIVALENTS (EM$) FOR EACH INPUT OF THE HOLM OAKS FARM. ... 144
6
FIGURE 18 - AGGREGATE ESL DIAGRAM REPRESENTING THE EMERGY AND MONEY FLUXES AGGREGATED BY FUNCTION. EMERGY FLUXES ARE IN SEJ AND NORMAL LETTERING, MONEY FLUXES ARE PRESENTED IN $ AND BY THE EMERGY THAT IS POSSIBLE TO BUY WITH THIS MONEY (IN ITALIC) BELOW. ... 151 FIGURE 19 – BAR CHART WITH THE RENEWABLE AND NONRENEWABLE EMERGY COMPONENT OF EACH INPUT AND OUTPUT OF THE HOLM OAKS FARM. ... 155
7
List of Tables
TABLE 1 - MAIN EMERGY INDICES AND FORMULAS USED IN EMERGY EVALUATION. (R) RENEWABLE INPUTS RECEIVED BY THE SYSTEMS, (Y) TOTAL OF THE INPUTS USED, (F) PURCHASED GOODS (M) AND SERVICES (S) USED IN THE SYSTEM AND THAT INCLUDE LABOR, (N) LOCAL NONRENEWABLE INPUTS; (I) FREE INPUTS TO THE SYSTEM CORRESPONDING TO THE SUM OF THE RENEWABLE INPUTS PLUS THE LOCAL NONRENEWABLE INPUTS RECEIVED BY
THE SYSTEM (I=R+N). ...38
TABLE 2 - LAND COVER SCHEME IN HOLM OAKS FARM WHERE A) CORRESPONDS TO HOLM OAKS AREA, B) TO CORK OAKS AREA, C) TO THE OPEN AREAS BETWEEN THE TREES, D) TO THE REGENERATION AREA, AND E) TO THE OPEN AREAS THAT ARE FERTILIZED AND USED TO MAKE BALES. ...57
TABLE 3 - LEGEND TO THE ESL DIAGRAM PATHWAY FLOWS. ...63
TABLE 4 – COMPILATION OF THE PREVIOUS BASELINES AND THE CONVERSION FACTORS BY WHICH THE TRANSFORMITIES MUST BE MULTIPLIED TO OBTAIN THE CORRESPONDING VALUES IN THE BASELINE 1.2E+25 SEJ Y-1. ...65
TABLE 5 - ACTIVITIES DEVELOPED IN THE HOLM OAKS FARM. ...84
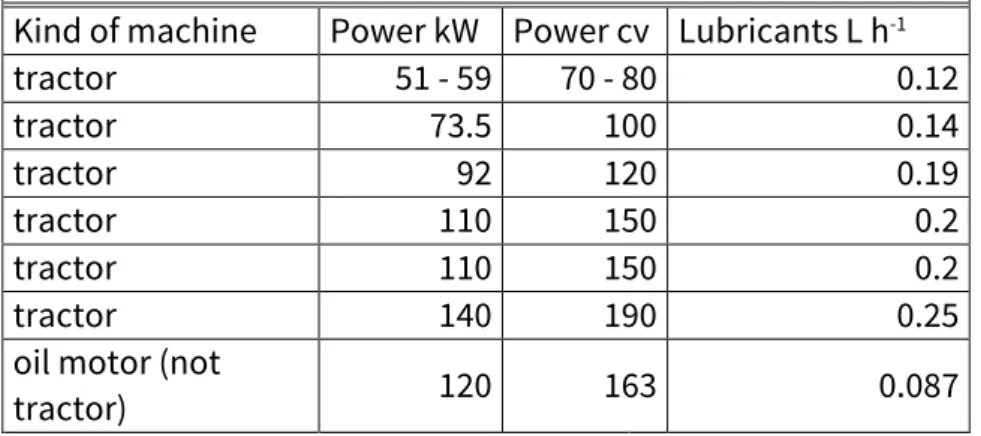
TABLE 6 - AVERAGE CONSUMPTION OF LUBRICANTS FOR MACHINES (SANTOS, 1996, P.25) ...85
TABLE 7 – MACHINES USED ON THE FARM ...87
TABLE 8 – WORKING HOURS IN THE DIFFERENT ACTIVITIES...93
TABLE 9 – DETERMINATION OF THE RENEWABILITY OF THE EUROPEAN SUBSIDIES ... 105
TABLE 10 – BALANCE SHEET ACCOUNTS USED ON THE ESTIMATION OF MONETARY VALUES FOR SOME GOODS AND SERVICES USED IN HOLM OAKS FARM AND REASONING UNDERLYING THE ESTIMATION OF THE CORRESPONDING AMOUNT USED IN THIS FARM. ... 113
TABLE 11 – DISTRIBUTION OF THE PRICE OF MACHINERY BY THE DIFFERENT ACTIVITIES OF THE FARM. ... 117
TABLE 12 – HOURS ASSIGNED TO EACH ACTIVITY AND CORRESPONDING MARKET PRICES ($) FROM THE MANAGER AND PURCHASED LABOR. PURPLE COLOR LINES CORRESPONDS TO LABOR TO CATTLE, PINK COLOR LINES CORRESPONDS TO LABOR LINKED TO HAY, WHITE COLOR LINES CORRESPOND TO LABOR FOR OTHER WORK, AND LIGHT BLUE COLOR LINES CORRESPOND TO LABOR TO FENCES. ... 120
TABLE 13 – EMERGY ACCOUNTING TABLE FOR THE HOLM OAKS FARM... 124
TABLE 14 - EMERGY INDICES FOR MONTADO FARM. ... 125
TABLE 15 - AGGREGATED EMERGY FLOWS OF THE HOLM OAKS FARM (EXCLUDING SUBSIDIES, RENT AND TAXES BUT INCLUDING LABOR), BY ACTIVITY ... 126
TABLE 16 – EMERGY INDICES OF THE HOLM OAKS FARM BY ACTIVITY. ... 130
TABLE 17 – COMPARISON OF THE HOLM OAKS FARM WITH OTHER SYSTEMS OF THE WORLD... 130
TABLE 18 - COMPARISON BETWEEN EMERGY INPUTS TO THE HOLM OAKS FARM, ARGENTINE PAMPAS AND FLORIDA PRODUCTION SYSTEMS (SEJ HA-1 Y-1). ... 132
8
TABLE 20 - LIFETIME PERIODS ATTRIBUTED TO THE EQUIPMENT IN THE FIRST (FONSECA ET AL., 2016) AND SECOND EVALUATIONS. ... 139 TABLE 21 – EMERGY ACCOUNTING TABLE FOR THE HOLM OAKS FARM WITH LARGER DEPRECIATION RATES FOR THE EQUIPMENT. ... 140 TABLE 22 – DETERMINATION OF THE EMERGY EXCHANGE RATIO (EER) FOR THE DIFFERENT OUTPUTS OF THE FARM ... 142 TABLE 23 – COMPARISON BETWEEN THE EMERGY OF FARMS INPUTS, ITS PRICES, THE CORRESPONDING EMDOLLARS AND THE EMERGY IN THE MONEY ... 143 TABLE 24 - EMERGY VERSUS BUDGET ACCOUNTING FOR THE MONTADO FARM. ... 146 TABLE 25 – DISTRIBUTION OF EXPENSES AND REVENUES ($) BETWEEN THE OWNER AND THE MANAGER OF HOLM OAKS FARM. ... 152 TABLE 26 – DISTRIBUTION OF EXPENSES AND REVENUES (SEJ) BETWEEN THE OWNER AND THE MANAGER OF HOLM OAKS FARM. ... 153 TABLE 27 – DETERMINATION OF THE NONRENEWABLE EMERGY EXCHANGE RATIO (EERN) FOR THE DIFFERENT OUTPUTS OF THE FARM... 156 TABLE 28 – DETERMINATION OF THE ANNUAL INVESTMENT, AND CORRESPONDING AREA, IN ORDER TO COMPENSATE THE IMPACTS OF CALVES’ PRODUCTION ... 158
9
List of Acronyms
AFN Autoridade Florestal NacionalCAP Common Agricultural Policy CGE Centro de Geofísica de Évora EER Emergy Exchange Ratio
EERN Nonrenewable Emergy Exchange Ratio EIR Emergy Investment Ratio
ELR Emergy Loading Ratio ESI Emergy Sustainability Index ESL Energy Systems Language EST Energy Systems Theory EYR Emergy Yield Ratio
GIS Geographic Information System
ICNB Instituto da Conservação da Natureza e da Biodiversidade IFIAS International Federation of Institutes of Advanced Studies ISAER International Society for the Advancement of Emergy Research ISO International Organization for Standardization
LNEC Laboratório Nacional de Engenharia Civil
SEARN Secretaria de Estado do Ambiente e Recursos Naturais SETAC Society of Environmental Toxicology and Chemistry SOM Soil Organic Matter
TEEB The Economics of Ecosystems and Biodiversity UEV Unit Emergy Value
11
Contents
ACKNOWLEDGEMENTS ... IX RESUMO ... 1 ABSTRACT ... 3 LIST OF FIGURES ... 5 LIST OF TABLES ... 7 LIST OF ACRONYMS ... 9 CONTENTS ...11 PREAMBLE ...13 1. INTRODUCTION ...15 1.1OBJECTIVES ... 16 1.2ORGANIZATION ... 17 2. CONCEPTS & METHODS ...21 2.1AVAILABLE METHODS FOR RESOURCES ASSESSMENT ... 21 2.2THE EMERGY EVALUATION METHOD ... 262.2.1 History of the development of the concept of emergy ... 26 2.2.2 Defining the method ... 28 2.2.3Application to general systems ... 31 2.2.4 Application to farming systems ... 39
3. THE PORTUGUESE SILVO-PASTURE MONTADO: SYSTEM CHARACTERIZATION ...43 4. EMPIRICAL IMPLEMENTATION ...55 4.1CHARACTERIZATION OF THE HOLM OAKS FARM ... 55 4.2THE EMERGY EVALUATION ... 60
4.2.1Determination of the items – raw data, emergy and transformity values... 64 4.2.2Determination of renewability factors for the farm items ... 103 4.2.3 Co-products ... 109 4.2.4 Accounting for fuels, machinery and labor in a farm ... 110
4.3THE ECONOMIC EVALUATION ... 111
4.3.1 Determination of the economic values ... 113
5. RESULTS & DISCUSSION... 123 5.1THE EMERGY EVALUATION OF THE HOLM OAKS FARM ... 123
5.1.1 The different activities of the Holm Oaks Farm ... 126 5.1.2The renewability of the purchased inputs ... 136
5.2COMPARING ECONOMIC AND EMERGY EVALUATIONS ... 138
5.2.1 The share of emergy investment and return between the owner and the manager of the Holm Oaks Farm ... 149 5.2.2 The bales ... 153 5.2.3 The renewability of purchased inputs and their prices ... 154
12
6.1THE MONTADO ... 159 6.2ECONOMIC VERSUS EMERGY EVALUATIONS ... 160 6.3KNOWLEDGE GAPS AND FUTURE RESEARCH PATHS ... 165 REFERENCES ... 167 APPENDICES ... 197 A. ESTIMATION OF THE BIOMASS AND ANNUAL GROWTH OF THE HOLM AND CORK OAKS. ... 197 B. EXTENDED ESL DIAGRAM OF THE HOLM OAKS FARM... 197 C. LEGEND TO THE EXTENDED ESL DIAGRAM OF THE HOLM OAKS FARM. ... 197 D. SIMPLIFIED MOVEMENTS STATEMENT WITH THE SUBSIDIES RECEIVED IN 2012 FOR THE FARM. ... 197
13
Preamble
The environmental problems existing nowadays are a good source of inspiration for choosing a doctoral thesis topic. Previously, I worked on a large organic farm and joined a citizen’s movement for sustainability, and both of these activities have had a decisive influence on the theme of my doctoral thesis. Therefore, the initial theme of my thesis was related to the expenditure of energy in food production in relation to fluctuations in energy prices.
Also, the fact that I live in the Montado landscape and have worked for several years on the dissemination of knowledge about this system, made it inevitable that this dissertation would focus on farming in the Montado and the production of one of its main outputs, calves. In addition, there is a growing concern among scholars that the present design of the Common Agricultural Policy and its application in Portugal to support beef production is leading to a significant and continuous increase in cattle production in the Montado, most often with negative consequences on the balance of this system.
The literature search on the topic of energy led me to the Emergy Assessment Method. A brief evaluation made me realize that this tool or lens to assess the contributions of nature to society was suited a systemic way of seeing life and thinking about nature.
The capacity for synthesis on the one hand, associated with the rigorous characterization of each system under study and the determination of the values to be used, make emergy evaluation a time-consuming method that requires the collection of a large quantity of data. However, its power to integrate and explain system structure and function is very attractive, and therefore I have selected this pathway to assess the functioning of the Montado system on the farm level, today. This choice required the study of the emergy method in itself, and I have joined the ISAER (International Society for the Advancement of Emergy Research) meetings in the US and Europe three times during my thesis, to get acquainted with the details of the method. This learning effort, together with the lack of sufficient detailed information on all components of the system, and the work necessary to produce the needed data with the required quality, just for one farm, has led to a clearer focus in the final work.
14
Thus the theme of this dissertation focuses on the study and evaluation of one farm with cattle rearing in the Montado system through the application of the Emergy Evaluation Method, and the evaluation of the results also in economic terms. Comparing emergy with economic evaluation was also fundamental to learn and urderstand major differences of perspectives, focus and results.
15
1. Introduction
The Montado, in Portugal, is a complex silvo-pastoral system of land use, typically Mediterranean, with different strata of vegetation, including cork and holm oaks in various densities, and where it is common to take advantage of natural or improved pasture and other system resources by rearing one or more livestock species. Among these, the alternatives include the raising of sheep, cows, pigs, goats, turkeys and other species less commonly used. This activity benefits from the herbaceous layer under the trees, as well as from some species in the shrub layer, and also from the acorns falling from the tree cover, while at the same time contributing to prevent the invasion of pastures by shrubs. Nevertheless, depending on its management, livestock can affect the system regeneration. Over the past 20 years, subsidies of the European Union's common agricultural policy have promoted cattle rearing at the expense of other lighter species and breeds, as well as its intensification. This intensification may impair the natural regeneration of trees, threatening the balance of the Montado. The accurate assessment of the balance between its different components becomes therefore urgent. With an economic evaluation is not easy to capture and evaluate all components of the Montado since many of them are not usually evaluated in economic terms. Examples of these components are solar energy, wind, ground water available for livestock and also those which in an economic evaluation are called externalities of economic activity, examples of which include erosion, soil compaction, and reduction in the natural regeneration of the trees. The thesis of this work is that in a system with the complexity and semi-natural character such as the Montado, both the free inputs from nature and the outputs or externalities unaccounted for are important for a more complete evaluation of a Montado able to respond to the challenges to which it is currently subjected. Thus, the emergy evaluation method was used in order to evaluate both the components usually evaluated by economics and those components normally outside these evaluations.
16
1.1 Objectives
The purpose of this study was to obtain a better understanding of the functioning of a silvo-pastoral farm in a Montado system with cattle rearing as the main agricultural activity, through the application of the emergy evaluation method, and through the calculation of emergy indices. In this way the intention is to gain a clearer idea about the relative importance of the different system components in order to allow the designing of strategies for the sustainable management of the system at the scale of an individual farm. A comparison of this method with the economic evaluation allowes us to realize in which aspects the latter can be complemented by the emergy avaluation method.
Specifically, the following research questions were considered:
- to apply the emergy evaluation method to a cattle rearing Montado farm, as a way of getting an integrating overview of the different components of this system and of their mutual influence,
- to know the relative importance of the different components of this system,
- to distinguish and account nature’s and human work in cattle rearing,
- to find a language with which human work and nature's work can be assess on equal terms and how and to whom the two are remunerated,
- to solve some technical issues related to the implementation of the emergy evaluation method to a multifunctional farm,
- to compare economic and emergy evaluations to determine their potential contributions to understanding a multifunctional farming system in the context of the western Mediterranean basin.
17
1.2 Organization
This thesis is organized into six sections, followed by references and appendices, where the first section is “1. Introduction”. In this section a brief description of the system, and the threats to which it is subject, is undertaken, and the thesis investigated in this work is presented. In this first section, in subsection “1.1 Ojectives”, are defined the objectives of this study and in subsection “1.2 Organization” is presented its organization in which it is possible to have a first overview of how this work is organized.
In the second section “2. Concepts & Methods”, a description of the concepts and methods used in this evaluation, is made. In this description, the most common methods of the evaluation of resources are identified in subsection “2.1 Available Methods for Resources Assessment”. This is followed by a subsection with a description of the method used in this evaluation “2.2 The Emergy Evaluation Method” which is divided into four sub-subsections: “2.2.1 History of the development of the concept of emergy”, which describes the evolution in the knowledge of energy and ecosystems that led to the development of the concepts underlying this methodology; “2.2.2 Defining the method” where a more detailed explanation about the way the method is used and applied is given; “2.2.3 Application to general systems” where are described some application fields of this method and the general procedures for its application; and finally the sub-subsection “2.2.4 Application to farming systems” where are described some of the applications of the emergy evaluation method in fields related to farming systems such as cereal production, wine, livestock, dairy farms and agriculture at farm, national and regional scales, among others. The specific procedures adopted in the application of this method in these cases are described generically, since these applications refer to different types of farms and study scales.
Following this second section about concepts & methods is the third section “3. The Portuguese silvo-pasture Montado: system characterization:” where this Montado system is characterized by the aspects considered more relevant for this study. Therein are described aspects of the history of this system from the origin of the Mediterranean climate, to the historical intervention
18
by man and the way the system management is conducted nowadays. Some ecological functions of this system are described as well as the threats that have been putting the system’s continuity in question.
The fourth section “4. Empirical Implementation” corresponds to the explanation of how the emergy method was applied to the farm under study. This section is subdivided into three sub-sections that are: “4.1 Characterization of the Holm Oaks Farm” where a characterization of the farm under study is made, with particular emphasis on the features that are of interest to the emergy evaluation; “4.2 The emergy evaluation” with the explanation of how the emergy evaluation method was implemented to the specific case study; and “4.3 The economic evaluation” which describes the way of collecting and the used assumptions in the deduction of the required data for the economic evaluation of farm production system. Since emergy evaluation is the main method discussed in this study it is explained in more detail and, therefore, the subsection 4.2 is still divided in four sub-subsections indicated below: “4.2.1 Determination of the items – raw data, emergy and transformity values” where all the assumptions and calculations carried out for the estimation of the energy, mass or money, related emergy and transformity, associated to each flow or reservoir identified in the farm, were explained; “4.2.2 Determination of renewability factors for the farm items” where all the assumptions and calculations carried out to estimate the renewability factors, were presented; “4.2.3 Co-products” where it was explained how a recurring aspect related with emergy transference accounting throughout the ecosystem, was solved in this particular case study; and finally “4.2.4 Accounting for fuel, machinery and labor on a farm” in which it is explained how some accounting aspects of emergy, linked with the use of machines, working hours and fuels that are used in different activities, were solved for this case study, in a way that allows us to take into account the normal complexity existing in the management of a farm.
Subsection 4.3 also includes an explanation of the determination of the economic values through the use of different resources “4.3.1 Determination of the economic values”.
The next section is section five corresponding to “5. Results & Discussion” where the results of the emergy evaluation are presented and the relevant discussion about these results is carried
19
out. This section is divided into three subsections: “5.1 The emergy evaluation of the Holm Oaks Farm”, where the emergy accounting table for the farm is presented as well as the values for the emergy indices resulting from different calculations with the emergy of the items shown in the table. In subsection “5.2 Comparing economic and emergy evaluations” an adaptation was made to allow the comparison between the two evaluation methods. The comparison was made using different methods and new indices.
In its turn subsection 5.1 is divided into two sub-subsections, which correspond to particular aspects of emergy evaluation that had to be solved for this case study: “5.1.1 The different activities of the Holm Oaks Farm” where the different activities are compared against each other and against other farming systems with regard to their contribution to the manager’s income and the impact on the system or the use of resources; and “5.1.2 The renewability of the purchased inputs” where, besides the distinction between renewable and nonrenewable inputs to the farm, renewability factors of the imputs usually considered as nonrenewable , are taken in account. Subsection 5.2 has also three sub-subsections that are “5.2.1 The share of emergy investment and return between the owner and the manager of the Holm Oaks Farm” where the specific situation of a system that has two managers, the owner and the cattle manager, to whom the farm is leased, is addressed; “5.2.2 The bales”, where the actual options for the straw and the straw bales are compared to an alternative hypothetical situation; and “5.2.3 The renewability of purchased inputs and their prices”.
The sixth section, corresponding to the conclusions (“6. Conclusions”), is divided into three subsections where are exposed, more specifically, the findings related to the Montado (“6.1 The Montado”), with the comparison of emergy and economic evaluations (“6.2 Economic versus Emergy evaluations”), and where are also indicated the gaps in current information, and the lines for future research (“6.3 Knowledge gaps and future research paths”).
Section “References” displays the references used throughout this work.
21
2. Concepts & Methods
2.1 Available Methods for Resources Assessment
Agricultural economists use budget and record accounting to evaluate agricultural systems and their returns. They do this by valuing, at market prices, the benefits of products sold and the costs of purchased factors and services.
Owned factors such as land, capital and labor can also be evaluated at their opportunity costs, namely based on estimated market value of their alternative allocation (Kramer et al., 2013; Marques, 2012; Naidoo & Iwamura, 2007; Putz, 2000). However, these are often non-tradable goods and services. Hence, agricultural economists find a residual return to these resources all together (Fisher & Kinnard, 2003).
The bio-geophysical system’s contribution to economic activities, such as solar energy, rainwater and soil are not accounted for although they constitute factors conditioning agricultural productivity. These resources are appropriated through land property rights and are inadequately or simply not evaluated, representing emternalities of the economic activity (Pillet et al., 2001). Furthermore, the global value of these resources goes beyond use value, including non-use values or its availability and preservation for the future (Dewsbury et al., 2016; Oglethorpe & Miliadou, 2000; Turner et al., 2003). Finally, market evaluation is based on the receiver’s utility preferences, whereas natural resources are available at the bio-geophysical system’s donor based value (Campbell & Tilley, 2014b).
Throughout the history of the economy several attempts to value bio-geophysical resources were carried out (Ghosh & Mondal, 2013; Kallis et al., 2013; Masiero et al., 2016; Nijkamp et al., 2008; Randall, 2007), so that they could be valued on equal terms with the resources already valued by man.
22
MAINSTREAM OR NEOCLASSICAL ECONOMICS makes use of the market value, defined by “what
people are willing to pay” as the main accounting method. The question is that market value
changes with scarcity/abundance and expected benefits. It is a receiver-type value that, frequently, is not helpful for direct evaluation of natural resources and services (Colander et al., 2009; Slembeck, 1999; Veblen, 1898), namely by responding inversely to the quantity of these resources or services provided. These attempts, whose starting point is the mainstream or neoclassical economics, integrate the group of ENVIRONMENTAL ECONOMICS.
ENVIRONMENTAL ECONOMICS considers the economic system as a subsystem of the ecosystem. This branch of economics puts its emphasis on the evaluation of Natural Capital (van den Bergh, 2001). Despite the attempt to value the resources and services of nature, these methods are focused on the usefulness of these to mankind (receiver-type value) and are valued using money. This creates difficulties in the evaluation of services and goods with no market to serve as a reference (Adolphson, 2004; Cleveland, 1991; Gowdy, 2007; Hall et al., 2001; Hall and Klitgaard, 2006). Some of the methods used in environmental economics are the TRAVEL COST METHOD, the HEDONIC PRICING, the CONTINGENT VALUATION, the VALUATION OF SUBSTITUTION SERVICES, CHOICE MODELLING and COST-BENEFIT ANALYSIS.
TRAVEL COST METHOD is used to estimate economic use values associated with ecosystems or sites that are used for recreation (Hanley, 1995). It is used to estimate the economic benefits or costs resulting from: changes in access costs for a recreational site, elimination of an existing recreational site, addition of a new recreational site, changes in environmental quality at a recreational site. The basic premise of the travel cost method is that the costs incurred by individuals in travelling to the site can be used as a surrogate for prices.
HEDONIC PRICING examines the effect that the environment has on economic decisions through its effect on housing prices or other items, e.g., cars based on their characteristics, location for houses due to the proximity of a natural park or better air quality.
23
CONTINGENT VALUATION (willingness-to-pay and willingness to accept compensation) is an accounting method where individuals express their preferences by indicating directly or indirectly their willingness to have less of something in order to have more of something else. Individuals can express their willingness to pay for a direct use of something such as a visit to a Natural Park; for an indirect use such as to watch a television program about this Natural Park; to preserve a good or service for future use opportunity (option value) such as botanical biodiversity for future medical use; to preserve a good or service for use by future generations (bequest value) such as the water regulating capacity of the soil; or to preserve something that is considered beneficial even if not used (non-use value) such as polar bears in the Arctic.
The VALUATION OF SUBSTITUTION SERVICES is another method used within the conceptual framework of environmental economics. This method is used to assess the cost that must be incurred in order to: avoid loss or damage to a good or service (Damage Cost Avoided Method); or the cost to replace it with a new one or with a different alternative good or service providing the same benefit when degraded or lost (Replacement Cost Method). All these methods assess the value of goods or services such as pollination, water and nutrient cycling, pollutant dilution, through a comparison with their protection or replacement cost.
COST-BENEFIT ANALYSIS evaluates the net worth of an investment required for the conservation or replacement of a good or service. The aim is to determine if society receives an “economic benefit” from implementing the action.
In this attempt of assess bio-geophysical resources so that they could be valued on equal terms with the resources already valued by man, several biophysical theories of value, based on a broader perspective of the economy, on thermodynamic and ecological principles, have emerged (Cleveland & Ruth, 1997; Farber et al., 2002; Gowdy & Mesner, 1998; Hall & Klitgaard, 2006; Liu et al., 2010; Patterson, 1998; Pelorosso et al., 2016; Sagoff, 2011).
24
In opposition to environmental economics, wich the lens to evaluate nature is neoclassical economics, ecological economics is included in the wider group of HETERODOX ECONOMICS, alongside with other branches such as socialist, Marxian, institutional, evolutionary, Georgist, Austrian, feminist, social or post-Keynesian economics (Lawson, 2005). In this group of heterodox economics, economists keep their focus on nature, justice and time leading up to issues such as intergenerational equity, the irreversibility of environmental change, and the uncertainty of long-term effects (Faber, 2008).
ECOLOGICAL ECONOMICS refers to an area of transdisciplinary and interdisciplinary research aimed at studying the interdependence and coevolution of human economies and natural ecosystems in space and time (Xepapadeas, 2008). Ecological economists are focused on strong sustainability and reject the idea that natural capital can be replaced with capital of human origin.
ENERGY ACCOUNTING is a methodology that can be integrated also in this broader group of heterodox economics and that is used in energy management systems, where the measurement and analysis of energy consumption is done to improve energy efficiency within an organization (Knox et al., 2000). Some companies use this method to monitor their energy consumption. In this methodology, non-useful work is often considered to be what is responsible for environmental problems.
The BIOPHYSICAL ECONOMICS also integrates this broader group of heterodox economics and is a system of economic analysis based on the biological and physical (in opposition to social) properties, structures and processes of real economic systems (Hall and Klitgaard, 2006). This approach makes clear that resources drive the economy and that for every flow of money there is a flow of energy, emergy or mass flowing in the opposite direction. It is an economics of the donor-type, based on the resources that drive the economy and makes use of measurement units of mass or energy instead of money. Biophysical economists tend to be technological sceptics giving more importance to the precautionary principle. The methods that fit this evaluation system are:
25
EMBODIED ENERGY ANALYSIS that focuses on the cumulative direct and indirect commercial energy cost of a product in heat equivalents, generally fossil fuels (IFIAS, 1974; Herendeen, 1998). The scale of application is the cascade of processes (in time and space) that lead to a product’s creation. This method considers that only fossil fuels can be subject to scarcity whereby all process inputs of material and energy, which do not require the use of fossil fuels or fossil fuels equivalents are not included. Human labor and economic services are considered negligible.
EXERGY ANALYSIS focuses on the appropriate quantification of the ability of resources to supply useful work or to support a further transformation process (Szargut et al., 1988). Its unit of measure is the “Exergy” that is the energy available to do work. This method usually focuses on the local scale of an individual process.
MATERIAL FLOW ACCOUNTING focuses on quantifying the direct and indirect, upstream material cost of a process or an economy and downstream release of degraded matter (Hinterberger & Schmidt-Bleek, 1999; Hinterberger & Stiller, 1998; Schmidt-Bleek, 1993). Its unit of measure is the kg of each material evaluated. This method only focus on what is locally invested or released producing a limited picture of the real process.
LIFE CYCLE ASSESSMENT evaluates the potential impact of a process due to resources use by upstream depletion of resource stocks and downstream damage due to emissions (ISO, 2006 a and b; SETAC, 1993). The unit of measure depends on what is evaluated and the purposes of the evaluation. It does not address economic or social effects.
The EMERGY EVALUATION METHOD focus on the quality of the environmental energies driving natural and human-dominated systems (Odum, 1996). Its unit of measure is the “Solar emjoules” that measures the Emergy, a kind of energy memory (in equivalents of solar energy) that track back the useful energy, with different qualities or power densities, that was spent to produce a good or service. Its scale of evaluation is the biosphere in order to include the processes of resource formation and the short and long scales necessary for the creation of the resource storages. Unlike the other assessment methods representing an anthropocentric (receiver-side) perspective of "value", this
26
method represents a “donor-side” (supply-side) point of view (Brown & Ulgiati, 2004b) where the value of a resource is based on what it takes (time, space, and driving forces) to generate it within the dynamics of the biosphere.
In relation to the methods presented below this is the one that has more deeply committed with an accurate description and evaluation of the systems from the perspective of biogeophysical processes. It focus on a deep understanding of the processes occurring in the systems under evaluation, particularly the transformations that energy undergoes along the trophic chain. It allows the accounting for the losses and concentration processes of the energy in the systems. In this attempt to represent what really happens in nature, it takes into strong consideration the principles of thermodynamics that govern the physical processes. The estimations about the energy available and the emergy are based on the equations that represent the physical and chemical processes. The emergy evaluation has, therefore, been proposed as a way of assessing the contribution of the free flows of the bio-geophysical system to economic products (Cavalett & Ortega, 2009; Chen et al., 2014; Cuadra & Rydberg, 2006; Fonseca et al., 2016; Ghisellini et al., 2014; Odum, 1983; Saladini et al., 2016). On the other hand, with this emergy evaluation method it is possible to value on the same basis, both the components from the markets required for the production of outputs (e.g. fuels, labor, and purchased inputs) and the components which normally are not accounted for in the economic evaluation (Pillet et al., 2001). These are the reasons under the choice of the emergy evaluation method to study calves production in the Montado system.
2.2 The Emergy Evaluation Method
2.2.1 History of the development of the concept of emergy
After the findings on thermodynamics by Nicolas Carnot (1824 in Raine et al., 2006), Rudolf Clausius (1867) and Lord Kelvin (Thomson, 1851), various branches of this theory were applied
27
to other areas of human development beyond the industrial. Natural selection was described, in 1875, by Boltzmann (1974) as the struggle among organisms for available energy.
“The general struggle for existence of animate beings is not a struggle for raw materials – these, for organisms, are air, water and soil, all abundantly available – nor for energy which exists in plenty in any body in the form of heat, but a struggle for [negative] entropy, which becomes available through the transition of energy from the hot sun to the cold earth.”
Alfred Lotka translated the principles of thermodynamics to biological sciences developing an energetic perspective of evolution (Lotka, 1922a). He extended, also, his energetic framework to human society suggesting that the dependence of humanity of nonrenewable energy sources could lead to unique and key challenges to society (Lotka, 1922b). These theories made Lotka an important forerunner to the development of biophysical economics and ecological economics, developed later by Frederick Soddy (1926), Howard Odum (1996, 2007), Nicholas Georgescu-Roegen (1971 in Georgescu-Roegen, 2012) and others.
Nicholas Georgescu-Roegen, enriched ecological economics with a new conceptual approach to production/consumption flows based on material and energy fluxes (Georgescu-Roegen, 1971).
Howard T. Odum was strongly inspired by Lotka’s theories on the energetics of evolution and developed an Energy Circuit Language or “Energese” (Odum, 1971), extending the dynamical analogies between electrical, mechanical, acoustical, magnetic and electronic systems, to include ecological systems (Olson, 1958). He developed a general systems theory, Energy Systems Theory (Odum, 1983; 1994) and an Energy Systems Language (ESL) with which he represented natural and human-dominated systems along with their interfaces. In the evaluation of human systems, Odum extended this assessment to the economic system, making use of the same unit of measurement used to assess natural systems (solar emjoules or sej). He proposed that the measure of the value of a commodity is the amount of energy required to produce it, that is, its emergy. Emergy was defined as the available energy of one kind previously used up, directly or indirectly, to make a service or product (Amaral et al., 2016; Brown & Ulgiati, 2004a; Campbell, 2016; Odum, 1996). Instead of money, emergy analysis uses solar energy as an alternative common denominator (Odum, 1996).
28
2.2.2 Defining the method
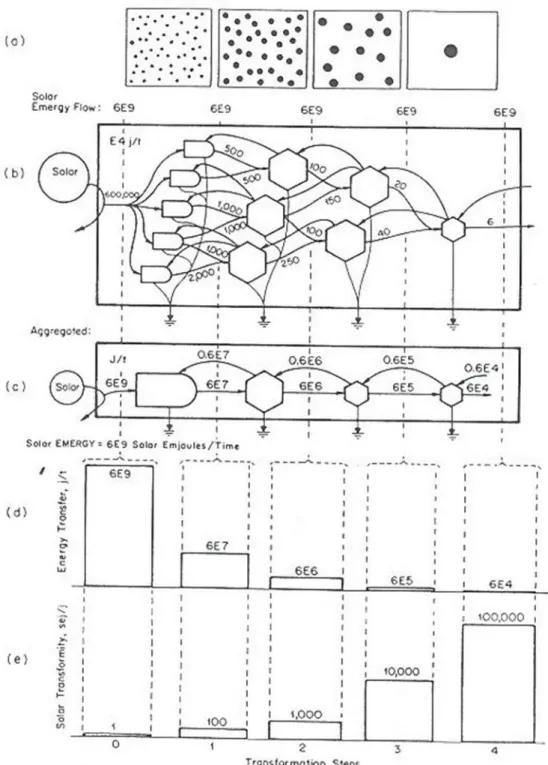
Emergy Evaluation (Odum, 1996) is a method that takes a systems approach through the study of how available energy flows through systems. It recognizes that the Earth is subjected to three main sources of available energy: solar, tidal and internal Earth energy and that these primary energy inflows combine to create a diverse array of secondary flows, e.g., the wind, rain, tides, tectonics, that the ecosystems use in different proportions. Available energy is commonly defined as the ability of a system to perform work and it is a premise of Energy Systems Theory, EST (Odum, 1983; 1994) that the available energy captured by a system determines the amount of structure that can exist within it and the speed at which processes can function (Odum, 1983; 1994). The term “emergy” is used to mean “energy memory” of one type required to make another type of energy with higher capacity to do work. Actually, the dispersed solar energy annually received by the Earth is the main energy souce considered with this purpose, whereby its unit is the solar emjoule, sej (Odum, 1996). When evaluating a system, the emergy evaluator starts by converting all the inputs, outputs, flows through the system and storages of energy, materials, money, labor or information to this common basis, expressing them all in emjoules of solar energy that is required to produce each of them, that corresponds to the solar emergy of the items (Odum, 1996). For some years it was used the term embodied energy, but the confusion with other evaluation methods lead to the creation of the emergy word (Odum, 2002). In the process of operating an entire ecosystem, much of the available energy dissipates, but the remaining available energy tends to concentrate and feeds back to promote more complex work. In each successive step of a trophic chain, or a chain of processes, the energy tends to concentrate, a characteristic which is called, in the emergy evaluation method, Transformity (Figure 1). It can be said that the transformity grows within the ecosystem creating a hierarchy of energy. In this context, Solar Transformity is the solar emergy required to make one joule of a service or product. A product’s solar transformity is its solar emergy divided by its available energy (Odum, 1996). Its units are solar emjoule per joule (sej J-1) if dealing with energy. But it is
also possible to find transformity values to materials and money, and then the designation used is specific emergy (sej/g) if dealing with materials, or emergy to money ratio
29
Figure 1 – Energy transformation hierarchy. (a) Spatial view of units and their territories. (b) Energy network including transformation and feedbacks. (c) Aggregation of energy networks into an energy chain. (d) Bar graph of the energy flows for the levels in energy hierarchy. (e) Bar graph of solar transformities. Adapted
30
(sej/$) if dealing with money. To designate these values in general the more generic Unity Emergy Value (UEV) is used representing the solar emergy required to make one joule, gram or dollar, of a specific service or product.
This chain of transformations leading to energy dissipation and transformity growth, generates a universal hierarchy of the ability to perform work which can be seem in, for instance, the solar energy, the energy contained in a pasture, a beef and a farmer’s labor. This energy hierarchy can be observerved also between solar energy, charcoal, coal, petroleum, electricity. In both cases some processes lead to the concentration of the energy and this is the reason why it is possible do a lot of different and sophisticated things with 1000 J of electricity (as make a computer work) but not with 1000 J of coal.
Since the emergy evaluation method focus on energy flows and storages, while applying it, a set of rules governing energy must always be present - the thermodynamic laws. Remembering, these rules are:
First law – The energy can neither be created nor destroyed. In any process the total energy output is equal to the heat supplied to the system minus the change in the internal energy of the system.
Second law – Energy exhibits entropy and, in the real world, some energy always escapes, leading to inefficiency.
Third law – Says that all the processes cease as temperature approaches absolute zero. This is the temperature at which molecules cease movement, cease producing kinetic energy. In other words, with absolute zero temperature there is no energy.
Odum has established another principle of thermodynamics, which was the maximum power principle (Odum, 1995) stated as - during self-organization, system designs that develop and prevail are the ones that maximize power intake, energy transformation, and those uses that reinforce production and efficiency (Figure 2). This has been proposed as the fourth principle of energetics in open system thermodynamics.
31
Figure 2 – The maximum power principle in ESL (Adapted from Odum and Odum 2000).
2.2.3 Application to general systems
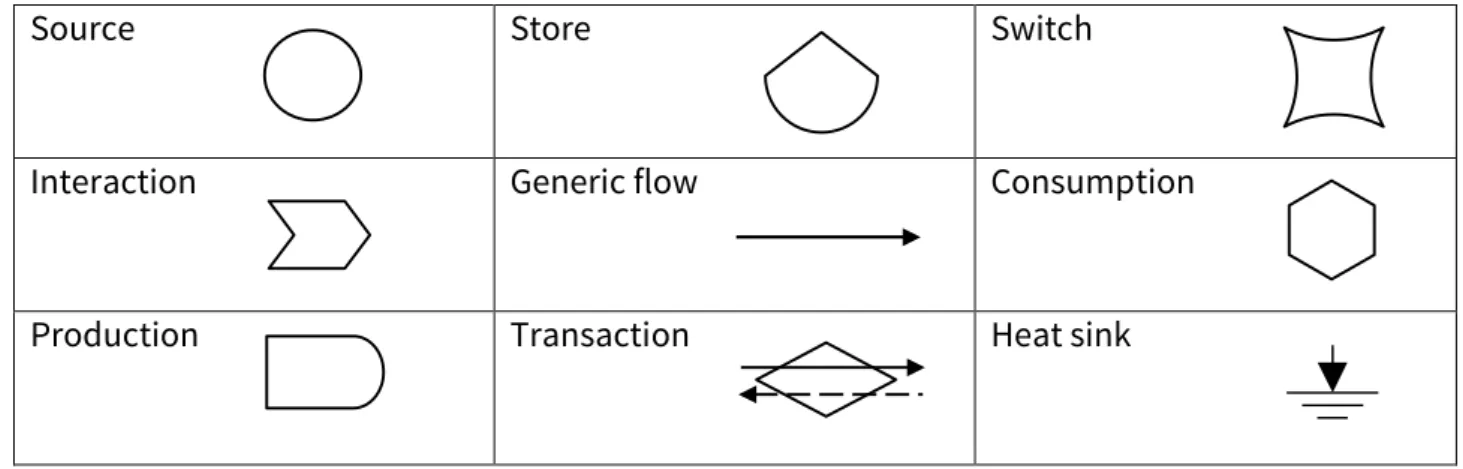
ESL (Odum, 1983; 1994) was used for the construction of all diagrams in this study (Figure 3). In this language each symbol has a particular meaning and a mathematical translation that can be used in a broader sense to characterize and simulate very different systems (Odum and Odum, 2000).
Figure 3 – Energy Systems Language (Odum 1983, 1994) used in the construction of all diagrams of this study.
Source Store Switch
Interaction Generic flow Consumption
Production Transaction Heat sink
Useful output X Energy Storage Energy Source Energy Loss
32
The emergy baseline for the Earth is used for the determination of the transformities of the products of all planetary processes. The emergy baseline of the Earth depends on the equivalences established between the independent sources of available energy (solar radiation (S), deep Earth heat (E) and the gravitational attraction of the moon and sun (G)) received by the Earth, when considered in a system of two equations and two unknowns, used to determine that value of the planetary emergy baseline (Campbell, 2000) (Figure 4).
Figure 4 – Independent sources of available energy (solar radiation, S, deep Earth heat, E, and the gravitational attraction of the moon and sun, G) received by the Earth. Adapted from Odum (2007).
The three independent sources, S, E, and G, can be used in different combinations to determine the equivalence between them through evaluating processes in which each source creates a similar product (e.g., the baseline used in this paper is found when both the solar energy and gravitational attraction of the moon and sun contribute to creating the geopotential energy of the world oceans and both solar energy driving erosion and the deep heat flow from the Earth contribute to geotectonic processes). Recently, the planetary baseline has been updated according to new considerations of past values used in the calculations and evolution in
Total global emergy flow - 1.2E+25 sej y-1 (Campbell, 2016)
S
G
33
knowledge about Earth’s geophysics and the manner in which these energy sources interact (Campbell, 2016).
However, it is possible to directly compare the values of the emergy indices obtained in studies with different baselines by multiplying the transformities by the respective conversion factors and then recalculating the results.
The emergy evaluation method has been used at several scales as the universal (Brown et al., 2004), the planetary scale (Brown & Ulgiati, 1999; Campbell, 2000; 2003; 2016; Sweeney et al., 2007), ecosystems scale (Campbell & Tilley, 2014a), at states and countries scales (Campbell et
al., 2005; Campbell & Ohrt, 2009; Ulgiati et al., 1994), at farm scale (Agostinho et al., 2004; 2008;
Cavalett & Ortega, 2009; Cuadra & Rydberg, 2006; Diemont et al., 2006; Fonseca et al., 2016; Ghisellini et al., 2014; Jaklič et al., 2014; Lefroy & Rydberg, 2003; Liu et al., 2004; Wright & Østergård, 2015) and at the scale of the life cycle of individuals (Odum, 2007, pp.228) and even the scale of chemical processes (Odum, 1983).
It also has been applied to different types of processes namely, erosion (Cohen et al., 2006), mineral cycles (De Vilbiss & Brown, 2015), formal education at country (Campbell & Lu, 2014) and school level (Fonseca et al., 2014), building materials (Buranakarn, 1998), resources (Buenfil, 2001), economies (Oliveira et al., 2013); livestock production (Rótolo et al., 2007), information production, reproduction and communication (Abel, 2012; Odum, 2007).
The energy systems language diagram at earth scale is presented in figure 4. Figure 5 presents the ESL diagram in a Pine Plantation, at ecossistem scale.
In these two ESL diagrams (Figures 4 and 5), several symbols appear repeatedly (Figure 3). The energy sources to the system at study are presented from left to right, over the box that defines the boundaries of the system, in ascending order of transformity. Thus, to the more diffuse energy sources such as “Solar radiation” and “Rain”, other more concentrated sources follows, as “Fuels”, “Phosphates” and “Machinery”, and finally these sources, such as goods, services, governance mechanisms, taxation, and the economy, providing from the more humanized systems. The ones with higher transformity correspond to a feedback or investment in the
34
system, by man, in order to maximize the power, outputs or emergy that cames from it, for their own benefit, and according to the maximum power principle aforementioned.
Figure 5 – ESL diagram for a Pine Plantation Adapted from Odum (2007).
Inside the box representing the systems boundary, the several symbols are presented also from left to right by growing transformity. The first components are the ones responsible for capturing the dispersed energy from solar radiation, usually through the process of photosynthesis. The corresponding symbols have a bullet shape, even if they do not correspond to producers, and can represent trees, grass, phytoplankton, solar collectors and windmills, among others. These system components carry out a first process of concentrating the disperse energy available. After this first processing level, the energy will exist in a more concentrated form, stored in the carbon bonds of the constituent materials of plants or in the charge of a battery. In the process, some energy was lost only to maintain the structure, in methabolic work of the plants or maintenance work of solar collectors, in addition to some losses in the form of
35
heat. These losses, presented in each step of the system and corresponding to the above mentioned second law of thermodynamics, are represented by the symbol of heat sink or used energy in the lower part of the scheme and leaving out the system. After these first components, the consumers are represented by the hexagonal symbol, and they can be primary or secondary consumers or be located higher up in the food chain. What these consumers do is to use the stored energy in the materials consumed from the previous trophic levels and use it for maintenance of its own metabolism and structure. Again this will cause the loss of some of this energy as heat, but the end result will correspond to materials with more concentrated energy or with a higher ability to work. Miscellaneous boxes correspond to processes that are not described and usualy are important subsystems. The symbol representing a tank appears frequently and may correspond to groundwater, the content in soil organic matter, bales, charge in batteries, carrots in a grocery. The interaction symbol represents the conjugation between two forces to generate a productive output as the use of a pump to extract water, or the weight of the cattle over the soil causing its compaction.
If the economic system is also under analysis, the exchanges will be represented by a diamond-shaped symbol with an arrow representing the product that is being exchanged. If it is exchanged by another product or service a countercurrent arrow, below the first one, will represent the product or service. If it is a money exchange, it will be represented by a dashed pathway (Figure 6).
36
To each symbol presented before corresponds a value or a function that explains how much emergy is available to the system at study and which kind of processes occur on it.
The emergy accounting method is implemented in a three-phase process: designing and evaluating a diagram that represents the reality under study, using the ESL descrived above, computing emergy into a table and determining and analyzing indices (Campbell & Ohrt, 2009; Odum, 1996).
In the first step, the boundaries are defined as the inputs and outputs to the system. Included in these inputs are the renewable and nonrenewable resources available in the farm contributing for the productive process under analysis, and the resources provided by the economic system (purchased inputs), generally regarded as nonrenewable, and finally the services. With the diagram it can be easily depicted which flows are and which are not accounted for in the economic evaluation. This diagram can be summarized in an aggregate ESL diagram, as in the one presented in Figure 7, for a clearer evaluation of the kind of inputs and flows existing on it. Between them it is possible to identify purchased resources and services (F) that come from outside the system and can be valued by a pricing scheme and through emergy estimation. Renewable and non-renweable resourses are also identified and distinguished. If they come from the local environment they are free resources to which is difficult to give a price but that are evaluated through emergy estimation.
Emergy evaluation is done in an aggregate emergy table format, as the one presented in Figure 8, which can be used in the calculation of indices. Rows are organized according to broad categories of local renewable inputs (R) and local nonrenewable inputs (N) and purchased goods and services (F). In the columns are exhibited the raw units of each item and its transformity, the item’s emergy, and sometimes, the emdollar value. Emergy and transformity values with and without services are presented, because the calculation of services is more variable, sometimes from country to country. Often the emergy of each item is presented without services and so these values can be used in different contexts. A column with the “references” used as the source for transformity values is also presented, in order to allow its verification, update the baseline, or use another value, if necessary.
37
Figure 7 - Aggregate Energy Systems Language diagram describes a process based on renewable inputs received in the system (R), local nonrenewable inputs (N) and inputs purchased from outside (F) that include goods (M) and services and labor (S). Symbols: energy source (circle), environmental production system (bullet-shape), storage (tank), lines with arrowheads (pathways carrying energy, material, or information), rectangle (general purpose symbol, in this case economic use) and heat sink (arrow to ground). Source: (Brown & Ulgiati, 1997; Odum, 1996, p. 83).
Items
Raw data Units UEV (sej unit-1)
Emergy %
UEV (sej unit-1) Emergy Reference for UEV
(Unit y-1) (sej y-1) (sej y-1)
Renewable inputs (R) (with services included) (without services)
1 Solar radiation 2
Sum all renewable inputs
Nonrenewable inputs from within the system (N) 11
Sum free inputs (I=R+N)
Purchased Inputs (F)
Total purchased materials from economy (M) Labor and services (S)
Feed back from Economy (F=M+S)
Y = R+N+M+S
Output (Y)
Total of outputs
38
Indices or ratios between different components provide relevant indicators in terms of the contributions of different types of inputs and about the sustainability of the system. Formulas use aggregated components from the emergy accounting table. Table 1 summarizes the main emergy indices and corresponding formulas used in emergy evaluation.
Table 1 - Main emergy indices and formulas used in emergy evaluation. (R) renewable inputs received by the systems, (Y) total of the inputs used, (F) purchased goods (M) and services (S) used in the system and that include labor, (N) local nonrenewable inputs; (I) free inputs to the system corresponding to the sum of the renewable inputs plus the local nonrenewable inputs received by the system (I=R+N).
Emergy Indices Formulas
Transformity (Tr)
The ratio between the emergy of the output divided by the available energy of the products. It is an indicator of the efficiency of the production process for an item and of the quality of the products (Lu et al. 2006)
Y/E
Renewability (%R)
Indicates the percent of the total energy driving a process or system that is derived from renewable sources (Diemont et al., 2006). It represents a first measure of system sustainability. The lower the fraction of renewables used, the higher the pressure on the environment. In the long run, only processes with high values of this index are sustainable.
R/Y
Emergy Yield Ratio (EYR)
Is a measure of the net contribution of a process to the economy
beyond what is required for its own operation (Odum, 1996). Y/F
Emergy Investment Ratio (EIR)
Is the ratio of emergy fed back from outside the system to the indigenous emergy input (both renewable and nonrenewable) or the ratio of purchased to free emergy (Brown & Ulgiati, 1997). It gives an evaluation of whether the process is a competitive user of the emergy that is invested in comparison with alternatives (Brown & Ulgiati, 2004a), being often used as an indicator of the competitiveness of an economic investment in the process area or region.
F/(R+N)
Environmental Loading Ratio (ELR)
Is the ratio of nonrenewable and imported emergy to the renewable emergy used. It can be considered as a measure of potential ecosystem stress due to production activity (Brown & Ulgiati, 1997).
(F+N)/R Emergy
Sustainability Index (ESI)
Is the ratio of the emergy yield ratio to the environmental loading ratio. It measures the potential beneficial contribution of a process to the economy per unit of environmental loading generated by the process (Ulgiati & Brown, 1998).
39
At the end of the evaluation it is possible to have an idea of how the system used the available emergy, with greater or lesser efficiency, the degree of dependence on renewable and nonrenewable emergy, if the human investment in a particular natural system is rewarding compared to other types of investment, among other considerations.
2.2.4 Application to farming systems
The recognition of the importance of the energy on farming production processes resulted directly from the “energy crisis” of the early 1970s. The OPEC oil embargo of 1973 resulted in a large number of studies on the use of energy in food production and criticism about the inefficiency of its use (Fritsch et al., 1975; Hirst, 1974; Pierotti et al., 1977; Pimentel et al., 1979; Rawitscher & Mayer, 1979; Steinhart & Steinhart, 1974; Van Arsdall & Devlin, 1978). In the decades following the end of the Second World War, the agricultural system, overall, in developed countries had been completely redesigned through numerous inputs of synthetic pesticides, inorganic fertilizers, extra irrigation, and heavy, powerful and sophisticated machinery, under the Green Revolution, with large productivity gains. However, all these new technologies were highly dependent on the availability of cheap fossil fuels. Both at the farm, but also at the distribution and consumption levels, the food chain had become increasingly dependent on cheap fossil fuels with food items coming from increasingly long distances, with the corresponding cooling chain that allows food to support long distances and long periods of time until they are distributed to end consumers, but which is also highly dependent on high energy costs. The growing use of the airplane for food transportation and the availability of all kinds of food items out of their production season are practices that also lead to high energy consumption since aircraft use much more energy than transport by land or sea and because the production of fruits and vegetables out of season, is made possible by means of heat that requires energy or transportation from distant areas of the globe (Paxton, 1994).
Fossil fuels, including oil, coal and natural gas, are almost nonrenewable energy resources with a big impact on the biosphere and whose reserves are gradually reducing worldwide.