EUROPEAN ORGANIZATION FOR NUCLEAR RESEARCH (CERN)
CERN-EP/2016-296 2017/04/13
CMS-B2G-16-004
Search for massive resonances decaying into WW, WZ or
ZZ bosons in proton-proton collisions at
√
s
=
13 TeV
The CMS Collaboration
∗Abstract
A search is presented for new massive resonances decaying to WW, WZ or ZZ bosons in `νqq and qqqq final states. Results are based on data corresponding to an
inte-grated luminosity of 2.3–2.7 fb−1recorded in proton-proton collisions at√s=13 TeV with the CMS detector at the LHC. Decays of spin-1 and spin-2 resonances into two vector bosons are sought in the mass range 0.6–4.0 TeV. No significant excess over the standard model background is observed. Combining the results of the`νqq and
qqqq final states, cross section and mass exclusion limits are set for models that pre-dict heavy spin-1 and spin-2 resonances. This is the first search for a narrow-width spin-2 resonance at√s=13 TeV.
Published in the Journal of High Energy Physics as doi:10.1007/JHEP03(2017)162.
c
2017 CERN for the benefit of the CMS Collaboration. CC-BY-3.0 license
∗See Appendix B for the list of collaboration members
1
1
Introduction
Several theories beyond the standard model (SM) predict the existence of heavy particles that preferentially decay to pairs of vector bosons V, where V represents a W or Z. These models usually aim to clarify open questions in the SM such as the apparently large difference be-tween the electroweak and the gravitational scales. Notable examples of such models include the bulk scenario [1–3] of the Randall–Sundrum warped extra-dimensions (RS1) [4, 5] and a heavy vector-triplet (HVT) model [6]. The bulk graviton model is described by two free pa-rameters: the mass of the first Kaluza-Klein (KK) excitation of a spin-2 boson (the KK bulk graviton Gbulk) and the ratio ˜k ≡ k/MPl, where k is the unknown curvature scale of the extra dimension and MPl ≡ MPl/
√
8π is the reduced Planck mass. The HVT generalises a large number of models that predict spin-1 charged (W0) and neutral (Z0) resonances. Such mod-els can be described in terms of just a few parameters: two coefficients cFand cH, scaling the
couplings to fermions, and to the Higgs and longitudinally polarized SM vector bosons respec-tively, and the strength gV of the new vector boson interaction. Two benchmark models are
considered in the HVT scenario. In the first one, referred to as HVT model A, with gV = 1,
weakly coupled vector resonances arise from extensions of the SM gauge group, such as the sequential standard model (SSM) [7], that have comparable branching fractions to fermions and gauge bosons. In HVT Model B with gV = 3, the new resonances have large branching
fractions to pairs of bosons, while their fermionic couplings are suppressed. This scenario is most representative of composite models of Higgs bosons.
Searches for diboson resonances have been previously performed in many different final states, placing lower limits on the masses of these resonances above the TeV scale [8–19]. Searches performed with proton-proton collisions at√s =8 TeV indicated deviations from background expectations at resonance masses of about 2 TeV. The largest excesses of events were observed in the searches in the dijet WW, WZ or ZZ [12, 16] channels, as well as in the semi-leptonic WH
→ `νbb final state [13], and have local significances of 3.4σ and 2.2σ, respectively. The most
stringent lower mass limit for a W0 (Z0) is set at 2.3 (2.0) TeV by a combination of searches in semi-leptonic and all-hadronic final states performed with proton-proton collisions at √s =
13 TeV [9]. The same searches provide the current lower mass limit of 2.6 TeV for a HVT. This paper presents a search for resonances with masses above 0.6 TeV decaying into a pair of vector bosons. The analysis is based on data collected in proton-proton collisions at√s =
13 TeV with the CMS experiment at the CERN LHC during 2015, corresponding to an integrated luminosity of 2.3 and 2.7 fb−1for the`νqq, where` =µor e, and qqqq final state, respectively.
The`ν+jet search also includes the W→τνcontribution from the decay τ → `νν. The gain in
sensitivity from τ leptons is limited by the small branching fractions involved.
The key challenge of the analyses is the reconstruction of the highly energetic decay prod-ucts. Since the resonances under study have masses of order 1 TeV, their decay products, i.e. the bosons, have on average transverse momenta (pT) of several hundred GeV or more. As
a consequence, the particles emerging from the boson decays are very collimated. In particu-lar, the jet-decay products of the bosons cannot be resolved using the standard algorithms, but are instead reconstructed as a single jet object. Dedicated techniques, called jet “V tagging” techniques, are applied to exploit the substructure of such objects, to help resolve jet decays of massive bosons [20, 21]. The V tagging also helps suppress SM backgrounds, which mainly originate from the production of multijet, W+jets, and nonresonant VV events.
The final states considered are either`νqq or qqqq, where the hadronic decay products of the
V decay are reconstructed in a single jet. They result in events with either a charged lepton, a neutrino, and a single reconstructed jet (`ν+jet channel), or two reconstructed jets (dijet
chan-2 3 Simulated samples
nel). As in the analyses of previous data [11, 12], the aim is to reconstruct all decay products of the new resonance to be able to search for a localized enhancement in the diboson invariant mass spectrum. While the analyses in general aim at large resonance masses, we conduct two exclusive searches in the`ν+jet final state, separately optimized for the mass ranges 0.6–1.0 TeV
(“low-mass”) and>1 TeV (“high-mass”).
This paper is organized as follows. Section 2 briefly describes the CMS detector. Section 3 gives an overview of the simulations used in this analysis. Section 4 provides a detailed description of the reconstruction and event selection. Section 5 describes the background estimation and the signal modelling procedures. Systematic uncertainties are discussed in Section 6. The re-sults of the search for a spin-2 bulk graviton and for spin-1 resonances as predicted by HVT models are presented in Section 7, and Section 8 provides a brief summary.
2
The CMS detector
The central feature of the CMS apparatus is a superconducting solenoid of 6 m internal di-ameter, providing a magnetic field of 3.8 T. Contained within the solenoid volume are a sili-con pixel and strip tracker, a lead tungstate crystal electromagnetic calorimeter (ECAL), and a brass and scintillator hadron calorimeter (HCAL), each composed of a barrel and two endcap sections. Extensive forward calorimetry complements the coverage provided by the barrel and endcap detectors. The forward hadron (HF) calorimeter uses steel as an absorber and quartz fibers as the sensitive material. The two halves of the HF are located 11.2 m from the interac-tion region, one on each end, and together they provide coverage in the pseudorapidity range 3.0 < |η| < 5.2. Muons are measured in gas-ionization detectors embedded in the steel
flux-return yoke outside the solenoid.
A particle-flow (PF) event algorithm [22, 23] reconstructs and identifies each individual particle with an optimized combination of information from the various elements of the CMS detector. The energy of photons is obtained from the ECAL measurement, corrected for suppression of small readout signals. The energy of electrons is determined from a combination of the elec-tron momentum at the primary interaction vertex as determined by the tracker, the energy of the corresponding ECAL cluster, and the energy sum of all bremsstrahlung photons spatially compatible with originating from the electron track. The momentum of muons is obtained from the curvature of the corresponding track. The energy of charged hadrons is determined from a combination of their momentum measured in the tracker and the matching of energies deposited in ECAL and HCAL, also corrected for suppression of small signals and for the re-sponse function of the calorimeters to hadronic showers. Finally, the energy of neutral hadrons is obtained from the corresponding corrected ECAL and HCAL energy.
A more detailed description of the CMS detector, together with a definition of the coordinate system and the kinematic variables, can be found in Ref. [24].
3
Simulated samples
The bulk graviton model and HVT models are used as benchmark signal processes. In these models, the vector gauge bosons are produced with a longitudinal polarization in more than 99% of the cases. For each resonance hypothesis, we consider masses in the range 0.6 to 4.0 TeV. Simulated signal events are generated at leading order (LO) accuracy with MAD-GRAPH5 [email protected] [25] with a width of 0.1% of the resonance mass.
anal-3
yses. The W+jets SM process is simulated with MADGRAPH5 aMC@NLO, while tt and single top quark events are generated with both POWHEG v2 [26–31] and MADGRAPH5 aMC@NLO. Diboson (WW, WZ, and ZZ) processes are generated withPYTHIAv8.205 [32, 33]. Parton show-ering and hadronization are implemented throughPYTHIAusing the CUETP8M1 tune [34, 35]. The NNPDF 3.0 [36] parton distribution functions (PDFs) are used for all simulated samples, except for diboson ones (WW, WZ and ZZ) for which NNPDF 2.3LO is used. All events are processed through a GEANT4-based [37] simulation of the CMS detector. The simulated back-ground is normalized using inclusive cross sections calculated at next-to-leading order (NLO), or next-to-NLO order in quantum chromodynamics (QCD) where available, usingMCFMv6.6 [38–41] andFEWZv3.1 [42].
Additional simulated minimum-bias interactions are added to the generated events to match the additional particle production observed in the large number of overlapping proton-proton interactions within the same or nearby bunch crossings (pileup). The simulated events are cor-rected for differences between data and simulation in the efficiencies of the lepton trigger [43], lepton identification and isolation [43], and selection of jets originating from hadronization of b quarks (b jets) [44].
4
Reconstruction and selection of events
4.1 Trigger and preliminary offline selection
In the `ν+jet channel, events are collected with a trigger requiring either one muon or one
electron. For the low-mass`ν+jet analysis, both triggers have a pTrequirement of 27 GeV. The
muons and electrons selected online also satisfy both isolation requirements and identification criteria. The selection efficiency of these triggers for leptons satisfying the offline requirements described in Section 4.3, varies in the range 90–95% for the single-muon trigger, depending on the η of the muon, and it is >94% for the single-electron trigger. In the high-mass `ν+jet
analysis, muons selected online must have pT > 45 GeV and |η| < 2.1, while the minimum
pT threshold for electrons is 105 GeV. There are no requirements on the isolation and loose
identification criteria are used, since these introduce inefficiencies at high resonance masses. The selection efficiencies with respect to the offline requirements of the single-muon trigger vary between 90% and 95%. The efficiency is above 98% for the single-electron trigger.
In the dijet channel, events are selected online using a variety of different hadronic triggers based on the scalar pT sum of all jets in the event (HT) or the presence of at least one jet with
loose substructure requirements; the details of jet substructure are described in Section 4.4. Events must satisfy at least one of the following four requirements. The first requirement is simply HT >800 GeV. The second requirement is HT >650 GeV and a difference in η between
the two leading jets in the event satisfying the condition∆η<1.5. The accepted jets are further required to have a dijet invariant mass > 900 GeV. The third criterion is that at least one jet with pT > 360 GeV and a trimmed mass (as defined in Section 4.4) mjet >30 GeV is present in
the event. Fourthly, events with HT > 700 GeV and at least one jet with mjet > 50 GeV are also
selected for analysis.
The pp data collected by CMS with the detector in its fully operational state correspond to 2.3 fb−1 of integrated luminosity [45]. Additional data equivalent of 0.37 fb−1 of integrated luminosity were collected with the HF running in suboptimal conditions; those data are used only for the dijet channel, since jets reconstructed online and used for the calculation of HTare
in the range of|η| <3.0. The trigger efficiency is found to be unaffected by the condition of the
4 4 Reconstruction and selection of events
Offline, all events are required to have at least one primary interaction vertex reconstructed within a 24 cm window along the beam axis, with a transverse distance from the mean pp interaction point of less than 2 cm [46]. In the presence of more than one vertex passing these requirements, the primary interaction vertex is chosen to be the one with the highest total p2
T,
summed over all the associated tracks.
4.2 Jet reconstruction
Jets are clustered from the four-momenta of the particles reconstructed using the CMS PF al-gorithm, from the FASTJETsoftware package [47]. In the jet clustering procedure charged PF candidates not associated with the primary interaction vertex are excluded. Jets used for iden-tifying the W and Z boson decays to qq are clustered using the anti-kT algorithm [48] with
distance parameter R= 0.8 (“AK8 jets”). To identify b jets, the anti-kTjet clustering algorithm
is used with R = 0.4 (“AK4 jets”), along with the inclusive combined secondary vertex b tag-ging algorithm [44, 49]. The chosen algorithm working point provides a misidentification rate of≈1% and efficiency of≈70%. A correction based on the area of the jet projected on the front face of the calorimeter is used to take into account the extra energy clustered in jets due to neutral particles coming from pileup. Jet energy corrections are obtained from simulation and from dijet and photon+jet events in data, as discussed in Ref. [50]. Additional quality criteria are applied to the jets to remove spurious jet-like features originating from isolated noise pat-terns in the calorimeters or the tracker. The efficiency of these requirements for signal events is above 99%. In the`ν+jet channel, the AK8 and AK4 jets are required to be separated from
any well-identified muon or electron by∆R = √(∆φ)2+ (∆η)2 > 0.8 and>0.3, respectively.
All AK4 and AK8 jets must have pT >30 GeV and>200 GeV, respectively, and|η| <2.4 to be
considered in the subsequent steps of the analysis.
4.3 Final reconstruction and selection of leptons and missing transverse
mo-mentum
Muons are reconstructed through a fit to hits in both the inner tracking system and the muon spectrometer [51]. Muons must satisfy identification requirements on the impact parameters of the track, the number of hits reconstructed in both the silicon tracker and the muon detectors, and the uncertainty in the pT. These quality criteria ensure a precise measurement of the
four-momentum and rejection of misreconstructed muons. An isolation requirement is applied to suppress background from multijet events where jet constituents are identified as muons. A cone of radius∆R=0.3 is constructed around the muon direction, and the isolation parameter is defined as the scalar sum of the pTof all the additional reconstructed tracks within the cone,
divided by the muon pT. The efficiency of this muon selection has been measured through a
“tag-and-probe” method using Z bosons [43], and it has a negligible dependence on the pileup. In the high-mass`ν+jet analysis, events must have exactly one isolated muon with pT>53 GeV
and|η| <2.1. A looser pTrequirement of 40 GeV is used for the low resonance mass range.
Electron candidates are required to have a match between energy deposited in the ECAL and momentum determined from the reconstructed track [52]. To suppress multijet background, electron candidates must pass stringent identification and isolation criteria [53]. Those crite-ria include requirements on the geometrical matching between ECAL depositions and position of reconstructed tracks, the ratio of the energies deposited in the HCAL and ECAL, the dis-tribution of the ECAL depositions, the impact parameters of the track, and the number of re-constructed hits in the silicon tracker. In the high-mass`ν+jet analysis, we require exactly one
electron with pT >120 GeV and|η| <2.5. A looser pTrequirement of 45 GeV is used for the low
4.4 The identification ofW/Z→qq using jet substructure 5
region between the ECAL barrel and endcaps (1.44 < |η| < 1.57), because the reconstruction
of an electron object in this region is not optimal. The missing transverse momentum pmiss
T is defined as the magnitude of the vector sum of the
transverse momenta of the reconstructed PF objects. The value of pmissT is modified to account for corrections to the energy scale of all the reconstructed AK4 jets in the event. More details on the pmissT performance in CMS can be found in Refs. [54, 55]. Requirements of pmissT >40 and
> 80 GeV are applied, respectively, in the muon and electron channels in the `ν+jet analysis.
The threshold is higher in the electron channel to further suppress the larger background from multijet processes. Since the pmissT calculation requires the detector to provide complete geo-metric coverage, events in data without fully operational HF calorimeter are not considered for the`ν+jet channel.
4.4 The identification of W/Z
→
qq using jet substructureThe AK8 jets are used to reconstruct the W jet and Z jet candidates from their decays to highly boosted quark jets. To discriminate against multijet backgrounds, we exploit both the recon-structed jet mass, which is required to be close to the W or Z boson mass, and the two-prong jet substructure produced by the particle cascades of two high-pT quarks that merge into one
jet [21]. Jets that are identified as arising from the merged decay products of a V boson are hereafter referred to as “V jets”.
As a first step in exploring potential substructure, the jet constituents are subjected to a jet grooming algorithm that improves the resolution in the jet mass and reduces the effect of pileup [56]. The goal of the algorithm is to recluster the jet constituents, while applying ad-ditional requirements that eliminate soft, large-angle QCD radiation that increases the jet mass relative to the initial V boson mass. Different jet grooming algorithms have been explored at CMS, and their performance on jets in multijet processes has been studied in detail [56]. In this analysis, we use the jet pruning [57, 58] algorithm for the main analysis and the jet trimming algorithm [59] at the trigger level as well as for cross checks. Jet pruning reclusters each AK8 jet starting from all its original constituents, through the implementation of the Cambridge-Aachen (CA) algorithm [60, 61] to discard “soft” recombinations in each step of the iterative CA procedure. The pruned jet mass, mjet, is computed from the sum of the four-momenta of
the constituents that are not removed by the pruning; it is then scaled by the same factor as that used to correct the original jet pT. The jet is considered as a V jet candidate if mjet falls
in the range 65 < mjet < 105 GeV, which we define as the signal jet mass window. In the
low-mass analysis, only W jet candidates are considered, thus the mass window applied is 65<mjet <95 GeV.
Additional discrimination against jets from gluon and single-quark hadronization is obtained from the quantity called N-subjettiness [62]. The constituents of the jet before the pruning pro-cedure are reclustered using the kT algorithm [60, 63], until N joint objects (subjets) remain in
the iterative combination procedure of the algorithm. The N-subjettiness, τN, is then defined
as
τN =
1 d0
∑
kpT,kmin(∆R1,k,∆R2,k, . . . ,∆RN,k), (1)
where the index k runs over the PF constituents of the jet, and the distances∆Rn,kare calculated
relative to the axis of the n-th subjet. The normalization factor d0is calculated as d0= ∑kpT,kR0,
setting R0 to the distance parameter used in the clustering of the original jet. The variable
τN quantifies the compatibility of the jet clustering with the hypothesis that exactly N
6 4 Reconstruction and selection of events
2-subjettiness and 1-subjettiness, τ21 = τ2/τ1, is found to be a powerful discriminant between
jets originating from hadronic V decays and from gluon and single-quark hadronization. Jets from W or Z decays in signal events are characterized by lower values of τ21 relative to SM
backgrounds. We reject V jet candidates with τ21>0.75. The remaining events are further
cate-gorized according to their value of τ21to enhance the sensitivity of the analysis, as summarized
in Table 1.
Since data/simulation discrepancies in the jet substructure variables mjet and τ21 can bias the
signal efficiency estimated from simulated samples, the modelling of signal efficiency is cross-checked in a signal-free sample with jets having characteristics that are similar to those ex-pected for a genuine signal. A sample of high-pT W bosons that decay to quarks, and are
reconstructed as single AK8 jets, is studied in tt and single top quark events. Scale factors for the τ21selection efficiency are extracted following Ref. [21]. In this method, the pruned jet mass
distributions of events that pass and fail the τ21selection are fitted simultaneously to separate
the W boson signal from the combinatorial components in the top quark enriched sample in both data and simulation. The scale factors are listed in Table 1 and are used to correct the total signal efficiency and the VV background normalization predicted by the simulation. The un-certainties in the scale factors quoted for the τ21selection include two systematic uncertainties.
One comes from the modelling of the nearby jets and pT spectrum in tt MC events, obtained
by comparing LO and NLO tt simulation. The other is due to the choice of the models used to fit signal and background. The quadratic sum of these systematic uncertainties is found to be smaller than half of the statistical uncertainty in the scale factor. An additional uncer-tainty is calculated to account for the extrapolation of the scale factor from tt events with an average jet pT ≈ 200 GeV to higher momenta. This is estimated from the difference between
PYTHIA andHERWIG++ [64] showering models with resulting factors of 4.5% ln(pT/200 GeV)
and 5.9% ln(pT/200 GeV)for τ21 < 0.6 and τ21 < 0.45, respectively. For the 0.45 < τ21 < 0.75
selection, this uncertainty is increased by the ratio of the uncertainties in the scale factors shown in Table 1 (0.32/0.06), and treated as anti-correlated with the uncertainty for τ21 < 0.45. The
meanhmjetiand resolution σ value of the Gaussian component of the fitted W jet mass are also
extracted to obtain corrections that are applied to the simulated pruned jet mass. The values are listed in Table 2, where the quoted uncertainties are statistical. The mass peak position is slightly shifted relative to the W boson mass because of the extra energy deposited in the jet cone from pileup, underlying event, and initial-state radiation not completely removed in the jet pruning procedure. For events with top quarks, additional energy contributions arise also from the possible presence of a b jet close to the W jet candidate. Because the kinematic prop-erties of W jets and Z jets are very similar, the same corrections are also used when the V jet is assumed to arise from a Z boson.
Table 1: Data-to-simulation scale factors for the efficiency of the τ21selection used in the
anal-yses, as extracted from top quark enriched data and from simulation.
τ21selection Efficiency scale factor
τ21<0.45 0.95±0.06
0.45<τ21<0.75 1.25±0.32
τ21<0.6 1.01±0.03
4.5 The reconstruction and identification of W
→ `
νIn the`ν+jet channel, identified muons and electrons are associated with W→ `νcandidates.
The pTof the undetected neutrino is assumed to be equal to the pmissT . The longitudinal
4.6 Final event selection and categorization 7
Table 2: The W jet mass peak position and resolution, as extracted from top quark enriched data and from simulation. These results are used to apply corrections in the V tagging procedure.
τ21<0.45 hmjeti(GeV) σ(GeV)
Data 84.6±0.7 8.2±0.7
Simulation 85.1±0.2 7.8±0.3
mass to the known W boson mass [65]. In the case of two real solutions, we choose the one with smaller pz; in the case of two complex solutions, we use their real part. The four-momentum of
the neutrino is used to reconstruct the four-momentum of the W→ `νcandidate.
4.6 Final event selection and categorization
After reconstructing the two vector bosons, we apply the final criteria in the search. For all channels, any V boson candidate is required to have pT > 200 GeV. In addition, there are
specific selection criteria chosen for the `ν+jet and dijet analyses. For the`ν+jet channel, we
reject events with more than one well-identified muon or electron. We also require that the two V bosons from the decay of a massive resonance are approximately back-to-back: the∆R between the lepton and the V jet is greater than 1.6; the∆φ between the vector~pTmissand the W jet, as well as between the W → `ν and V jet candidates, are both greater than 2 radians. To
further reduce the level of the tt background in the`ν+jet channel, events are rejected if they
contain one or more b-tagged AK4 jets. This veto preserves about 90% of the signal events. For the dijet analysis, we require the two AK8 jets to have|∆ηjj| <1.3, while the dijet system invariant mass mjjmust be above 1 TeV.
To enhance the analysis sensitivity, events are categorized according to the characteristics of the V jet. For the dijet and high-mass`ν+jet channels, the V jet is deemed a W or Z boson candidate
if its pruned mass falls in the range 65–85 or 85–105 GeV. This leads to three categories for the dijet channel (WW, WZ, and ZZ), and two categories for the`ν+jet channel (WW and WZ). For
the low-mass`ν+jet channel, only W jets are considered in the signal region 65<mjet <95 GeV.
In addition, in the low- and high-mass`ν+jet channels, V jets are selected to have τ21 ≤0.45 and
≤0.6, respectively. A tighter selection is required for the low-mass analysis as more background is expected in that mass range. In the dijet channel, we select “high-purity” (HP) and “low-purity” (LP) V jets by requiring τ21 ≤ 0.45 and 0.45 < τ21 < 0.75, respectively. Events are
always required to have one HP V jet, and are divided into HP or LP events, depending on whether the other V jet is of high or low purity. Although the HP category dominates the total sensitivity of the analysis, the LP category is retained since for heavy resonances it can improve the signal efficiency with only moderate background contamination. The final categorization is therefore based on two and four classes of events for the low- and high-mass`ν+jet channels,
respectively, depending on their lepton flavor (muon or electron), and V jet mass category (W or Z). For the dijet analysis, categorization in V jet purity and mass category (WW, WZ, and ZZ) yields a total of 6 orthogonal classes of events.
The two boson candidates are combined into a diboson candidate, with presence of signal then inferred from the observation of localized excesses in the mVVdistribution. When several
diboson resonance candidates are present in the same event, only the one with the highest pT
V jet (`ν+jet analyses) or the two highest mass V jets (dijet analysis) are retained.
A summary of the final event selections and categories is presented in Table 3 for the `ν+jet
8 5 Modeling of background and signal
Table 3: Summary of the final selections and categories for the `ν+jet channel. The values
indicated in parentheses correspond to the low-mass analysis.
Selection Value Lepton selections Electron pT>120(45)GeV |η| <2.5 (except 1.44< |η| <1.57) Muon pT>53(40)GeV |η| <2.1
Number of electrons exactly 1
Number of muons exactly 1
AK4 jet selections
Jet pT pT >30 GeV
Jet η |η| <2.4
Number of b-tagged AK4 jets 0
pmissT selections
pmissT (electron channel) pmissT >80 GeV
pmissT (muon channel) pmissT >40 GeV
Boson selections
W→ `ν pT >200 GeV
V→qq (AK8 jet) pT >200 GeV
|η| <2.4
Back-to-back topology ∆R(`, Vqq) >1.6
∆φ(Vqq, pmissT ) >2
∆φ(Vqq, W`ν) >2
Pruned jet mass 65<mjet <105(95)GeV
2- to 1-subjettiness ratio τ21<0.60(0.45)
mjet categories (only for high-mass analysis)
WW 65 <mjet <85 GeV
WZ 85< mjet <105 GeV
5
Modeling of background and signal
The mVVdistribution observed in data is dominated by SM background processes where single
quark or gluon jets are falsely identified as V jets. Depending on the final state, the dominant processes are multijets (dijet channel) and inclusive W boson production (`ν+jet channel).
Sub-dominant backgrounds include tt, single top quark, and nonresonant diboson SM production.
5.1 Multijet background
In the`ν+jet channel, the multijet background is predicted to be negligible from MC simulation,
whereas it represents the major contribution in the dijet analysis. For the latter, we assume that the SM background can be described by a smooth, parametrizable, monotonically decreasing distribution. The search is performed by separately fitting the background function to each search region and simultaneously adding resonant Breit–Wigner (BW) forms across all search
5.2 Top quark production 9
Table 4: Summary of the final selections and categories for the dijet analyses.
Selection Value
Boson selections
V→qq (2 AK8 jets) pT >200 GeV
|η| <2.4
Pruned jet mass 65<mjet1, mjet2<105 GeV
Topology |∆ηjj| <1.3
Dijet invariant mass mjj>1 TeV
2- to 1-subjettiness ratio τ21<0.75
mjetcategories
WW 65<mjet1 <85 GeV, 65<mjet2 <85 GeV WZ 65<mjet1 <85 GeV, 85<mjet2 <105 GeV ZZ 85<mjet1 <105 GeV, 85<mjet2 <105 GeV
τ21categories
High-purity τ21, jet1 <0.45, τ21, jet2<0.45
Low-purity τ21, jet1 <0.45, 0.45<τ21, jet2 <0.75
regions to represent the signal. The background probability function is defined by empirical functional forms of 3 and 2 parameters, respectively:
dN dmjj = P0(1−mjj/ √ s)P1 (mjj/ √ s)P2 and dN dmjj = P0 (mjj/ √ s)P2, (2)
where mjj is the dijet invariant mass (equivalent to the diboson candidate mass mVV for this
channel),√s is the pp collision energy in the centre of mass, P0 is a normalization parameter,
and P1and P2parametrize the shape of the mVV distribution. Starting from the two-parameter
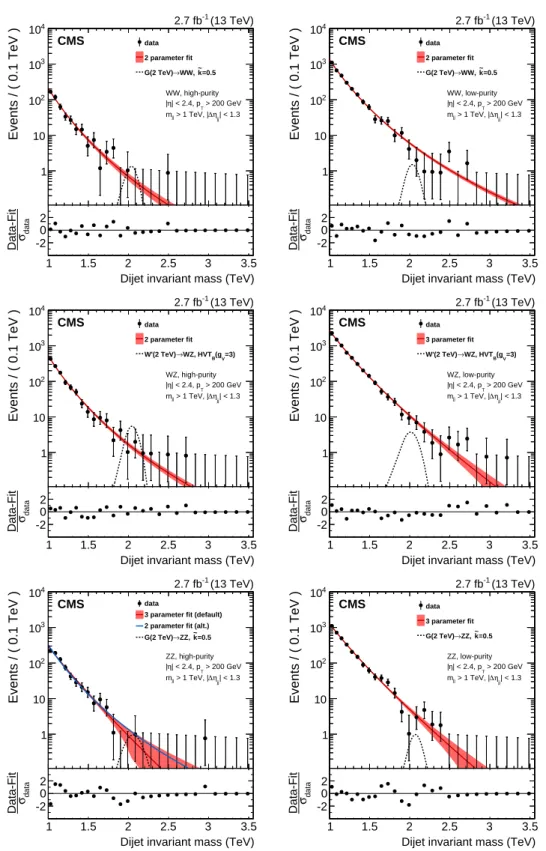
functional form, a Fisher F-test is used to check at 10% confidence level (CL) if additional pa-rameters are needed to model the background distribution. For the WW categories and the WZ HP category, the two-parameter form is found to describe the data spectrum sufficiently well, while for all other channels the three-parameter functional form is preferable. Alternative parametrizations and functions with up to five parameters are also studied as a cross-check. The binning chosen for the fit reflects the detector resolution. The fit range is chosen to start where the trigger efficiency reaches its plateau, as this minimizes bias from trigger inefficiency, and to extend to the bin after the highest mjjmass point. The results are shown in Fig. 1. The
solid curve represents the maximum likelihood fit to the data, fixing the number of expected signal events to zero, while the bottom panels show the corresponding pull distributions, quan-tifying the agreement between the background-only fit and the data. The expected contribu-tions from bulk graviton and W0resonances with a mass of 2 TeV, scaled to their corresponding cross sections, are given by the dashed curves.
5.2 Top quark production
The backgrounds from tt and single top quark production in the`ν+jet channel are estimated
from data-based correction factors in the normalization of the simulation. A top quark enriched control sample is selected by applying all the analysis requirements in`ν+jet events except that
the b jet veto is inverted by requiring, instead, at least one b-tagged AK4 jet in the event. From the comparison between data and simulation, normalization correction factors for tt and single
10 5 Modeling of background and signal Events / ( 0.1 TeV ) 1 10 2 10 3 10 4 10 data 2 parameter fit =0.5 k ~ WW, → G(2 TeV) WW, high-purity > 200 GeV T | < 2.4, p η | | < 1.3 jj η ∆ > 1 TeV, | jj m (13 TeV) -1 2.7 fb CMS
Dijet invariant mass (TeV)
1 1.5 2 2.5 3 3.5 data σ Data-Fit -2 0 2 Events / ( 0.1 TeV ) 1 10 2 10 3 10 4 10 data 2 parameter fit =0.5 k ~ WW, → G(2 TeV) WW, low-purity > 200 GeV T | < 2.4, p η | | < 1.3 jj η ∆ > 1 TeV, | jj m (13 TeV) -1 2.7 fb CMS
Dijet invariant mass (TeV)
1 1.5 2 2.5 3 3.5 data σ Data-Fit -2 0 2 Events / ( 0.1 TeV ) 1 10 2 10 3 10 4 10 data 2 parameter fit =3) V (g B WZ, HVT → W'(2 TeV) WZ, high-purity > 200 GeV T | < 2.4, p η | | < 1.3 jj η ∆ > 1 TeV, | jj m (13 TeV) -1 2.7 fb CMS
Dijet invariant mass (TeV)
1 1.5 2 2.5 3 3.5 data σ Data-Fit -2 0 2 Events / ( 0.1 TeV ) 1 10 2 10 3 10 4 10 data 3 parameter fit =3) V (g B WZ, HVT → W'(2 TeV) WZ, low-purity > 200 GeV T | < 2.4, p η | | < 1.3 jj η ∆ > 1 TeV, | jj m (13 TeV) -1 2.7 fb CMS
Dijet invariant mass (TeV)
1 1.5 2 2.5 3 3.5 data σ Data-Fit -2 0 2 Events / ( 0.1 TeV ) 1 10 2 10 3 10 4 10 data
3 parameter fit (default) 2 parameter fit (alt.)
=0.5 k ~ ZZ, → G(2 TeV) ZZ, high-purity > 200 GeV T | < 2.4, p η | | < 1.3 jj η ∆ > 1 TeV, | jj m (13 TeV) -1 2.7 fb CMS
Dijet invariant mass (TeV)
1 1.5 2 2.5 3 3.5 data σ Data-Fit -2 0 2 Events / ( 0.1 TeV ) 1 10 2 10 3 10 4 10 data 3 parameter fit =0.5 k ~ ZZ, → G(2 TeV) ZZ, low-purity > 200 GeV T | < 2.4, p η | | < 1.3 jj η ∆ > 1 TeV, | jj m (13 TeV) -1 2.7 fb CMS
Dijet invariant mass (TeV)
1 1.5 2 2.5 3 3.5 data σ Data-Fit -2 0 2
Figure 1: Final mjj distributions for the dijet analysis in six signal regions. The high-purity
(on the left) and the low-purity (on the right) categories are shown for the WW (top row), WZ (central row), and ZZ (bottom row) mjetregions. The solid curve represents a background-only
fit to the data distribution, where the filled red area corresponds to the±1 standard deviation statistical uncertainties of the fit. The data are represented by the black points. For the ZZ high-purity category (bottom left), we also show the background-only fit using the two-parameter functional form (blue solid line), for comparison. Signal benchmarks for a mass of 2 TeV are also shown with black dashed lines. In the lower panel of each plot, the bin-by-bin fit residuals,
5.3 The W+jets background 11
top quark background processes are evaluated in the pruned jet mass regions 65 < mjet <
105 GeV and 65 < mjet < 95 GeV, for the electron and muon channels, and for the low- and
high-mass selections, separately. The scale factors, summarized in Table 5, include both the W boson signal and the combinatorial components mainly due to events where the extra b jet from the top quark decay is in the proximity of the W, and are used to correct the normalization of the tt and single top quark simulated background predictions in the signal regions. The mjet
distribution in the top quark enriched sample is shown in the right plot of Fig. 2, while the left plot shows the τ21 distribution. The mjet distribution shows a clear peak for events with a W
boson decaying to hadrons, including the combinatorial background.
Table 5: Data-to-simulation scale factors for tt and single top quark background processes, extracted from the comparison between data and simulation in the top quark enriched control sample.
τ21selection Muon channel Electron channel
τ21 <0.6 (high-mass) 0.87±0.04 0.83±0.07 τ21 <0.45 (low-mass) 0.85±0.05 0.86±0.08 Events / ( 0.04 ) 50 100 150 200 250 300 350 data µν t t Single t VV W+jets MC stat. (13 TeV) -1 2.3 fb CMS 21 τ N-subjettiness ratio 0 0.1 0.2 0.3 0.4 0.5 0.6 0.7 0.8 0.9 1 MC Data 0.51 1.5 Events / ( 5 GeV ) 50 100 150 200 250 300 350 data µν t t Single t VV W+jets MC stat. (13 TeV) -1 2.3 fb CMS
Pruned jet mass (GeV) 40 60 80 100 120 140
MC
Data 0.51 1.5
Figure 2: Distributions in N-subjettiness ratio τ21 (left) and pruned mjet (right) from the top
quark enriched control sample in the muon channel. The tt background is rescaled such that the total number of background events matches the number of events in data. In the lower panel of each plot, the ratio between data and simulation is shown together with the statistical uncertainty in the simulation normalized by its central value.
5.3 The W+jets background
The W+jets background in the `ν+jet channel is estimated through the α ratio method. This
method assumes that the correlation between mjet and mVV for the dominant W+jets
back-ground can be adequately modelled by simulation. A signal-depleted control region (sideband) is defined by requiring the mass of the V jet to lie below or above the nominal selection; the mVV distribution observed in this region is then extrapolated to the nominal region through
a transfer function estimated from simulation. Other minor sources of background, such as tt, single top quark, and SM diboson production, are estimated from simulation after apply-ing correction factors based on control regions in data, as described in Sections 4.4 and 5.2.
12 5 Modeling of background and signal
The sideband region is defined around the jet mass window described in Section 4. The lower and upper sidebands correspond to the mjet ranges 40–65 and 135–150 GeV, respectively. The
Higgs boson mass region, defined by the range 105–135 GeV, corresponds to the signal region of searches for diboson in final states with highly Lorentz-boosted Higgs bosons [66], and is therefore not used to estimate the background.
The overall normalization of the W+jets background in the signal region is determined from a fit to the mjet distribution in the lower and upper sidebands of the data. The analytical form
of the fitting function is chosen from simulation studies, as are the contributions from minor backgrounds. Figure 3 shows the result of this fit for the low- and high-mass`ν+jet channels.
Pruned jet mass (GeV) 40 60 80 100 120 140 data σ Data-Fit -2 0 2 Events / ( 5 GeV ) 50 100 150 200 250 300 350 → signal region ← ← Higgs → WW enriched enrichedWZ ν µ data W+jets WW/WZ tt Single t Uncertainty +jet ν l High-mass (13 TeV) -1 2.3 fb CMS
Pruned jet mass (GeV) 40 60 80 100 120 140 data σ Data-Fit -2 0 2 Events / ( 5 GeV ) 50 100 150 200 250 300 350 signal region→ ← ← Higgs → ν µ data W+jets WW/WZ tt Single t Uncertainty +jet ν l Low-mass (13 TeV) -1 2.3 fb CMS
Figure 3: Distributions of the pruned jet mass mjet in the`ν+jet high-mass (left) and low-mass
(right) analyses in the muon channel. All selections are applied except the requirement on mjet signal window. Data are shown as black points. The signal regions and mjet categories
of the analyses are indicated by the vertical dotted lines. The shaded mjetregion 105–135 GeV
is not used in these analyses. In the lower panel of each plot, the bin-by-bin fit residuals,
(Ndata−Nfit)/σdata, are shown together with the uncertainty band of the fit normalized by the statistical uncertainty of data points, σdata.
The form of the mVV distribution for the W+jets background in the signal region (SR) is
de-termined from the lower mjet sideband (SB), through the transfer function αMC(mVV)obtained
from the W+jets simulation, and defined as:
αMC(mVV) =
FMC,SRW+jets(mVV)
FMC,SBW+jets(mVV)
, (3)
where F(mVV) is the probability density function used to describe the mVV spectrum in
dif-ferent regions. The upper mjet sideband is not considered in this fit since the expected mVV
distribution is different here, displaying a threshold effect not present in the lower sideband and signal regions. The adopted parameterization for the mVV spectrum in both SR and SB
regions is of the form f(x) ∝ ec0x+c1/x, which is found to adequately describe the simulation.
Tests are performed with alternative functional forms, and the prediction for the backgrounds is found to agree with the one of the default function within the uncertainties.
5.4 Signal modelling 13
The mVV distribution observed in the lower sideband region is corrected for the presence of
minor backgrounds to have an estimate of the W+jets contribution in the control region of the data, FDATAW+jets,SB(mVV). The W+jets background distribution in the signal region is then obtained
by rescaling FW+jets
DATA,SB(mVV)by αMC(mVV). The minor backgrounds are then added to the W+jets
background to obtain the total SM prediction in the signal region.
Figure 4 shows the final spectrum in mVVfor events in all categories for the low- and high-mass
analyses. The observed data and the predicted background agree. The highest mass events in the `ν+jet channel are at mVV = 2.95 and 3.15 TeV for the muon and electron categories,
respectively.
5.4 Signal modelling
Figure 5 shows the simulated mjjand m`ν+jetdistributions for different resonance masses from
0.8 to 4.0 TeV. The experimental resolution for the dijet channel is around 4%, while it ranges from 6% at 1 TeV to 4% at 4 TeV in the`ν+jet channel. We adopt an analytical description of the
signal, choosing a double-sided Crystal Ball (CB) function [67] (i.e. a Gaussian core with power law tails on both sides) to describe the simulated resonance distributions. A linear interpolation between a set of reference distributions (corresponding to masses of 0.6, 0.7, 0.8, 1.0, 1.2, 1.4, 1.6, 1.8, 2.0, 2.5, 3.0, 3.5, and 4.0 TeV) is used to estimate the expected distributions for intermediate values of resonance mass. Table 6 summarizes the overall event-selection efficiency for our chosen analysis channels and signal models. All channels are used in the statistical analysis of each signal.
6
Systematic uncertainties
6.1 Systematic uncertainties in the background estimation
For the dijet analysis, the background estimation is obtained from a fit to the data. As such, the only relevant uncertainty is the statistical one as represented by the covariance matrix of the fit to the dijet function. Different parameterizations of the fitting function have been studied, and the differences observed are well within the bounds of the aforementioned uncertainty and are assumed to pose no additional contribution.
For the`ν+jet analyses, uncertainties in both the distribution and normalization of the
back-ground prediction can be important. The uncertainty in the distribution is dominated by the statistical uncertainties in the simultaneous fits to the data of the sideband region, and the simulation in signal and sideband regions. An effect of almost equal magnitude is due to the uncertainties in the modelling of the transfer function α(mVV)between the sideband and the
signal region. The uncertainty in the normalization of the background has three sources: the W+jets component, dominated by the statistical uncertainty of the events in the pruned jet mass sideband, varying from 5 to 9%; the tt/single top quark component, dominated by the scale factor obtained from the top quark enriched control region, amounting to about 5–7% and 8% in the muon and electron channels, respectively; and the diboson component, dominated by the V tagging uncertainty, which varies in the range of 3–25%.
6.2 Systematic uncertainties in the signal prediction
The dominant uncertainty in the signal selection efficiency arises from uncertainties in data-to-simulation scale factors for the V tagging efficiency derived from a top quark enriched control sample, as described in Section 4.4. The normalization uncertainties are summarized in Tables 7 and 8 for the dijet and`ν+jet channels, respectively.
14 6 Systematic uncertainties (TeV) VV m 1 1.5 2 2.5 3 3.5 4 data σ Data-Fit -2 0 2 Events / ( 0.1 TeV ) -2 10 -1 10 1 10 2 10 3 10 4 10 5 10 ν data l W+jets WW/WZ tt Single t Uncertainty 100) × =0.5 ( k ~ G(2 TeV), WW enriched (13 TeV) -1 2.3 fb CMS (TeV) VV m 1 1.5 2 2.5 3 3.5 4 data σ Data-Fit -2 0 2 Events / ( 0.1 TeV ) -2 10 -1 10 1 10 2 10 3 10 4 10 5 10 ν data l W+jets WW/WZ tt Single t Uncertainty =3) V (g B W'(2 TeV), HVT WZ enriched (13 TeV) -1 2.3 fb CMS (TeV) VV m 0.6 0.7 0.8 0.9 1 1.1 1.2 1.3 1.4 1.5 data σ Data-Fit -2 0 2 Events / ( 0.05 TeV ) 100 200 300 400 500 600 700 data lν W+jets WW/WZ tt Single t Uncertainty 20) × =0.5 ( k ~ G(0.75 TeV), (13 TeV) -1 2.3 fb CMS
Figure 4: (Upper plots) Final mVVdistributions for data and expected backgrounds in the
high-mass analysis obtained from the combined muon and electron channels in the WW-enriched (left) and WZ-enriched (right) signal regions. (Lower plot) Final mVV distributions for data
and expected backgrounds in the signal region of the low-mass analysis obtained from the combined muon and electron channels. In each plot the solid curve represents the background estimation provided by the α ratio method. The hatched band includes both statistical and systematic uncertainties. The data are shown as black points. Signal benchmarks for a mass of 2 TeV (0.75 TeV) are also shown with black dashed lines for the upper (lower) plots. In the lower panel of each plot are the bin-by-bin fit residuals, (Ndata−Nfit)/σdata, shown together with the uncertainty band of the fit normalized by the statistical uncertainty of data, σdata.
6.2 Systematic uncertainties in the signal prediction 15
Dijet invariant mass (TeV) 1 1.5 2 2.5 3 3.5 4 4.5 5 Arbitrary scale 0 0.1 0.2 0.3 0.4 0.5 0.6 0.7 0.8 WZ (MADGRAPH) → W' WW (MADGRAPH) → Bulk G ZZ (MADGRAPH) → Bulk G 13 TeV CMS Simulation (TeV) +jet ν l m 1 1.5 2 2.5 3 3.5 4 4.5 Arbitrary scale 0 0.1 0.2 0.3 0.4 0.5 0.6 0.7 0.8 WZ (MADGRAPH) → W' WW (MADGRAPH) → bulk G WW (MADGRAPH) → Z' 13 TeV CMS Simulation
Figure 5: Dijet invariant mass (left) and m`ν+jet(right) distributions expected for different signal
mass hypotheses.
Table 6: Summary of signal efficiencies for all analysis channels and all signal models. The quoted efficiencies are in percent, and include the branching fractions of the two vector bosons to the final state of the analysis channel, effects from detector acceptance, as well as reconstruc-tion and selecreconstruc-tion efficiencies. Values are not indicated for categories and masses where the analysis channel has no sensitivity.
Efficiency (%)
Dijet channel `ν+jet channel
Signal Mass (TeV) WW WZ ZZ WW WZ
HP LP HP LP HP LP e µ e µ Gbulk→WW 0.75 — — — — — — 4.4 5.3 — — Gbulk→WW 1.2 4.9 5.6 3.6 3.9 0.6 0.6 5.7 7.4 1.7 2.1 Gbulk→WW 2.0 6.5 9.1 2.1 2.9 0.2 0.3 7.3 8.0 1.4 1.5 Gbulk→WW 3.0 4.9 7.8 2.3 3.3 0.3 0.3 7.0 7.5 1.5 1.7 Gbulk→WW 4.0 4.2 8.0 2.8 3.9 0.3 0.6 7.0 7.0 2.0 1.9 Gbulk→ZZ 1.2 1.1 1.2 5.3 5.1 6.1 4.6 — — — — Gbulk→ZZ 2.0 1.3 2.3 5.0 6.7 4.7 4.5 — — — — Gbulk→ZZ 3.0 1.1 2.5 4.3 7.2 3.8 4.5 — — — — Gbulk→ZZ 4.0 0.9 2.7 3.7 7.2 3.7 4.3 — — — — HVT W0 →WZ 0.75 — — — — — — 1.3 1.6 — — HVT W0 →WZ 1.2 2.7 3.0 7.2 6.8 1.5 1.4 1.2 1.6 2.8 3.4 HVT W0 →WZ 2.0 3.0 4.7 6.0 6.7 0.8 0.8 1.8 2.0 3.0 3.3 HVT W0 →WZ 3.0 2.3 4.5 5.0 6.8 1.0 0.8 1.9 2.0 3.1 3.2 HVT W0 →WZ 4.0 1.9 4.2 4.2 6.4 1.0 1.2 1.9 2.0 3.1 3.0 HVT Z0 →WW 0.75 — — — — — — 4.1 5.1 — — HVT Z0 →WW 1.2 7.2 7.6 3.3 3.6 0.4 0.4 6.0 7.7 1.6 2.0 HVT Z0 →WW 2.0 6.1 8.1 2.0 2.3 0.1 0.2 7.9 8.8 1.3 1.5 HVT Z0 →WW 3.0 4.7 8.0 2.1 2.8 0.3 0.2 7.5 8.1 1.6 1.5 HVT Z0 →WW 4.0 3.8 6.7 2.1 3.0 0.3 0.3 7.4 7.6 1.9 1.9
Uncertainties in the reconstruction of jets affect both the signal efficiency and the distribution in the reconstructed resonance mass. The four-momenta of the reconstructed jets are rescaled or smeared according to the uncertainties in the respective jet energy scale or resolution. The se-lection efficiencies are recalculated on these modified events, with the resulting changes taken
16 7 Statistical interpretation
as systematic uncertainties that depend on the resonance mass. The induced changes on the reconstructed resonances are propagated as uncertainties in the peak position and width of the Gaussian core. In addition, the induced relative migration among V jet mass categories is evaluated, and found not to affect the overall signal efficiency. The correlations in these uncer-tainties between the different categories are taken into account.
The uncertainty in the lepton energy scale is correlated with the obtained signal efficiency. Changes in lepton energy are propagated to the reconstructed pmissT , and through the entire analysis. The relative change in the number of selected signal events is taken as a systematic uncertainty in the signal normalization. For both lepton flavors, the uncertainties are smaller than 1%, and are uncorrelated for different lepton flavors, but correlated for different pruned jet mass and τ21 categories. In addition, the induced change in peak position and its width
are added as systematic uncertainties in the distribution of the signal. Again, for both lepton flavors, the uncertainties are below 1%.
The systematic uncertainties in the lepton trigger, identification, and isolation efficiencies are obtained using a tag-and-probe method in Z→ ``events [43], and are used only for the`ν+jet
channel. An uncertainty of 1–3% is assigned to the trigger efficiency for both lepton flavors, depending on the lepton pT and η. For lepton identification and isolation efficiency, the
sys-tematic uncertainty is estimated to be 1–2% for the muon and 3% for electron flavors.
The 2.7% uncertainty in the integrated luminosity [45] applies to the normalization of signal events. Uncertainties in the signal yield due to the choice of PDFs and the values chosen for the factorization (µf) and renormalization (µr) scales are also taken into account. The PDF
un-certainties are evaluated using the NNPDF 3.0 [36] PDFs. The uncertainty related to the choice of µf and µr scales is evaluated following the proposal in Refs. [68, 69] by varying the
de-fault choice of scales in the following 6 combinations of factors:(µf, µr) × (1/2, 1/2),(1/2, 1),
(1, 1/2),(2, 2),(2, 1), and(1, 2). The uncertainty in the signal cross section from the choice of PDFs and of factorization and renormalization scales ranges from 4 to 77%, and from 1 to 22%, respectively, depending on the resonance mass, particle type and its production mechanism. These uncertainties are fully correlated among the`ν+jet and dijet channels.
Tables 7 and 8 summarize the systematic uncertainties in the dijet and`ν+jet channels,
respec-tively.
7
Statistical interpretation
The mVV distribution observed in data and the SM background prediction are compared to
check for the presence of a new resonance decaying to vector bosons. No bins with an excess with significance larger than three standard deviations are observed. We set upper limits on the production cross section of such resonances by combining the event categories of the dijet and
`ν+jet analyses. We follow the asymptotic approximation [70] of the CLS criterion described
in Refs. [71, 72]. The limits computed following this approach are found to agree with the results obtained using the modified frequentist prescription [71, 72]. For each channel and each signal hypothesis a likelihood function is built from the reconstructed mVV mass distribution
observed in data, the background prediction, and the signal resonance shape. A maximum-likelihood fit to the data is then performed to obtain the best estimate of the signal cross section. Systematic uncertainties are profiled [73] as log-normal nuisance parameters in the statistical interpretation, and for each possible value of the fitted signal cross section they are all refitted to maximize the likelihood.
7.1 Limits on narrow-width resonance models 17
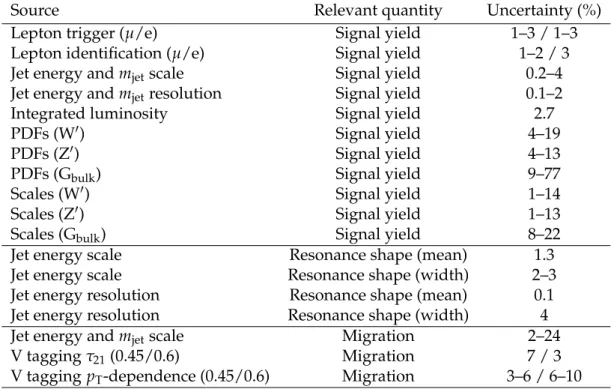
Table 7: Summary of the systematic uncertainties in the contribution from signal in the dijet analysis and their impact on the event yield in the signal region and on the reconstructed dis-tribution in mVV (mean and width). The last three uncertainties result in migrations between
event categories, but do not affect the overall signal efficiency.
Source Relevant quantity HP uncertainty (%) LP uncertainty (%)
Jet energy scale Resonance shape 2 2
Jet energy resolution Resonance shape 10 10
Jet energy and mjet scale Signal yield 0.1–4
Jet energy and mjet resolution Signal yield 0.1–1.4
Pileup Signal yield 2
Integrated luminosity Signal yield 2
PDFs (W0) Signal yield 4–19
PDFs (Z0) Signal yield 4–13
PDFs (Gbulk) Signal yield 9–77
Scales (W0) Signal yield 1–14
Scales (Z0) Signal yield 1–13
Scales (Gbulk) Signal yield 8–22
Jet energy and mjet scale Migration 1–50
V tagging τ21 Migration 14 21
V tagging pT-dependence Migration 7–14 5–11
7.1 Limits on narrow-width resonance models
Exclusion limits are set in the context of the bulk graviton model and of the HVT Models A and B, under the assumption of a natural width negligible compared to the experimental resolu-tion (narrow-width approximaresolu-tion). To maximize the sensitivity of the search we combine the results from all the analysis channels in each of the considered signal hypotheses. In the combi-nation, the systematic uncertainties in jet momentum scale and resolution, V tagging efficiency scale factors, and integrated luminosity are assumed to be 100% correlated.
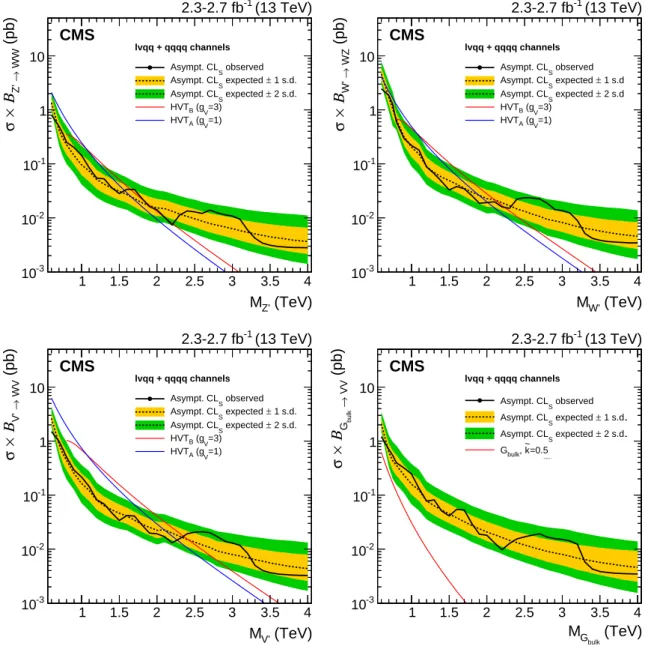
Figure 6 shows the resulting expected and observed exclusion limits at 95% CL on the signal cross section as a function of the resonance mass for all signal hypotheses. The limits are com-pared with the product of cross section and branching fraction (σB) to WW and ZZ for a bulk graviton with k/MPl= 0.5, and with σBfor WZ and WW for spin-1 particles predicted by the
HVT Models A and B. In this context, we consider a scenario where we expect the W0 and Z0 bosons to be degenerate in mass (triplet hypothesis). In addition, we consider also a scenario where only a charged (W0) or a neutral (Z0) resonance is expected at a given mass (singlet hy-pothesis). Combining the analyses leads to about 10–30% more stringent expected upper limits on the cross section compared to the most sensitive individual channel, depending on the reso-nance mass and the signal hypothesis. For Gbulk, Z0and triplet signals (W’ signal) with masses
<0.8 TeV (<0.75 TeV), the limits are obtained from the low-mass `ν+jet channel, while for the
higher masses they are obtained from the high-mass`ν+jet and dijet channels. The dijet
analy-sis provides more stringent expected upper limits on the cross sections than the`ν+jet analysis
for resonance masses above 1.7 TeV for Z0 and>1.3 TeV for W0, because of the larger branching fractions: B(WW → qqqq) = 44%, B(WW → `νqq) = 31%, B(WZ → qqqq) = 46%, and B(WZ → `νqq) = 16%. In fact, the combination of high- and low-purity categories, together
with the weak dependence of tagging efficiency on pT [20] improves the sensitivity for most
potential signal models. In the narrow-width bulk graviton model, the combined sensitivity of the searches is not large enough to set mass limits, however, cross sections are excluded in the range 3–1200 fb. For HVT Model A (B), the combined data exclude singlet W0 resonances with
18 7 Statistical interpretation
Table 8: Summary of the signal systematic uncertainties for the`ν+jet analyses and their impact
on the event yield in the signal region and on the reconstructed mVVshape (mean and width)
for both muon and electron channels. The last three uncertainties result in migrations between event categories, but do not affect the overall signal efficiency. The correlations among different categories are taken into account.
Source Relevant quantity Uncertainty (%)
Lepton trigger (µ/e) Signal yield 1–3 / 1–3
Lepton identification (µ/e) Signal yield 1–2 / 3
Jet energy and mjet scale Signal yield 0.2–4
Jet energy and mjet resolution Signal yield 0.1–2
Integrated luminosity Signal yield 2.7
PDFs (W0) Signal yield 4–19
PDFs (Z0) Signal yield 4–13
PDFs (Gbulk) Signal yield 9–77
Scales (W0) Signal yield 1–14
Scales (Z0) Signal yield 1–13
Scales (Gbulk) Signal yield 8–22
Jet energy scale Resonance shape (mean) 1.3
Jet energy scale Resonance shape (width) 2–3
Jet energy resolution Resonance shape (mean) 0.1
Jet energy resolution Resonance shape (width) 4
Jet energy and mjet scale Migration 2–24
V tagging τ21(0.45/0.6) Migration 7 / 3
V tagging pT-dependence (0.45/0.6) Migration 3–6 / 6–10
masses <2.0 (2.2) TeV and Z0 resonances with masses below <1.6 (1.7) TeV. Under the triplet hypothesis, spin-1 resonances with masses<2.3 and<2.4 TeV are excluded for HVT Models A and B, respectively.
Figure 7 shows a scan of the coupling parameters and the corresponding observed 95% CL exclusion contours in the HVT model for the combined analyses. The parameters are defined as gVcHand g2cF/gV, related to the coupling strengths of the new resonance to the Higgs boson
and to fermions. The range of the scan is limited by the assumption that the new resonance is narrow. A contour is overlaid, representing the region where the theoretical width is larger than the experimental resolution of the searches, and hence where the narrow-resonance assumption is not satisfied. This contour is defined by a predicted resonance width of 5%, corresponding to the narrowest resonance mass resolution of the searches.
7.2 Model-independent limits
The above analysis is specific to a narrow bulk graviton and HVT models, but these are not the only extension of the SM that predicts resonances decaying to vector bosons. It is therefore useful to reinterpret these results through a more generic model. In this section, we present the exclusion limits on the number of events that remain after modifying the analysis and greatly simplifying its structure, at a moderate cost in performance. Together with the upper limits on the number of signal events, we provide tables on reconstruction and identification efficiencies for vector bosons emitted in the kinematic acceptance of the analysis. Following the instructions detailed in Appendix A, it is possible to estimate the number of events expected in a generic signal that would be detected in CMS with the present data set, and to compare it with the upper limit on the number of signal events.
7.2 Model-independent limits 19 (TeV) Z' M 1 1.5 2 2.5 3 3.5 4 (pb) WW → Z' Β × σ -3 10 -2 10 -1 10 1 10 (13 TeV) -1 2.3-2.7 fb CMS observed S Asympt. CL 1 s.d. ± expected S Asympt. CL 2 s.d. ± expected S Asympt. CL =3) V (g B HVT =1) V (g A HVT lvqq + qqqq channels (TeV) W' M 1 1.5 2 2.5 3 3.5 4 (pb) WZ → W' Β × σ -3 10 -2 10 -1 10 1 10 (13 TeV) -1 2.3-2.7 fb CMS observed S Asympt. CL 1 s.d ± expected S Asympt. CL 2 s.d ± expected S Asympt. CL =3) V (g B HVT =1) V (g A HVT lvqq + qqqq channels (TeV) V' M 1 1.5 2 2.5 3 3.5 4 (pb) WV → V' Β × σ -3 10 -2 10 -1 10 1 10 (13 TeV) -1 2.3-2.7 fb CMS observed S Asympt. CL 1 s.d. ± expected S Asympt. CL 2 s.d. ± expected S Asympt. CL =3) V (g B HVT =1) V (g A HVT lvqq + qqqq channels (TeV) bulk G M 1 1.5 2 2.5 3 3.5 4 (pb) VV → bulk G Β × σ -3 10 -2 10 -1 10 1 10 Observed S Asympt. CL 1 s.d. ± Expected S Asympt. CL 2 s.d. ± Expected S Asympt. CL =0.5 k ~ , VV → bulk G BR × TH σ (13 TeV) -1 2.3-2.7 fb CMS observed S Asympt. CL 1 s.d. ± expected S Asympt. CL 2 s.d. ± expected S Asympt. CL =0.5 k ~ , bulk G lvqq + qqqq channels
Figure 6: Observed (black solid) and expected (black dashed) 95% CL upper limits on the production of a narrow-width resonance decaying to a pair of vector bosons for different signal hypotheses. In the upper plots, limits are set in the context of a spin-1 neutral Z0 (left) and charged W0 (right) resonances, and compared with the prediction of the HVT Models A and B. In the lower left plot, limits are set in the same model under the triplet hypothesis (W0 and Z0). In the lower right plot, limits are set in the context of a bulk graviton with k/MPl = 0.5
and compared with the prediction. For Gbulk, Z0 and triplet signals (W’ signal) with masses
<0.8 TeV (<0.75 TeV), the limits are obtained from the low-mass `ν+jet channel, while for the
higher masses they are obtained from the high-mass`ν+jet and dijet channels.
To avoid the dependence on assumptions in the construction of the separate categories, we perform a simplified analysis, reducing the event classification to two (`ν+jet) and one (dijet)
categories, respectively. This is done by eliminating the low-purity categories and combining the jet mass categories in the analyses. The loss in performance is very small for a large range of masses. The effect of dropping the LP category is observed only at very high masses, where the upper limit on the cross section becomes less stringent.
20 7 Statistical interpretation H c V g -3 -2 -1 0 1 2 3 V /gF c 2 g -1 -0.5 0 0.5 1 3.5 TeV 1.5 TeV 2 TeV A B > 5% M th Γ (13 TeV) -1 2.3-2.7 fb CMS
Figure 7: Exclusion regions in the plane of the HVT couplings (g2cF/gV, gVcH) for three
reso-nance masses, 1.5, 2.0, and 3.5 TeV. Model points A and B of the benchmarks used in the analy-sis are also shown. The solid, dashed, and dashed-dotted lines represent the boundaries of the regions excluded by this search for different resonance masses (the region outside these lines is excluded). The areas indicated by the solid shading correspond to regions where the reso-nance width is predicted to be more than 5% of the resoreso-nance mass and the narrow-resoreso-nance assumption is not satisfied.
A generic model cannot be restricted to narrow signals, and we therefore provide limits as a function of both mass (MX) and natural width (ΓX) of the new resonance. The generated line
shape is parametrized with a BW function and its full width at half maximum is defined as the Γ parameter of the BW function. The BW line shape is convolved with a double sided CB func-tion describing the detector resolufunc-tion in the`ν+jet analysis, and with a sum of a Gaussian and
CB functions for the dijet analysis. AsΓXis varied, the parameters of the double-CB function
are kept fixed to the values determined under the narrow-width approximation. It has been checked that the parametrization of detector effects factorizes from the natural width of the resonance and is stable as ΓX increases. The width is scanned at regular steps of the relative
width, ΓX/MX, which spans from the zero-width approximation (as in the nominal analysis),
up toΓX/MX = 0.30, in steps of 0.05. For high masses, the resonance shape is distorted from
the BW shape owing to PDF effects creating a tail towards low masses. The line shape is cor-rected for this by a linear function that works well for quark induced processes. However, the shape description using this approach is unsatisfactory for gluon induced processes at very high masses and widths.
We provide the efficiency as a function of the kinematic variables of the vector boson, as the efficiency can depend significantly on the production and decay kinematic quantities of the new resonance. The efficiencies are extracted from the bulk graviton samples generated for the baseline analysis. The efficiencies are calculated by first preselecting simulated signal events according to the acceptance requirements of the analysis. The tables are therefore valid only within this kinematic region, as summarized in Tables 9 and 10 of Appendix A for the `ν+jet
and dijet analyses, respectively. For preselected events, the reconstructed V candidates are then required to pass all the analysis selections. The efficiencies are presented as a function of the pT and η of the V boson prior to any simulation of detector effects. All the reweighting and
7.2 Model-independent limits 21
factors) are included in the efficiencies.
The efficiencies of requiring no additional well-identified leptons and b-tagged jets in the`ν+jet
analysis are found to be independent of the diboson event kinematics. We use a constant ef-ficiency of 95% for the combined vetoes. Similarly, the∆η requirement in the dijet analysis is taken into account as a global efficiency factor of 98%.
It has been checked that the dependence of the total signal efficiency and acceptance on the width of the generated sample is very weak. We include this effect in the systematic uncertain-ties of the procedure, as discussed below.
Special consideration is given to cases where the boson is transversely polarized, because the calculated efficiencies are based on longitudinally polarized bosons, as in the case of the refer-ence bulk graviton model. The efficiency of the V tagging selections depend significantly on the degree of polarization of the vector boson [21]. This effect is investigated using RS1 gravi-tons produced with the MADGRAPH generator. The V bosons originating from the decays of RS1 gravitons are transversely polarized in about 90% of the cases. For bosons decaying lep-tonically, the tables are still valid because of the generator-level selection on individual leptons, which guarantees that polarization effects for the leptonic boson are included in the acceptance. As shown in Ref. [21], the efficiency of the jet substructure selection is found to be smaller for transversely polarized V bosons that tend to have more asymmetric subjet pT, resulting in a
higher probability for the subjet with lower pTto be rejected by the pruning algorithm. Studies
of simulated RS1 graviton samples show that the loss in efficiency is largely independent of the V kinematic variables, so that the effect of the transverse polarization can be adequately modelled by a constant scale factor of 0.76, independent of the pTand η of the V →qq decays.
To validate the above procedure, the resulting parametrized efficiencies (including the event veto efficiencies) are used to predict the total efficiency for reconstructing resonances of differ-ent spin and width. The estimation is compared to the exact number obtained from performing the baseline analysis directly on the simulated events. In all cases, the agreement between the nominal and parametrized efficiencies are of the order of 10–20% for the majority of the param-eter space, but grow up to 40% for very low resonance masses, were migration effects over se-lection boundaries cannot be treated in our parametrization approach. Various approximations and uncertainties contribute to the final additional systematic uncertainty in the efficiency; the
(TeV) X M 1 2 3 4 X /M X Γ 0.00 0.05 0.10 0.15 0.20 0.25 0.30 +jet) ν (l events N 4 5 10 20 30 40 2 10 2 10 × 2 (13 TeV) -1 2.3 fb CMS (TeV) X M 1.5 2.0 2.5 3.0 3.5 4.0 X /M X Γ 0.00 0.05 0.10 0.15 0.20 0.25 0.30 (dijet) events N 3 4 5 10 20 30 40 2 10 (13 TeV) -1 2.7 fb CMS
Figure 8: Observed exclusion limits at 95% CL on the number of events for a WV → `ν+
jet (left) and a VV → dijet (right) resonance, as a function of its mass and normalized width. The dark shaded area denotes the kinematic regime where the limit is valid only for the quark-antiquark annihilation processes.