Abstract—Vehicular Delay-Tolerant Networking (VDTN) is an
extension of the Delay-Tolerant Network (DTN) architecture concept to transit networks. VDTN architecture handles non-real time applications, exploiting vehicles to enable connectivity under unreliable scenarios with unstable links and where an end-to-end path may not exist. Intuitively, the use of stationary store-and-forward devices (relay nodes) located at crossroads where vehicles meet them and should improve the message delivery probability. In this paper, we analyze the influence of the number of relay nodes, in urban scenarios with different numbers of vehicles. It was shown that relay nodes significantly improve the message delivery probability on studied DTN routing protocols.
Index Terms—Vehicular Delay-Tolerant Networks; Relay
Nodes; Delay-Tolerant Networks
I. INTRODUCTION
Delay Tolerant Networks (DTNs) [1] are a class of networks designed to address several challenging connectivity issues such as sparse connectivity, long or variable delay, intermittent connectivity, asymmetric data rate, high latency, high error rates and even no end-to-end connectivity. The DTN architecture adopts a store-and-forward paradigm and a common bundle layer located on the top of region-specific network protocols in order to provide interoperability of heterogeneous networks (regions). In this type of network, a source node originates a message (bundle) that is forwarded to an intermediate node (fixed or mobile) thought to be more close to the destination node. The intermediate node stores the message and carries it while a contact is not available. Then the process is repeated, so the message will be relayed hop by hop until reaching its destination.
The concept of Delay-Tolerant Networking has been widely applied to scenarios like interplanetary networking [2], data MULEs [3], underwater networks [4], and wildlife tracking sensor networks like ZebraNet [5]. Vehicular networks [6, 7] are another example for an application of the DTN concept.
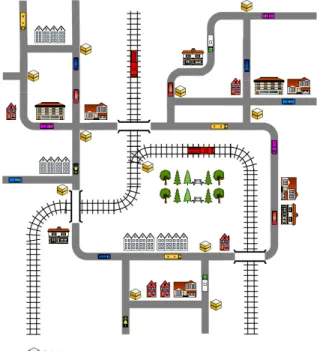
In this paper we exemplify the use of a Vehicular DTN (VDTN) to provide asynchronous communication between mobile nodes and relay nodes, on an old part of a city with a large area and restricted vehicular access (Fig. 1). Mobile nodes (e.g., vehicles) physically carry the data, exchanging information with one another. They can move along the roads randomly (e.g. cars), or following predefined routes (e.g. buses and trams). Relay nodes are stationary devices located at crossroads, with store-and-forward capabilities. They allow mobile nodes passing by to pickup and deposit data on them. We can also envision the possibility for the relay nodes to be able to exchange data with each other, and at least one of them may have a direct access to the Internet.
Some of the potential non-real time applications for this scenario are: notification of blocked roads, accident warnings, free parking spots, advertisements, and also gathering information collected by vehicles such as road pavement defects.
Fig. 1. Example of the use of a VDTN in an urban scenario.
Improving Vehicular Delay-Tolerant Network
Performance with Relay Nodes
Vasco N. G. J. Soares
1,2,3, Farid Farahmand
4, and Joel J. P. C. Rodrigues
1,2 1Instituto de Telecomunicações, NetGNA Group, Covilhã, Portugal 2Department of Informatics, University of Beira Interior, Covilhã, Portugal3Superior School of Technology, Polytechnic Institute of Castelo Branco, Castelo Branco, Portugal 4Department of Engineering Science, Sonoma State University, CA, USA
The use of relay nodes should create a greater number of connectivity opportunities, improving the performance of the VDTN network in terms of message delivery probability. The key contribution of this paper is the evaluation of the impact of the number of relay nodes on DTN routing protocols, in scenarios with different numbers of mobile nodes.
The remainder of this paper is organized as follows. Section II briefly reviews the related work on fixed relay node deployment, identifying our contribution. Section III presents the simulation scenario and discusses the results. Section IV concludes the paper and provides guidelines for future work.
II. RELATED WORK
The usage of stationary nodes to improve the overall performance of mobile DTNs has been studied in [8-12]. In [8] the authors suggest the use of throwboxes in mobile DTNs, in order to increase the number of contact opportunities thus improving the network capacity. They propose algorithms to deploy the throwboxes that consider both placement and routing. This work is complemented in [11], where the authors present an energy efficient hardware and software architecture for throwboxes.
The work in [9] considers the cases where the throwboxes are fully disconnected or mesh connected, analyzing for each case the impact of the number of throwboxes over the performance of routing protocols. The work in [10] evaluates the relation of adding relay nodes to the overall network performance of a Vehicular Wireless Burst Switching Network (VWBS). It proposes and compares the performance of heuristic algorithms whose objective is to maximize the network performance in terms of delay or network cost, providing a solution to the relay node placement problem. In [12] the authors study the tradeoffs of mobile networks enhanced with the deployment of relays, meshes, and wired base stations infrastructure.
Our work considers Vehicular Delay-Tolerant Network as a particular application for a mobile DTN characterized by the opportunistic contacts, where end-to-end connectivity may not exist, and intermittent connectivity is common. We are interested in the study of the impact analyses produced by the relay nodes in scenarios with different numbers of mobile nodes.
III. PERFORMANCE EVALUATION
To demonstrate how relay nodes improve the performance of a VDTN network, we run several simulations using the Opportunistic Network Environment (ONE) Simulator [13]. In the networks scenario, the number of mobile nodes, and the number of deployed relay nodes on the network was changed. The overall message delivery ratio (measured as the relation of the number of unique delivered messages to the number of
messages sent), and the message delivery delay (measured as the time between message creation and delivery) were analyzed for the following four DTN routing protocols: Epidemic [14], MaxProp [15], PRoPHET [16], and Spray-and-Wait (binary and normal variants, with 12 message copies) [17].
Epidemic is a flooding-based scheme where the nodes exchange the messages they don’t have. MaxProp prioritizes the schedule of messages transmitted to other nodes and also the schedule of messages to be dropped. PRoPHET is a probabilistic routing protocol that considers a history of encounters and transitivity. Finally, the Spray-and-Wait protocol creates a number of copies to be transmitted per message. At each message transfer the number of copies remaining is reduced in one unit in the normal mode, or in the case of the binary mode the number of copies left is reduced in half.
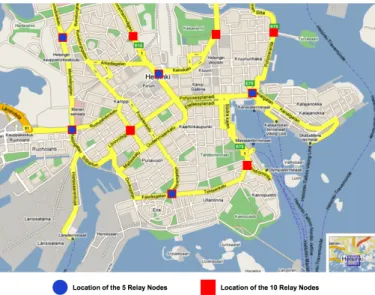
For the simulation scenarios we use the map-based model of a part of the city of Helsinki (Fig. 2) available on the ONE Simulator. We simulate a 12-hour period and measure the differences in performance, when 0, 5, or 10 relay nodes are deployed in (different) network scenarios with 20, 40 or 60 mobile nodes.
Fig. 2. Helsinki simulation area with the locations of the relay nodes.
Mobile nodes (vehicles) move between random map locations. Once a mobile node reaches a destination, it randomly waits 5 to 15 minutes. Then, it selects a new random map location, and a random speed between 10 and 50 km/h. The mobile node moves to the new destination using the shortest path available. Each of the mobile nodes has a 150 Mbytes FIFO message buffer.
Messages are exchanged between random source and destination mobile nodes. It is used an inter-message creation interval in the range [15, 30] (seconds) of uniformly distributed random values. Message size is in the range [500 KB, 1 MB] of uniformly distributed random values. All the messages exchanged have a time to live (TTL) of 1 hour.
advance, and the mobile nodes routes are not pre-assigned and fixed, so there isn’t any knowledge about the transfer opportunities. Therefore, we choose the places for the relay nodes using a non-uniform strategy, positioning them at the crossroads of the main roads of the simulation scenario (Fig. 2). Each of the relay nodes has a 500 Mbytes FIFO message buffer size.
Network nodes connect to each other using IEEE 802.11b with a data rate of 6 Mbit/s (the IEEE 802.11b approximate throughput according to [18]), and a transmission range of 30 meters. Relay nodes coverage cells do not intersect, so they are not able to communicate directly with each other, only with the vehicles. In addition, vehicles exchange data between themselves.
We run series of simulations for each combination of the parameters: number of vehicles, and number of relay nodes. We use different random seeds, and report the mean values. A. Simulation Scenario with 20 Mobile Nodes
We start our evaluation by simulating a scenario with 20 mobile nodes. Because of the low node density, few transmission opportunities are registered when no relay nodes are deployed in the network (Fig. 3). Deploying relay nodes augments the number of contact opportunities per hour between all network nodes. Introducing 10 relay nodes increase the number of contacts at a rate of roughly a factor of two per hour. This effect suggests that relay nodes will contribute to increase the number of messages exchanged between vehicles. !" #!!" $!!" %!!" &!!" '!!" (!!" )!!" *!!" #" $" %" &" '" (" )" *" +" #!" ##" #$" !"#$%&'()'*(+ ,-.,/' 0("&' !",-./0"123-4" '",-./0"123-4" #!",-./0"123-4"
Fig. 3. Number of contacts per hour between all network nodes.
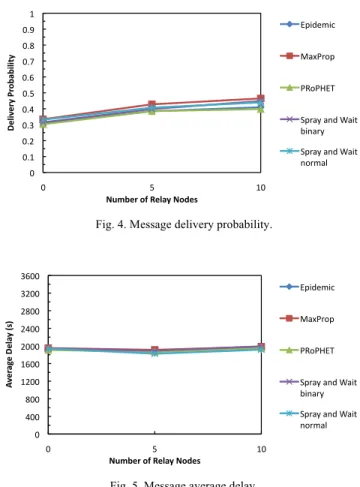
Figure 4 shows that all routing protocols increase message delivery ratio when relay nodes are deployed. When analyzing the simulation results with the introduction of 5 relay nodes, we observe that Epidemic and PRoPHET protocols that perform variants of flooding increase their message delivery probabilities in 7% and 8%, respectively. MaxProp, that also floods but implements explicit message clearing after delivering, improves 9%. Spray-and-Wait that creates a number of copies per message presents gains of 8% and 7% in its binary and normal variants.
Increasing the number of relay nodes to 10 augments the delivery ratio even more. Epidemic and PRoPHET register the least improvements, 2% and 1% respectively. MaxProp
increases its message delivery probability further in 4%. Spray-and-Wait binary variant augments 5%, whereas the normal variant has a gain of 4%. Finally, it can be observed that MaxProp is the routing protocol that takes more benefits from the introduction of the stationary relay nodes, registering the best delivery probabilities.
!" !#$" !#%" !#&" !#'" !#(" !#)" !#*" !#+" !#," $" !" (" $!" !"#$% "& '()& *+,+$#$-'( ./0+"&(*1(2"#,'(.*3"4( -./012/3" 456789." 7:97;-<" =.85>"5?0"@5/A" B/?58>" =.85>"5?0"@5/A" ?9825C"
Fig. 4. Message delivery probability.
!" #!!" $!!" %&!!" %'!!" &!!!" &#!!" &$!!" (&!!" ('!!" !" )" %!" !" #$ %& #'(#)% *'+,-' ./01#$'23'4#)%*'.25#,' *+,-./,0" 123456+" 47648*9" :+52;"2<-"=2,>" ?,<25;" :+52;"2<-"=2,>" <65/2@"
Fig. 5. Message average delay.
The message average delay is an interesting metric, since minimizing it reduces the time that messages spend in the network and reduces the contention for resources in the network (e.g. buffer). In the context of this work the messages have a small TTL and size, and the nodes have a sufficient large buffer. Therefore, we can focus on message delivery probability as the main performance metric. Fig. 5 shows that all routing protocols register similar values for the message average delay, and that relay nodes do not significantly affect this metric.
B. Simulation Scenario with 40 Mobile Nodes
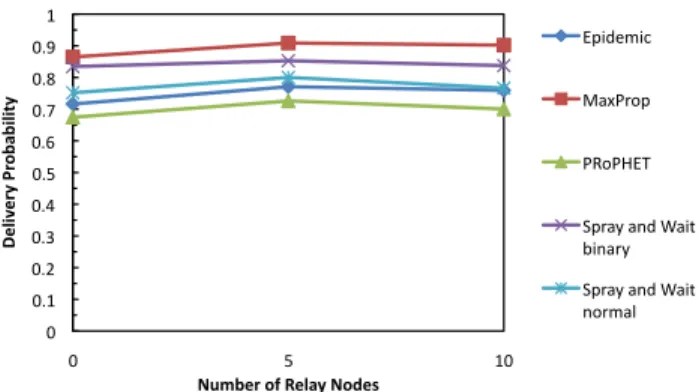
The second scenario has 40 mobile nodes in the network, therefore the number of contact opportunities increases (Fig. 6). As a result, we observe that all routing protocols perform better than in the previous scenario (Fig. 7).
In this new scenario, based on fact that having the double of mobile nodes and, consequently, a much larger number of opportunistic contacts, it could be expected that relay nodes would not affect the performance of the network considerably.
However, in Fig. 7 it may be observed that 5 relay nodes provides up to 9% of gain in message delivery probability for Epidemic routing protocol, 13% for PRoPHET, 13% for MaxProp, 12% for Spray-and-Wait binary variant, and 10% for the normal variant. Notice that these performance gains are superior to the ones presented on the first scenario. Nevertheless, deploying 10 relay nodes instead of 5, does not bring more benefits.
Furthermore, it can be seen that MaxProp and Spray-and-Wait binary variant perform better than the other protocols, independently of the number of relay nodes.
!" #!!" $!!" %!!" &!!" '!!" (!!" )!!" *!!" #" $" %" &" '" (" )" *" +" #!" ##" #$" !"#$%&'()'*(+ ,-.,/' 0("&' !",-./0"123-4" '",-./0"123-4" #!",-./0"123-4"
Fig. 6. Number of contacts per hour between all network nodes.
!" !#$" !#%" !#&" !#'" !#(" !#)" !#*" !#+" !#," $" !" (" $!" !"#$% "& '()& *+,+$#$-'( ./0+"&(*1(2"#,'(.*3"4( -./012/3" 456789." 7:97;-<" =.85>"5?0"@5/A" B/?58>" =.85>"5?0"@5/A" ?9825C"
Fig. 7. Message delivery probability.
Epidemic and PRoPHET routing protocols approximately maintain the message average delay across the simulations (Fig. 8). The other routing protocols register a very slight decrease on the average delay.
!" #!!" $!!" %&!!" %'!!" &!!!" &#!!" &$!!" (&!!" ('!!" !" )" %!" !" #$ %& #'(#)% *'+,-' ./01#$'23'4#)%*'.25#,' *+,-./,0" 123456+" 47648*9" :+52;"2<-"=2,>" ?,<25;" :+52;"2<-"=2,>" <65/2@"
Fig. 8. Message average delay.
C. Simulation Scenario with 60 Mobile Nodes
In this last scenario, we augment the number of mobile nodes to 60. This results in an increase of the number of transmission opportunities, and in the reduction between inter-contact times (Fig. 9). Therefore, routing protocols will perform even better.
!" #!!" $!!" %!!" &!!" '!!" (!!" )!!" *!!" #" $" %" &" '" (" )" *" +" #!" ##" #$" !"#$%&'()'*(+ ,-.,/' 0("&' !",-./0"123-4" '",-./0"123-4" #!",-./0"123-4"
Fig. 9. Number of contacts per hour between all network nodes.
Nevertheless, relay nodes still have a positive impact on the message delivery probability. As Fig. 10 shows, when 5 relay nodes are deployed, Epidemic and MaxProp increase their message delivery probability approximately in 6% and 4%, respectively. PRoPHET improves 5% The same is observed with Spray and Wait variants, that improve 2% and 5% respectively. However, increasing the number of relay nodes to 10 decreases the message delivery ratio. This is due to the problems caused by storage constraints. Having a large node density will cause more data to be exchanged and stored on the network nodes.
Finally, it can be observed that MaxProp is the routing protocol again registers the best delivery probabilities.
!" !#$" !#%" !#&" !#'" !#(" !#)" !#*" !#+" !#," $" !" (" $!" !"#$% "& '()& *+,+$#$-'( ./0+"&(*1(2"#,'(.*3"4( -./012/3" 456789." 7:97;-<" =.85>"5?0"@5/A" B/?58>" =.85>"5?0"@5/A" ?9825C"
Fig. 10. Message delivery probability.
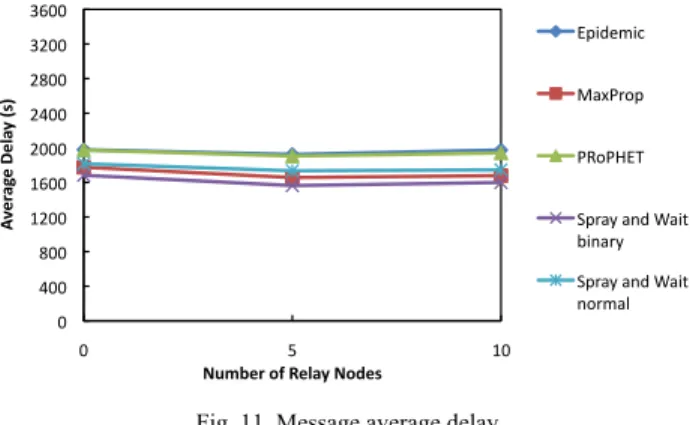
Fig. 11 illustrates the message average delay for the five protocols in the scenario under study, with 60 mobile nodes. As may be seen in the previous scenario, Epidemic and PRoPHET approximately maintain the same message average delay across the simulations. The other routing protocols also register a very slight decrease on the average delay.
!" #!!" $!!" %&!!" %'!!" &!!!" &#!!" &$!!" (&!!" ('!!" !" )" %!" !" #$ %& #'(#)% *'+,-' ./01#$'23'4#)%*'.25#,' *+,-./,0" 123456+" 47648*9" :+52;"2<-"=2,>" ?,<25;" :+52;"2<-"=2,>" <65/2@"
Fig. 11. Message average delay.
IV. CONCLUSIONS AND FUTURE WORK
This paper studied the performance impact (in terms of message delivery probability and average delay) of relay nodes on a VDTN applied to an urban scenario. It was assumed a cooperative opportunistic environment without knowledge of contact opportunities and traffic matrix. The motivation for this work comes from the idea that placing relay nodes at crossroads allows data deposit and pickup by passing mobile nodes, which will increase the delivered messages (probability) to the final destination.
Several experiments were conducted varying the number of mobile nodes, and deploying a different number of relay nodes in predefined map locations (over the considered scenario). It was observed that relay nodes significantly improve the message delivery probability on the routing protocols.
Our interests for future work are focused on the performance evaluation of VDTN architecture on isolated and dispersed regions without network infrastructure, studying the impact of node cooperation [19], geographical routing protocols [20], and the relay node placement problem.
ACKNOWLEDGMENTS
Part of this work has been supported by the Instituto de
Telecomunicações, Next Generation Networks and
Applications Group, Portugal, in the framework of the Project VDTN@Lab, and by the Euro-NF Network of Excellence of Seven Framework Programme of EU.
REFERENCES
[1] V. Cerf, S. Burleigh, A. Hooke, L. Torgerson, R. Durst, K. Scott, K. Fall, and H. Weiss, "Delay-Tolerant Networking Architecture," RFC
4838, April 2007, [Online]. Available:
ftp://ftp.rfc-editor.org/in-notes/rfc4838.txt.
[2] S. Burleigh, A. Hooke, L. Torgerson, K. Fall, V. Cerf, B. Durst, K. Scott, and H. Weiss, "Delay-Tolerant Networking: An Approach to Interplanetary Internet," in IEEE Communications Magazine, vol. 41, 2003, pp. 128-136.
[3] S. Jain, R. Shah, W. Brunette, G. Borriello, and S. Roy, "Exploiting Mobility for Energy Efficient Data Collection in Wireless Sensor Networks," ACM/Kluwer Mobile Networks and Applications (MONET), vol. 11, pp. 327-339, June 2006.
[4] J. Partan, J. Kurose, and B. N. Levine, "A Survey of Practical Issues in Underwater Networks," in 1st ACM International Workshop on
Underwater Networks, in conjunction with ACM MobiCom 2006, Los
Angeles, California, USA, Sep. 25, 2006, pp. 17 - 24.
[5] P. Juang, H. Oki, Y. Wang, M. Martonosi, L. S. Peh, and D. Rubenstein, "Energy-Efficient Computing for Wildlife Tracking: Design Tradeoffs and Early Experiences with ZebraNet," ACM SIGOPS Operating Systems Review, vol. 36, pp. 96 - 107, 2002.
[6] W. Zhao, M. Ammar, and E. Zegura, "A Message Ferrying Approach for Data Delivery in Sparse Mobile Ad Hoc Networks," in The Fifth
ACM International Symposium on Mobile Ad Hoc Networking and Computing (MobiHoc 2004), Roppongi Hills, Tokyo, Japan, May 24-26,
2004, pp. 187–198.
[7] A. Pentland, R. Fletcher, and A. Hasson, "DakNet: Rethinking Connectivity in Developing Nations," in IEEE Computer, vol. 37, 2004, pp. 78-83.
[8] W. Zhao, Y. Chen, M. Ammar, M. Corner, B. Levine, and E. Zegura, "Capacity Enhancement using Throwboxes in DTNs," in IEEE
International Conference on Mobile Adhoc and Sensor Systems (MASS) 2006, 2006.
[9] M. Ibrahim, A. A. Hanbali, and P. Nain, "Delay and Resource Analysis in MANETs in Presence of Throwboxes," Performance Evaluation, vol. 64, pp. 933-947, October 2007.
[10] F. Farahmand, A. N. Patel, J. P. Jue, V. G. Soares, and J. J. Rodrigues, "Vehicular Wireless Burst Switching Network: Enhancing Rural Connectivity," in The 3rd IEEE Workshop on Automotive Networking
and Applications (Autonet 2008), Co-located with IEEE GLOBECOM 2008, New Orleans, LA, USA, December 4, 2008.
[11] N. Banerjee, M. D. Corner, and B. N. Levine, "An Energy-Efficient Architecture for DTN Throwboxes," in INFOCOM 2007 - 26th IEEE
International Conference on Computer Communications, 2007, pp.
776-784.
[12] N. Banerjee, M. D. Corner, D. Towsley, and B. N. Levine, "Relays, Base Stations, and Meshes: Enhancing Mobile Networks with Infrastructure," in 14th ACM International Conference on Mobile
Computing and Networking (ACM MobiCom), San Francisco,
California, USA, September, 2008, pp. 81-91.
[13] A. Keränen, J. Ott, and T. Kärkkäinen, "The ONE Simulator for DTN Protocol Evaluation," in SIMUTools'09: 2nd International Conference
on Simulation Tools and Techniques, Rome, March 2-6, 2009.
[14] A. Vahdat and D. Becker, "Epidemic Routing for Partially-Connected Ad Hoc Networks," Duke University, Technical Report CS-2000-06, April, 2000.
[15] J. Burgess, B. Gallagher, D. Jensen, and B. Levine, "MaxProp: Routing for Vehicle-Based Disruption-Tolerant Networks," in INFOCOM 2006 -
The 25th IEEE International Conference on Computer Communications,
Barcelona, Catalunya, Spain, April 23-29, 2006, pp. 1-11.
[16] A. D. Anders Lindgren, "Probabilistic Routing Protocol for
Intermittently Connected Networks," draft-irtf-dtnrg-prophet-00,
February 2008, [Online]. Available:
http://tools.ietf.org/html/draft-irtf-dtnrg-prophet-00.html.
[17] T. Spyropoulos, K. Psounis, and C. S. Raghavendra, "Spray and Wait: An Efficient Routing Scheme for Intermittently Connected Mobile Networks," in ACM SIGCOMM 2005, August, 2005.
[18] Cisco Systems, Inc., "Capacity Coverage & Deployment Considerations
for IEEE 802.11g," [Online]. Available:
http://www.cisco.com/en/US/products/hw/wireless/ps4570/products_wh ite_paper09186a00801d61a3.shtml [Accessed: April, 2009].
[19] A. Panagakis, A. Vaios, and I. Stavrakakis, "On the Effects of Cooperation in DTNs," in COMSWARE, Bangalore, India, January 7-12, 2007.
[20] I. Leontiadis and C. Mascolo, "GeOpps: Geographical Opportunistic Routing for Vehicular Networks," in IEEE International Symposium on
a World of Wireless, Mobile and Multimedia Networks 2007 (WoWMoM 2007), Espoo, Finland, 18-21 June, 2007, pp. 1-6.