Generg
Which renewable technology for
the next decade
Eduardo Marta
Dissertation submitted in partial fulfillment of requirements for the degree of MSc in Business Administration, at the Universidade Católica Portuguesa, September 2014.
Abstract
Title: Generg – Which renewable technology for the next decade Author: Eduardo Marta
Generg, a Portuguese based company and a promoter of renewable energies, has been operating for over 25 years. During its first decade of activity, it started by exploring small hydric power plants, and then diversified into wind power. It subsequently expanded once more, in terms of employed technologies, with the construction of two solar power parks. Generg’s current portfolio comprises a total of 487.6 MW of clean power, distributed by 436.4 MW of wind capacity, 33.2 MW of hydro capacity and 18 MW of solar capacity. Nowadays, after several years without new investment, an opportunity to invest in a new renewable park appeared. The company holds a license to explore wind energy, with a total of 20 MW of power generation capacity, which can be converted to solar energy, due to the smaller environmental impact of this alter.
The present case analyzes the evolution of the company over time, as well as the strategy it followed. It also contemplates an overview of the renewable energy industry in Portugal and the global panorama.
The main objective of the case is to put the reader in the position of making a decision, concerning this new investment opportunity, contemplating immediate advantages, for both technologies, with long term concerns and expectations. Should Generg maintain the license for wind technology? Or should it converted it for solar?
Key words: renewable energy, electricity industry, regulated prices
Resumo
Título: Generg – A tecnologia renovável para a próxima década Autor: Eduardo Marta
A Generg, uma empresa portuguesa, promotora de energias renováveis, tem vindo a desenvolver a sua actividade há 25 anos. Começou com o desenvolvimento e exploração de centrais mini hídricas, durante a sua primeira década de actividade, passando então para a energia eólica. Expandiu, uma vez mais, o seu portfólio, com a construção de dois parques solares. O portfólio actual da Generg é de 487.6 MW de potência, distribuídos em 436.4 MW de potência eólica, 33.2 MW de potência hídrica e 18 MW de potência solar. Actualmente, e após vários anos sem investimentos, surgiu a oportunidade de financiar um novo parque renovável. A Generg tem uma licença de exploração em tecnologia eólica, num total de 20 MW de capacidade. Esta licença pode ser alterada para energia solar, uma vez que esta alternativa apresenta menor impacto ambiental.
O presente caso, analisa, de forma detalhada, a evolução da empresa ao longo do tempo, bem como a estratégia por ela seguida. Contemplando também uma analise à industria das energias renováveis nacional, assim como o panorama internacional.
O objectivo primordial do caso é colocar o leitor na posição de tomada de decisão sobre a nova oportunidade de investimento, contemplando tanto vantagens imediatas, como preocupações e expectativas futuras. Deve a Generg manter a licença de exploração eólia? Ou deve mudar para energia solar?
Palavras-‐chave: energia renovável, mercado eléctrico, preços regulados
Acknowledgements
During the preparation of the present Master dissertation there were some people who deeply contributed and constantly supported my work.
I would like to start by expressing my gratitude to my advisor João Simão Pires. His dedication, perspective and recommendations throughout the dissertation definitely increased the quality of my work.
I am also extremely grateful to three persons. To Luís Guimarães, a person who I know for a long time and always helped me when I needed. It was him who first introduced me to Generg. To Álvaro Brandão Pinto the current CEO of Generg, my sincere thanks for all the information and insights, about the company and the market. To Henrique Gomes, for its incredible knowledge about the market and guidance through the research.
To my friends and colleagues, with whom I shared my expectations and frustrations. Their support was vital for keeping me motivated, enthusiastic and focused on the final goal. Among them I want to express my special acknowledgement to Rita Martins.
Finally, I want to thank my family for the constant motivation, not only during the dissertation, but also during my entire life. Their love and unconditional support made the man I am today.
Table of Contents
Abstract ... ii
Resumo ... iii
Acknowledgements ... iv
List of Exhibits ... vi
List of Figures and Tables ... vii
Generg: Which renewable technology for the next decade ... 1
Introduction ... 1
Overview of the Renewable Energy Industry ... 1
Renewables in Portugal ... 3
ENEOP ... 5
The Price ... 6
Energetic Consumption ... 7
Generg’s strategy over time ... 8
Hydro ... 9
Wind ... 10
Solar ... 11
Conclusion ... 13
Exhibits ... 14
Literature Review ... 19
Generic frameworks ... 19
Specific literature ... 20
Case Analysis and Teaching Notes ... 23
1.
Introduction ... 23
2.
Case Summary ... 23
3.
Learning Objectives ... 23
4.
Suggested Assignment Questions ... 24
5.
Analysis ... 24
Bibliography ... 35
List of Exhibits
Exhibit 1 – Global Renewable Electricity Net Generation (GW)
Exhibit 2 – Global Non-‐Hydro Renewable Electricity Net Generation (GW)
Exhibit 3 – EU power mix 2000 and 2013 (GW)
Exhibit 4 – Consumption Diagram in Portugal, 9 April 2014
Exhibit 5 – Penetration of Renewable Energies, 2012
Exhibit 6 – Evolution of available power capacity, in MW
Exhibit 7 – ENEOP portfolio
Exhibit 8 – Generg consolidated profits and losses
Exhibit 9 – Generg portfolio
List of Figures and Tables
Figure 1 – Diagram of the electricity industry (Portuguese companies)
Figure 2 – Electricity production by source, 2013
Figure 3 – Production regimes
Figure 4 – Wind exposure curve
Figure 5 – Solar exposure curve
Table 1 – Production regimes
Table 2 – Price scheme for renewable technologies
Table 3 – Evolution of consumption (1000 TWh)
Generg: Which renewable technology for the next decade
Introduction
It has passed a long time since Generg, a Portuguese based company and a project promoter in the renewable energy industry, has seen its portfolio of projects increase. Since 2009, the group has not undertaken a single significant investment like it used to happen regularly before the economic and financial crisis that has impacted the Portuguese economy over the last few years. The deterioration of the financing conditions offered by commercial banks, deeply affected the company, as they were the main funding source. The banks were no longer in condition to finance new renewable power installation, which are characterized by significant upfront investments.
Now, after five years of near stagnation, Generg has finally a reliable opportunity to expand its portfolio. The company managed to raise the necessary funds for a new project with 20 MW of power generation capacity in Castelo Branco, in the center of Portugal. The renewable production license was initially obtained to explore wind power, but now the company is considering the possibility of changing it for solar power, since it presents a smaller environmental impact. With that in mind, the CEO organized a meeting with the board to examine both possibilities, evaluating immediate benefits and considering long-‐term concerns and expectations.
Overview of the Renewable Energy Industry
Electricity is a first need product and a commodity, which, in case of lacking, reduces dramatically the quality of live. It’s production through clean and renewable sources, which do not dilapidate natural resources, began more than a century ago. It started with hydroelectric plants, transforming water motion and gravity, into electricity. But only recently, did clean energies become a major concern for governments and society, mainly, but not exclusively, in developed countries [Exhibit 1]. Political leaders are worried about climate change, caused by an abusive use of natural resources, resulting in excessive CO2 emissions. Renewable energies, such as hydro, wind, solar or biomass, among others, have been one of the answers to the escalating problem of over usage of planet’s non-‐renewable resources and the excess production of pollution. Moreover, by investing in these virtually unlimited sources of energy, each country would be able to reduce its energy dependence on fossil fuels.
The European Union was the one first major economic region to take serious action towards a clean and more sustainable world [Exhibit 3]. Already in 2001 it introduced the Renewable Directive (2001/77/EC), which set a target, for the 15 EU members at the time, of 12% gross energy consumption from renewable sources, by 2010. More recently, in 2008, it approved an ambitious climate and energy program, known as the “20-‐20-‐20 initiative”. The targets are: 20% reduction of greenhouse gas emission from 1990 levels, 20% share of energy consumption from renewable resources and 20% improvement in EU’s energetic efficiency. All three targets should be met by 2020. With this initiative, the EU, as well as its member states, made a strong commitment to pursue and invest in eco friendly sources of energy. Alongside several incentives, like mandatory preference for renewable energy and financial subsidies to renewable projects, the Euro group introduced a system of CO2 tariffs to further stimulate the renewable industry. These measures changed substantially the energy policy, making increasingly less attractive producing energy through conventional plants, mainly thermal and nuclear power stations. Nowadays, Europe is the most important geographic area in the world in the renewable sector [Exhibit 2].
The renewable energy industry is characterize by the cutting edge technology it employees, as well as the massive infrastructure equipment it requires. For instance, the height of a wind turbine can achieve 100 meters, with blades over 60 meters. Solar parks need, on average, 5 hectares for each megawatt deployed. These types of equipment require an intensive need of capital, making financial institutions a crucial part in the industry dynamic.
Another challenge faced by this industry is the technical inability to store electricity and to stock the renewable resource itself, except for dams. Unfortunately, the current technology does not have an effective solution to store electricity. Batteries can only maintain a limited amount of energy, being far away from the storage capacity necessary to supply even a small city, in case of an interruption of natural resources. This leads to a back-‐up cost, which is the cost associated with an immediate need of electricity that has to be met with conventional processes. The back-‐up cost is the cost of having a fully functional thermal power plant, not working, waiting until is necessary to balance supply and demand.
As a consequence of not being stored, the consumption has to meet the production in real time. If the demand and production are unbalanced, the entire electric system can blackout, by an excess of demand, or there is waste of electricity, in case of excess of production. Most of the demand occurs during daylight, starting early in the morning, with the first demand peak when people wake-‐up and go to work. It is also when factories start operating. The second peak happens after lunchtime and
the third, and the biggest, occurs in the afternoon, when people go home to cook, watch TV, do the laundry, etc. During the night, when people are sleeping, with almost every electric device turned off and factories closed, the need for electricity decreases substantially [Exhibit 4].
Figure 1 – Diagram of the electricity industry (Portuguese companies)
Producers Distributors Retailers
Fossil Nuclear Renewable -‐ Hydro -‐ Wind -‐ Solar Regulator
The electricity industry, in which renewables are included as a producer, is highly regulated. The price that each producer sells electricity to the distributor depends on the technology used. It is more attractive for the renewable due to the positive externalities and to compensate the higher investment. The distributor is the responsible for the transportation and for the maintenance of the grid. The distributor provides the electricity to the retailer, which is the responsible to commercialize the electricity to the end user.
Renewables in Portugal
One of the countries that invested the most in alternative energy production has been Portugal. Behind the early investment is the huge potential in term of natural conditions that the country has. It has large windy areas throughout the country, a wide hydrographic network and one of the sunniest areas of all Europe, Alentejo. On top of that, Portugal has the third largest Economic Exclusive Zone (EEZ) of the European Union and the tenth in the World. This huge maritime resource will play an important role when offshore wind and wave power reach a more mature stage of
development. This investment may occurred to early, according to the ex-‐Secretary of State for the Energy, Henrique Gomes “We invested too much in a technology that, not only was not mature
enough, as it also was not developed nationally”.
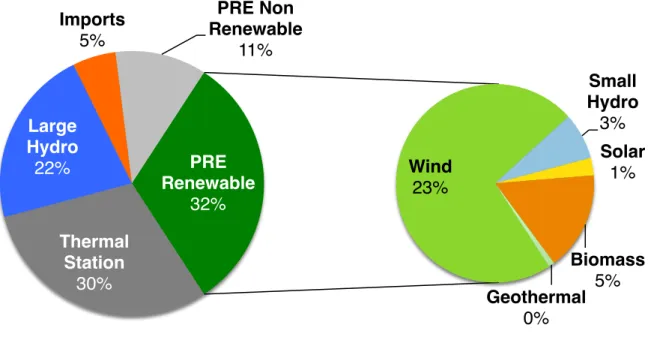
Figure 2 – Electricity production by source, 2013
Source – APREN – Associação de Energia Renováveis (Renewable Energy Association)
Matching the early investments with the great and diversified resource portfolio has allowed to become one of leading countries in the renewable industry, with one of the highest percentage of renewable energy in the consumption mix [Exhibit 5] and also with one of the highest levels of renewable production per capita. From all the natural resources, the one that registered the superior growth in terms of installed capacity has been the wind. It flourished from 1,236 MW in 2005 to 4,726 MW in 2013. Considering the evolution in new licenses, the wind power was the second higher, only behind big hydro power plants [Exhibit 6].
This enormous progress in the renewable energy industry came to an end in Portugal mainly for two reasons, lack of new licenses and higher financing costs. The first is a consequence of a new national energy policy. Since 2012, new licenses do not benefit from regulated prices. Companies that want to produce electricity, from renewable resources, with a license acquired after the new law are now subject to market prices. Even though the adversity presented by the new policy, licenses obtained
Thermal
Station!
30%!
Large
Hydro!
22%!
Imports!
5%!
PRE Non
Renewable!
11%!
Wind!
23%!
Small
Hydro!
3%!
Solar!
1%!
Biomass!
5%!
Geothermal!
0%!
PRE
Renewable!
32%!
before the 2012 policy, still enjoy price benefits if the development process still is in the defined timeframe. The second reason is consequence of the financial and economic crisis, which affected the access to capital, increasing the associated cost.
Prior to 2012, a company in the renewable energy industry, to expand the portfolio had two major options, it could either take the initiative and request to develop and explore a renewable park, or it could wait and bid in public tender created by the government. Either ways, the company would always benefit from incentives.
There are companies across several industries exploring renewable parks in Portugal, like Generg, Iberwind, EDP Renewable, a subsidiary of EDP, the biggest electricity company in Portugal. As it used to be state owned and due its dimension, EDP is the responsible to operate big hydro power plant, being, therefore, responsible for the largest share of renewable energy produced nationally. But there also companies like Galp, which has its core business in the petroleum industry or Martifer, which operates in the construction industry. All of them can apply for a license or compete in public tender.
Whoever wins a license of exploration guarantees a pre-‐establish power generation capacity at a taken price, to deploy and operate the infrastructure. But new licenses can differ a lot and do not always have to have one a single winning company. When the amount of power generation capacity is not extensive, the entire capacity is attributed to a single company. There are cases, mainly in public tenders, where there is so much power at stake that companies unite to form an alliance to beat the competition. In Portugal, the Government launched two major tenders, for wind energy, in 2005-‐2006, one for a total power of 1,200 MW and other for 400 MW. The first one was won by ENEOP, a consortium created specifically for the tender. VentiVeste, another consortium, won the second.
ENEOP
ENEOP is a consortium especially created to bid for the largest of these public tenders, made by the Portuguese Government, for exploration of renewable energies. Generg was part of this consortium, with an investment of 20% of the total capital. EDP Renewable and ENEL, an energy company from Italy provided equally the remaining capital, 40% each. By the end of 2012, ENEOP had managed to build almost 1,000 MW, being responsible for 21% of the entire installed wind power capacity in Portugal [Exhibit 7].
With the creation of ENEOP an important step was made towards the development of Portugal in term of technology capacity. Enercon, a German based company, the second biggest company operating in the wind industry as a technologic supplier, created an investigation campus in the North of Portugal. Viana do Castelo has been widely known for being a region skilled in metallurgic quality and innovation. It was there that, with Enercon technology, all the materials needed for the wind turbines of ENOP were built. With ENEOP and with the creation of this campus, the Portuguese government addressed the national problem of technology dependence from foreign companies, using the expertise not only to supply another national projects, but also to export.
The objectives behind ENEOP, set by the Government, were an excellent reflection of the ambitions for the future renewable power capacity as well as for the independence in terms of technology. Unfortunately, VentiVeste, a consortium led by Galp, did not copy the success obtained by ENEOP. In 2012, after several years since the approval of the tender, VentiVeste had not even reached 10% of the total power capacity that was adjudicated.
The Price
Production of energy in Portugal is divided in two main categories; Special Regime Production (PRE) and Ordinary Regime Production (PRO).
Table 1 – Production regimes
Renewable Not Renewable
PRE
Small Hydro Waves
Cogeneration
Wind Biomass
Solar Biogas
Geothermal MSW
PRO Large Hydro Thermal Gas
Coal
The Ordinary Regime comprises thermal power and the large dimension hydro stations. The thermal power consists in energy from fossils resources, mainly in coal and natural gas, for the Portuguese case. For the thermal energy there is also a subdivision; Acquisition Energy Contracts (CAE) and Cost of Maintenance of Contracts Equilibrium (CMEC).
Every single type of energy enumerated previously has a different price, defined by the Government. The price utilized for the PREs is set to be attractive for the companies to produce clean energy, to cover high production costs, resulting from infrastructure and technology investments.
Table 2 – Price scheme for renewable technologies
Decree-Law nº 225/2007, 31 of May
Technology Average Tariffs (€/MWh) Coefficient Z
Wind 74-75 4.6 Hydro < 10 MW 75-77 4.5 Solar PV > 5 kW Solar PV <= 5 kW 310-317 450 35 52 Biomass forest Biomass animal 107-109 102-104 8.2 7.5 Waves < 4 MW 260 28.4
Decree-Law nº 132-a/2010, 21 of December
Technology Average Tariffs (€/MWh) Coefficient Z Solar PV 257 27.2 Decree-Law nº 126/2010, 23 of November Technology Average Tariffs (€/MWh) Coefficient Z Hydro < 10 MW 91 - 95 6.6
Source – DGEG – Direção-‐Geral de Energia e Geologia ( Directore-‐General of Energy and Geology)
As a consequence of having an instable production, consequence of the volatile availability of resources, the back-‐up cost appears as the major negative externality for the renewable energy. This is the additional cost of having thermal power stations available, and most important, ready to work, without producing, whenever renewable resources cannot generate the amount of electricity needed. It is most likely that this back-‐up power necessity occurs during peak hours, but it can also happen at any time of the day.
Energetic Consumption
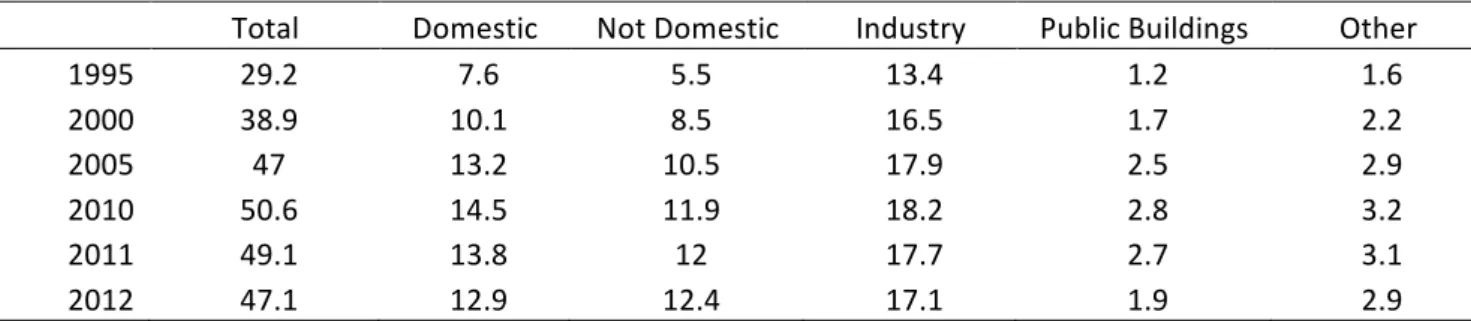
Being energy the fuel of economic process and growth it is not strange to observe that the overall consumption in Portugal, as well as in Europe, decreased in the past years. This reduction in the consumption is a direct consequence of the crisis, being more noticeable, in the Portuguese case, after the memorandum of understanding with Troika. Government buildings, alone, reduced, from 2010 to 2012, almost 1 Terawatt/hour of electric consumption, representing a decrease of more than 30%.
However, in 2014, the economical indicators point in the direction of the end of the crisis, with a generalized growth in consumption and spending, an overall increase in the industrial activity.
Table 3 – Evolution of consumption (1000 TWh)
Total Domestic Not Domestic Industry Public Buildings Other 1995 29.2 7.6 5.5 13.4 1.2 1.6 2000 38.9 10.1 8.5 16.5 1.7 2.2 2005 47 13.2 10.5 17.9 2.5 2.9 2010 50.6 14.5 11.9 18.2 2.8 3.2 2011 49.1 13.8 12 17.7 2.7 3.1 2012 47.1 12.9 12.4 17.1 1.9 2.9 Source – Pordata
Moreover is important to notice that electric cars are becoming more popular as they register better performances and becoming more accessible, monetarily. The massification of electric cars would disrupt the current pattern of consumption. The night electric needs would boost, as it would be the preferable time to recharge the batteries. It would also decrease substantially the fuel dependence.
Generg’s strategy over time
Generg as is known today, was founded in 1988, after the privatization of a state owned company held by IPE. Before the privatization, the core activities developed by Generg were essentially dedicated to obtain license to explore small hydro station. It had two major investor, the majority of the capital belonged to the Portuguese Government, the remaining part to a Belgium energy group. After the privatization, the foreign group had the opportunity to buy the majority, but did not use it. Instead a Portuguese fund, Lusenerg, bought the government share, being until now 53%-‐47%. Lusenerg belongs to Novenergia, a European investment fund, created initially in Portugal, holding energy companies in several countries throughout Europe, from Spain and France, to Poland and Romania. Meanwhile, GDF-‐Suez, a French electric company and one of the largest producer of electricity in the world, bought the Belgium group1. After the privatization, Generg finally put to use all the work that had developed so far, initiating the construction of its first renewable facility.
The mentor of this strategic change was João Bártolo the CEO at the time. His perspective on sustainability, the impact of human activity in the world and its resources and for generations to come, was the driver that pushed the company towards a more proactive attitude. Being a man from the Beiras region, the center of Portugal, it is not strange to observe that the majority of the company’s portfolio is distributed in that area [Exhibit 9].
1 GDF-‐Suez sold, in the beginning of 2014, its shares to a Japanese based company to Marubeni. GDF-‐Suez are still co-‐
In 25 years of activity, Generg went from a small company, to a well-‐structured group. During the second decade of activity, the company had to restructured itself to better face the upcoming challenges. The group had, in its pipeline of projects, major developments that required intensive capital. To overcome this problem, Generg, as every company in the industry, resorted to a financial mechanism called “Project Finance”. This financial instrument isolates the risk of a specific project from the company’s risk, being the finance paid through the cash flows of the project. With the creation of new companies to administrate each project, Generg became a group holding several companies.
Hydro
The group started the exploration of clean energy by building mini hydro plants, transforming water motion into electricity. These mini hydro stations use the power of rivers’ currents. This system is very different form the usual dams and reservoirs, mainly in the power capacity and ability to hold inventories of resources and power capacity. A reservoir, an artificial lake, can be used to control the level of water, by opening or closing the dam. This control over the amount of resources is particularly important to avoid the fluctuations of production, avoiding production in excess and reducing the back-‐up cost. But dams and reservoirs are always huge infrastructure with astronomic investments and a lot of location constrains. These two factors are much more favorable for the mini hydro stations. Being a derivative of a mature technology, mini hydro stations proliferated while other technologies, like the wind, were still in a developing stage.
For a small and recent company it would be impossible to invest in such a complex and demanding project like a dam. So, the first decade of Generg was characterized by the investment exclusively dedicated to mini hydro power stations. In that period, the company managed to build a portfolio of nine facilities producing 33,2 MW. These nine facilities were built in the north of Portugal, were the river’s network is more intense and where the hydraulicity and precipitation are more advantageous. The total power capacity, in this type of installations, has not changed since 2000, with the construction of the hydroelectric plant of Manteigas. Since then, the company has been managing the operations of the plants, assuring the maximum efficiency of the available power production. In 2013, Generg achieved 107,5 GWh, avoiding 43,000 tons of CO2. This value of production has varied along the years, being the main reason the Mediterranean climate that characterizes Portugal, being subject to drought periods, but also to heavily rainy periods.
After ten year of existence, already with some knowledge of the renewable market, new technologies appeared, with a lot of potential and a possibility to diversify the portfolio, reducing the fluctuation in production. Wind was the response gave by Generg for the upcoming decade.
Wind
The decision to start exploring this new resource, with all the money, expertise and technology that it requires, was a long-‐term call. Between hydric and wind production there were not any technologic similarity. The company had to restructure itself to better face the upcoming financial and skill based challenges, creating subsidiaries companies to run the different projects
Although Generg only had its first wind farm operational in 2003, the preparation to explore a resource that has a global potential five times superior than the global demand, had started much before. First of all, it was necessary to obtain the license to build the wind farm. And before getting the license, the company must locate areas with wind potential, with the smaller environmental impact as possible. Then it has to do wind measurements, to confirm the truth potential of the area. Finally it has to design the integral project to be submitted for approval.
The approval is the first crucial moment in the process of building a wind farm. Only after getting the license, the company is authorized to explore and start the construction. Every MW of renewable electric power has an enormous cost. Even after all the time the technology has to prosper, to construct a new MW still requires deep pockets. A MW of wind power, currently cost around 1.5 M€ to build. This is why Project Finance mechanism was crucial to meet the necessities of very large wind farms, with more than 100 MW of installed capacity.
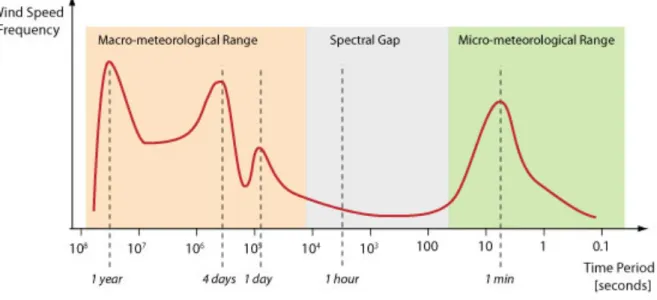
The potential of each wind farm must be coherent with the region potential. Big wind mils do not produce more energy unless there is enough wind to make it work. The pattern of the wind over the year, as well as over a single day, can fluctuate considerable, being very difficult to predict its availability. For the center region of the country, where Generg has the exploration license the average amount of wind exposure is 2295 hours/year, with a standard deviation of 131 hours2.
Figure 3 – Wind exposure curve
Source – Green Rhino Energy
Currently, wind is the resource that Generg is using the most. It counts with 436,4 MW, belonging totally to the group. On top of that, it has 20% of the production of ENEOP, which was 946 MW at the end of 2012.
Solar
Generg since 2008 started to explore the most abundant source of energy in the planet, the sun. The potential generation of global solar resources over land is more than 100 times the global demand for electricity. Although behind in performance level, the technology, comparing with other alternatives, began to show a bright future. Aware of this technology outlook, Generg began to build the first solar plant, just before the big economic and financial crisis. Since then, the group could only increase the solar portfolio by 6 MW, in 2011, to a total of 18MW.
Regarding the techniques to explore the sun power there are two main types, the Concentrated Solar Power (CSP) and Solar Photovoltaic Power (Solar PV). The first produces heat, which generates electricity via turbine. The second converts directly the solar radiation into electricity through photo-‐ effect. Also for the second technology there are two variants, either fixed or movable solar panels. The first type is mounted in the optimal position for the specific region. Tracking devices, which move over on axis can be horizontal or vertical axis tracker. The horizontal rotation allows the panels to track from north to south, from winter to summer. The vertical rotation makes the panels do
earth’s opposite rotation movement, tracking the sun from the east to the west. There are also solar panels with two tracking axis, which can track both daylight and seasonal differences. The prices that used to be more 6 M€ per MW (the first solar park with 12 MW of power capacity cost 50 M€) are now around 1M€ for the fixed panels and 1.3 M€ and 1.4M€ for one and two movable axis panels, respectively. As the cost is reducing, so does the financial incentive. The price for solar energy until 2010 was at least 310€ per MWh, now it is 257€. With performance level registering higher and higher values, it is expected that the support offered by the government follow the opposite direction, reducing the incentives for the renewable promoters.
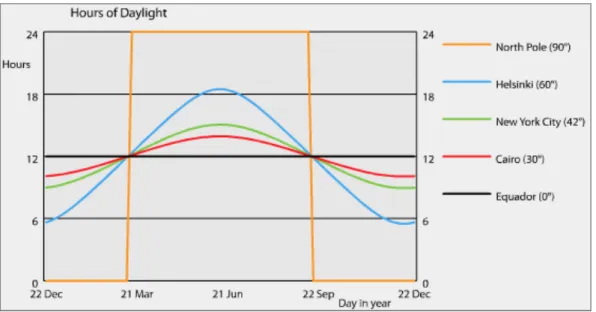
For the region of Castelo Branco, the average solar exposure of 1738 hour/year, with a standard deviation of only 60 hours3. The two-‐axis type of solar panels can absorb almost the entire irradiation, achieving more than 95%, while with only one tracking axis, from east to west, it can canalize almost 90%. With fixed solar panel, the amount of solar radiation utilized reduces to 75%.
Figure 4 – Solar exposure curve
Source -‐ Green Rhino Energy
Although the solar power has less resource exposure than wind, sun is more predictable, both short-‐ term and long term. It is easy to predict, to the minute, the time of the day when the sun comes up and goes down. It is also the resource that presents fewer variations from the normal year.
Conclusion
Generg, at this point faces a dilemma for the construction of the next renewable park. But the CEO knows that this choice has deeper repercussions than the profitability of the project itself. Considering the crisis that Portugal faces and subsequent reduction in electricity demand, alongside with new energy policy that cuts in the political support for renewable developers, the opportunities to grow nationally have shrank. If Generg wants to diversify its portfolio, it has to do it internationally.
The management team believes that the technological choice for the new renewable park will influence the ability for a potential international expansion. Maintaining the initial license plan and stick with wind technology, Generg will strengthen its main renewable focus, suggesting that solar technology is not yet ready. By opting for a solar technology, the investment would be consistent with the last two, reinforce the change in Generg’s focus, implying that this is the renewable technology for next years.
The answer Generg is looking for is which of these two technologies conjugates better the immediate profitability with long-‐term concerns and expectations.
Exhibits
Exhibit 1 – Global Renewable Electricity Net Generation (GW)
Source – EIA (US Energy Information Administration)
Exhibit 2 – Global Non-‐Hydro Renewable Electricity Net Generation (GW)
Source – EIA 0! 1000! 2000! 3000! 4000! 5000! 0! 500! 1000! 1500! 2000! 2500! 2004! 2005! 2006! 2007! 2008! 2009! 2010! 2011!
America! Europe! Asia! Africa! Oceania! World!
0! 200! 400! 600! 800! 1000! 0! 100! 200! 300! 400! 500! 2004! 2005! 2006! 2007! 2008! 2009! 2010! 2011!
Exhibit 2 – EU power mix 2000 and 2012 (GW)
Source – EWEA (European Wind Energy Association)
Exhibit 4 – Consumption Diagram in Portugal, 9 April 2014 (Wednesday)
Source – REN 0! 1000! 2000! 3000! 4000! 5000! 6000! 7000! 0! 1000! 2000! 3000! 4000! 5000! 6000! 7000! MW ! Hours! Imports! Coal! Cogeneration! Small Hydro! Solar! Wind! Large Hydro! Consuption!
Exhibit 5 – Penetration of Renewable Energies, 2012
%
TWh
RE (w/hydro)
RE
Total Generation
RE (w/hydro)
RE
Iceland
100.0%
26.4%
16.9
16.9
4.5
Norway
97.0%
1.4%
125.2
121.4
1.8
Denmark
44.9%
44.9%
34
15.3
15.3
Portugal
37.2%
25.3%
52.2
19.4
13.2
Italy
32.3%
17.1%
284.8
92.0
48.7
Spain
30.3%
22.3%
292.5
88.6
65.2
Germany
22.1%
19.0%
575.6
127.2
109.4
France
16.4%
4.6%
541.4
88.8
24.9
USA
12.7%
4.9%
4 078.5
518.0
199.8
RE: Wind, solar, biomass and geothermal
Note: countries with high percentage of hydroelectricity can lead to great variation in the overall percentage
Source – Reneweconomy
Exhibit 6 – Evolution of available power capacity, in MW
Technology
1990
1995
2000
2005
2010
2013
Large Hydro
3 414.5
4 147.5
4 147.5
4 602.3
4 602.3
5 299.3
Small Hydro
95.6
259.6
317.8
360.7
443.6
450.9
Biomass
70
100
119
351.9
452.9
453.2
Geothermal
13
13
13
23
23
Wind
110.1
1 236.5
4 304
4 726.2
MSW
79.6
87.6
87.6
87.6
Biogas
10.7
29.7
52.2
Waves
0.4
0.4
0.7
Solar PV
108.9
140.6
Total
3 580.1
4 520.1
4 787.0
6 663.1
10 052.4
11 233.7
Source – DGEGExhibit 7 – ENEOP portfolio 2012
Source – Generg
Exhibit 8 – Generg consolidated profits and losses
2011
2012
Revenues
129 998 523
149 843 362
Ext. Supply and Services
20 261 232
22 442 672
EBITDA
108 010 182
126 123 322
Depreciations
49 297 478
48 472 106
EBIT
58 712 704
77 651 216
Cost of finance
34 732 573
33 370 329
Profits
19 925 341
34 052 508
Exhibit 3 – Generg portfolio 2012
Literature Review
Generic frameworks
In the literature, there are useful framework to better understand the industry and the business. For the present analysis, three distinct frameworks were considered.
5 Forces
The renewable energy is a totally different business sector from the traditional ones. It is imperative to comprehend how the market works, the main constrains and what makes it different from the others. To analyze it, the Michael Porter’s 5 Forces framework is a useful tool.
According to Porter, “the collective strength of these forces determines the ultimate profit potential in the industry”. To reach the collective and overall attractiveness of the industry lets determine the factors that influence each one of the forces.
PESTLE
The PESTLE analysis was first developed to understand the magnitude of external factor had in a determinate business industry. The framework has been updated to consider more dimensions and to be more specific on the influence of that exogenous factors have in the industry. The dimensions comprehended are: Political, Economic, Social, Technological, Legal and Environmental.
From these dimensions, there are three that which have a greater influence on the renewable energy industry:
• Political – the industry is more or less influenced by a government according with its power to apply tax and/or fiscal policies, trade tariffs, regulated prices, etc.
• Technological – this refers to the how operations and efficiency are influenced by factor such as levels of automation, costs of research and development and technological awareness. • Environmental – this dimension of the analysis is crucial for industry linked with natural
resources. Factors like climate, weather and geographic location and constrains influence a lot the industry potential.
BCG
The matrix developed by BCG (Boston Consulting Group) is an investment matrix, and therefor a helpful framework to analyze the dilemma presented in the case. One of the inventors of the BCG
matrix, and also the founder of the company, Bruce Dooling Henderson, stated: “To be successful, a company should have a portfolio of products with different growth rates and different market shares. The portfolio composition is a function of the balance between cash flows". The matrix, presented below, is a two-‐by-‐two matrix that relates relative market share with market growth. The matrix divides the market in four very different situations, involving distinct strategies and approaches. According to the position in which a product or service is in, the profitability and the expected cash-‐flows are totally different, being the Star the most attractive position to be. But the location of a product within in the matrix is most likely to change. By crossing the BCG matrix with the Life-‐Cycle Product It is possible to have a general idea of how a successful product evolves over time.
Specific literature
S-Curve
In every industry highly dependent on innovation, from time to time, there is a new technology that overcomes the dominant one in terms of performance. In 1986, Foster developed the S-‐Curve, or lifecycle model, relating performance and R&D time/effort. “The basic idea is that any technology with commercial potential passes through a lifecycle. During the early stages of the commercialization process, progress is slow as fundamental technical issues are addressed. The rate of progress increases, as these issues are resolved. As the technology ages, performance approaches upper limits” Callahan (2007). The pattern of performance over time has a shape of an S, as shown
in the figure bellow. This tool is particularly important to determine the current stage of performance for certain technology, as well as to access to future potential.
Renewable energy potential
The renewable energy industry is very distinct from a conventional one. On top of that, inside the renewable industry, there are significant differences. From the wide range of natural resources, none of them have the same pattern of consumption. The available technology is in different stages of maturity. Natural barriers also influence the potential, and those differ greatly from region to region. About the potential of renewable energies, Krewitt et al. (2008) defined the following potential:
Theoretical potential: The theoretical potential is derived from natural and climatic parameters (e.g.,
total solar irradiation on a continent’s surface). The theoretical potential can be quantified with a reasonable accuracy, but the information is of little relevance. The theoretical potential of renewable energy sources is huge compared to global energy demand, and there are various constraints in exploiting the theoretical potential.
Technical potential: The technical potential takes into account geographical restrictions (e.g., land
use cover that reduces the theoretical potential) as well as technical and structural constraints. Due to technical progress of energy conversion technologies, the technical potential may change over time.
Economic potential: The economic potential is the technical potential that can be exploited at