i Setembro, 2018
Marta Vidal Pereira
Bachelor in Micro and Nanotechnologies Engineering
Fabrication of 3D electrodes for
biosensor applications
Dissertation submitted in partial fulfillment of the requirements for the degree of Masters in Micro and Nanotechnologies Engineering
Advisor: Prof. Drª Elvira Fortunato, Full Professor, Faculdade de Ciências e Tecnologias, Universidade Nova de Lisboa
iii Fabrication of 3D electrodes for biosensor applications
Copyright © Marta Vidal Pereira, Faculdade de Ciências e Tecnologia, Universidade Nova de Lisboa, 2018.
v
“What you think, you become. What you feel, you attract.
vii
Acknowledgements
É com um grande sentimento de satisfação e realização que entrego este trabalho. Estes últimos meses, embora complicados, foram os mais importantes do meu percurso académico. E como um per-curso destes não se consegue fazer sozinho, não quero deixar de agradecer a todos os que direta ou indiretamente me acompanharam.
Em primeiro lugar, quero agradecer à minha orientadora, professora Elvira Fortunato, por todas as oportunidades que me proporcionou durante o curso e durante a tese, por ter aberto esta ligação entre o CENIMAT e o Biomark e por se ter sempre revelado disponível e interessada no meu trabalho. Também agradeço à minha co-orientadora, a professora Goreti Sales, por me ter aceite no seu centro de investi-gação, ter feito com que a participação no projeto europeu IBEROS fosse possível e a cima de tudo, por ter acreditado no meu trabalho e ter sempre uma palavra amiga a dizer.
Também agradeço ao professor Rodrigo Martins, por em conjunto com a professora Elvira Fortunato
terem fundado este curso e abrirem as portas para sermos os “Engenheiros do Futuro”.
À Carolina Marques, quero agradecer-te por me teres aturado nestes últimos meses e por teres sido minha amiga, mesmo quando eu não acreditava que era possível escrever esta tese. Obrigada por me teres acompanhado e teres sempre uma solução para me dar.
À Felismina Moreira, por ter sido a minha responsável no Biomark, por me ter dado todo o apoio possível e por ter tido paciência comigo, mesmo quando eu não percebia nada de AutoLab e eletroquí-mica. Muito obrigada por tudo o que me ensinaste.
A toda a equipa do CENIMAT e do Biomark, por terem estado sempre disponíveis para mim, à Sónia Pereira e Alexandra Gonçalves por aturarem os meus pedidos de última hora, à Ana Rita Cardoso e Daniela Oliveira por se terem tornado minhas amigas e me fazerem sentir em casa, mesmo a 350 km de casa.
Aos meus amigos da faculdade, obrigada por tornarem toda esta experiência mais suportável e por me terem feito gostar de cerveja. Aos meus coleguinhas de grupo favoritos, André Moura e Miguel Pinheiro, adoro-vos para sempre e obrigada por tudo. À minha família de praxe linda e disfuncional. Aos meus afilhados perfeitos: Maria Duarte, Bernardo Caetano, Francisca Tavares e Mariana Rodrigues e a todos os outros que estiveram sempre lá: Manuel Matos, Dmytro, Gui, Inês Tavares, Glória, Carolina, Catarina, Nuno. Foram das melhores coisas que a faculdade me deu e vocês sabem disso! Um obrigada especial às minhas amiguinhas, Maria Duarte e Francisca Tavares por todas as experiencias e momentos
e à Mariana Rodrigues e Mariana Cortinhal por todo o “Mandatory Hate”.
Sem esquecer claro dos meus amigos de Lisboa, que estão cá desde sempre, obrigada por todos os cafés, por me manterem sempre a ser eu e por não me terem esquecido mesmo quando não fui para o
Técnico e vim para “Marrocos”, Joana, André, Rafa, Pedro, Iko, Russo, Reis, Duarte e Sérgio adoro-vos.
Aos meus gordos do cinema, Leonor, Bia, Chico e Bruno, obrigada por serem os melhores amigos que podia ter encontrado a 50km de casa. Há coisas que não se conseguem explicar e vocês são uma delas, por todas as viagens inesperadas e kilos de pipocas, um obrigada enorme.
Nada disto seria possível sem as pessoas a quem devo literalmente tudo, os meus pais. Obrigada pela
confiança enorme que têm em mim, por me terem ajudado e por serem os melhores “role-models” de
sempre. Um obrigada enorme à minha irmã, por às vezes ser a irmã mais velha e por me fazer sentir a melhor pessoa do mundo. Quero também agradecer e dedicar a minha tese aos meus avós, aos quatro, por mesmo não conseguindo acertar com o nome do meu curso, terem um orgulho enorme em mim e nunca me deixarem ir abaixo.
ix
Resumo
A doença de Alzheimer é uma das formas mais comuns de demência, que afeta milhões de pessoas em todo o mundo. Esta doença embora incurável, carece de uma forma fácil e eficaz de diagnóstico.
Esta dissertação tem, por isso, como objetivo desenvolver um biossensor eletroquímico para a dete-ção precoce da doença de Alzheimer, através do reconhecimento de um biomarcador associado a dife-renças visíveis no tecido cerebral e responsável pela criação de placas, o peptídeo Aβ-42.
Os sensores criados foram construídos com uma abordagem bottom-up, usando papel como subs-trato, uma vez que este material é um dos mais promissores na indústria da eletrónica flexível, por ser ecológico, barato, abundante, oferecer processos de construção biocompatíveis, fáceis e rápidos.
Os biossensores baseiam-se em elétrodos de carbono impressos, aliados a técnicas de laser. O circuito elétrico é composto por uma tinta condutora de carbono ou lápis 9B, impressa ou pintada num substrato de papel. O reconhecimento é feito por um polímero de impressão molecular que foi criado na superfície do elétrodo por eletropolimerização. Para este efeito, usou-se uma mistura de biomarcador alvo (Aβ-42) e monómero (O-Fenilenodiamina) e aplicou-se uma gama de potencial adequada para formação de um polímero condutor com zonas de reconhecimento por afinidade para o biomarcador escolhido. Vários parâmetros de eletropolimerização foram otimizados antes da construção dos dispositivos finais através da impressão do péptido, crescendo o polímero em volta do péptido Aβ-42 e removendo-o mais tarde, usando incubações com uma enzima e ácido adequados.
O desempenho do biossensor foi avaliado por técnicas eletroanalíticas. A resposta do biossensor foi estudada entre 0,1 ng/mL e 1 µg/mL de Aβ-42, em PBS buffer e Cormay serum. A reposta obtida indicou uma resposta analítica controlada dentro dos parâmetros fisiológicos desejados, considerando que um indivíduo saudável apresenta valores próximos a 23,3 pg/mL.
O biossensor apresentado oferece inúmeros benefícios, como o seu baixo custo de produção, a pos-sibilidade de reutilização, eleva reprodutibilidade e resposta rápida, características que podem ter um forte impacto na deteção da doença de Alzheimer.
xi
Abstract
Alzheimer’s Disease is one of the most common forms of dementia, affecting millions of people
worldwide. Although incurable, an easy and effective form of diagnosis is still missing.
Thus, this work aims to develop an electrochemical biosensor for the early detection of Alzheimer's disease, by recognizing the peptide Aβ-42, a biomarker associated with visible differences in the brain tissue and responsible for the formation of senile plaques.
The intended sensing devices use a bottom-up designing approach, having paper as substrate. Paper is one of the most promising materials in the current flexible electronics industry, for being eco-friendly, cheap, abundant and offering biocompatible, easy and fast construction procedures.
The biosensors produced herein use pencil and printed carbon electrodes, allied with laser writing techniques. The electrical circuits are designed either on a conductive carbon ink or a 9B pencil tracks, printed or draw directly on the substrate.
The recognition is done by a molecularly imprinted polymer, created on the electrode’s surface by
electropolymerizing a mixture of the analyte (Aβ-42) and a monomer (O-Phenylenediamine). This pro-cess forms a conductive polymer with recognition sites displaying affinity for the selected biomarker. The parameters involved in the electropolymerization were optimized, by imprinting the peptide on the sensing layer, growing the polymer around the Aβ-42 peptide and removing it later by incubating in suitable enzyme and acid solutions. The performance of the biosensor was evaluated by electroanalytical techniques.
The analytical features of the biosensor were further evaluated by electroanalytical techniques. For this purpose, the analytical response was tested with standard solutions ranging from 0.1 ng/mL to 1µg/mL of Aβ-42 in PBS buffer and Cormay Serum. The response was found of analytical interest,
considering that healthy individuals show normal values of ~23.3 pg/mL.
Overall, the developed biosensor offered numerous benefits, such as being a low cost, having reusa-bility features, with a reproducible and fast response, which may have a strong impact in the early de-tection of Alzheimer disease.
xiii
CONTENTS
MOTIVATION AND OBJECTIVES ... 2
1) INTRODUCTION ... 4
1.1) ALZHEIMER DISEASE ... 4
1.2) BIOSENSORS ... 4
1.2.1) ELECTROCHEMICAL BIOSENSOR ... 5
1.3) MOLECULARLY IMPRINTED POLYMER... 6
1.4) PAPER ELECTRONICS AND CARBON ELECTRODES ... 6
1.5) LASER DIRECT WRITING ... 7
2) MATERIALS AND METHODS ... 8
2.1.1) PENCIL ELECTRODES ... 8
2.1.2) CARBON INK ELECTRODES ... 9
2.1.3) CHARACTERIZATION OF THE HOME-MADE ELECTRODES ... 9
2.2) ELECTROCHEMICAL SENSOR... 9
2.2.1) APPARATUS ... 9
2.2.2) MATERIALS AND REAGENTS ... 10
2.2.3) SOLUTIONS ... 10
2.2.4) ANALYTICAL PROCEDURES ... 11
2.2.4.1) Carbon Ink Chips... 11
2.2.4.2) Pencil Chips ... 11
2.2.5) CHARACTERIZATION OF THE SENSORS ... 11
3) RESULTS AND DISCUSSION ... 13
3.1) PAPER CHARACTERIZATION ... 13
3.2) CARBON-BASED ELECTRODES CHARACTERIZATION ... 14
3.2.1) PENCIL CHARACTERIZATION ... 14
3.2.2) IDENTIFICATION OF LASER PARAMETERS ... 15
3.2.3) SEMCHARACTERIZATION ... 17
3.2.4) EDSCHARACTERIZATION ... 18
3.2.5) RAMAN SPECTROSCOPY ... 19
3.2.6) XRDCHARACTERIZATION ... 19
3.2.7) XPSCHARACTERIZATION ... 20
3.3) ELECTROCHEMICAL CHARACTERIZATION ... 21
3.3.1) PENCIL ... 21
3.3.1.1) Electrochemical study ... 22
3.3.2) CARBON INK... 24
3.3.2.1) Pre-treatment ... 24
3.3.2.1) MIP/NIP Fabrication ... 25
3.3.2.2) Analytical Performance of the Biosensor ... 27
3.3.2.3) Qualitative Analysis ... 28
xiv
REFERENCES ... 36
SUPPORTING INFORMATION ... 40
ANNEX A – EXPERIMENTAL SETUP ... 40
ANNEX B – SHEET RESISTANCE ACCORDING TO TYPE OF PENCIL AND AMOUNT OF LAYERS... 40
ANNEX C – LASER EFFECT ON PENCIL 9B WITH DIFFERENT PAPER SUBSTRATES ... 41
ANNEX D – CI-HME ... 41
ANNEX E – EDS MAPPINGS ... 42
ANNEX F – XPS... 43
ANNEX G – NACL STUDIES ... 43
xv
List of figures
FIGURE 1.1-MIP PRODUCTION STEPS. OPDA IS THE MONOMER USED HEREIN AND AB42 THE TARGET BIOMARKER. ... 6 FIGURE 2.1-(A)STUDY OF PENCILS AND TYPE OF PAPER, EFFECTS OF LASER IN DIFFERENT LAYERS.(B)ADOBE ILLUSTRATOR DESIGN ... 8 FIGURE 3.1-SEM IMAGES TOP VIEW OF (A)OP AND (B)WHATMAN Nº1. ... 13 FIGURE 3.2–STRUCTURAL CHARACTERIZATION OF WHATMAN Nº1(RED) AND OP(BLACK) BY XRD.TYPE I CELLULOSE MARKED AS ●
AND CALCITE MARKED AS ◊. ... 14 FIGURE 3.3-GRADE OF LEAD PENCIL.H(FOR HARDNESS) TO B(FOR BLACKNESS).RESULTS WERE NORMALIZED BASED ON THE CARBON PERCENTAGE.CLAY COMPOSITION COMPRISES THE PERCENTAGES FOR ALUMINUM, SILICON, OXYGEN AND RESIDUAL CALCIUM.15 FIGURE 3.4–(A)RESISTANCE VALUES WITH DIFFERENT SPEED AND POWER CONDITIONS IN HYDROPHOBIZED OP WITH PENCIL 9B
SAMPLES.(B)EXAMPLE OF PENCIL 9B SAMPLES.(C)FINAL P-HME. ... 17 FIGURE 3.5-SEM IMAGES TOP VIEW:(A)PENCIL IN OP,(B)PENCIL IN OP AFTER LASER INCIDENCE. ... 17 FIGURE 3.6-SEM TOP VIEW OF CI-HME. ... 18 FIGURE 3.7-EDS ANALYSIS OF 9B PENCIL SAMPLE WITH AND WITHOUT LASER TREATMENT.EDS MAPPING OF CARBON IN SAMPLE
WITHOUT (A) AND WITH LASER TREATMENT (B). ... 18 FIGURE 3.8–RAMAN SPECTRA OF OP WITH PENCIL 9B WITH AND WITHOUT LASER TREATMENT ... 19 FIGURE 3.9–XRD DIFFRACTOGRAM OF OP,9BPENCIL WITH AND WITHOUT LASER AND CARBON INK.TYPE ICELLULOSE MARKED AS
● AND CALCITE MARKED AS ◊ ... 20 FIGURE 3.10–C1S REGION OF XPS SPECTRA OF 9B PENCIL SAMPLE WITHOUT (A) AND WITH LASER TREATMENT (B). ... 21 FIGURE 3.11-PRE-TREATMENT OF P-HME WITH KCL,(A) COMPARISON BETWEEN P-HME AND TWO PRE-TREATMENTS WITH CV;
(B) COMPARISON BETWEEN P-HME AND TWO PRE-TREATMENTS WITH CA.ASSESSED IN 5.0 MM[FE(CN)6]3− AND 5.0 MM
[FE(CN)6]4−, IN PBS BUFFER, PH7.2. ... 22
FIGURE 3.12-PRE-TREATMENT OF P-HME WITH EDOT,(A) COMPARISON BETWEEN P-HME AND TWO PRE-TREATMENTS WITH CV; (B) COMPARISON BETWEEN P-HME AND TWO PRE-TREATMENTS WITH CA.ASSESSED IN 5.0 MM[FE(CN)6]3− AND 5.0 MM
[FE(CN)6]4−, IN PBS BUFFER, PH7.2 ... 23
FIGURE 3.13-COMPARISON OF TWO CHIPS (A)CV READING OF CI-HME1 AND CI-HME2,(B)EIS READING OF CI-HME1 AND CI-HME2.ASSESSED IN 5.0 MM[FE(CN)6]3− AND 5.0 MM[FE(CN)6]4−, IN PBS BUFFER, PH7.2. ... 24
FIGURE 3.14-PRE-TREATMENT OF CI-HME:CV(A),EIS(B).ASSESSED IN 5.0 MM[FE(CN)6]3− AND 5.0 MM[FE(CN)6]4−, IN PBS
BUFFER, PH7.2 ... 24 FIGURE 3.15–ELECTROCHEMICAL READINGS OF THE SENSING SURFACES (MIP OR NIP LAYERS), BY CV(A) AND EIS(B) BEFORE THE
TEMPLATE REMOVAL.ZOOMED SECTION OF THE SENSING SURFACE BEFORE ELECTROPOLYMERIZATION (PEDOT LAYER). ... 25 FIGURE 3.16-ELECTROCHEMICAL FOLLOW-UP OF THE SEVERAL MODIFICATION STEPS OF THE CI-HME TO PRODUCE NIP(A AND C)
AND MIP(B AND D) FILMS, BY EIS(C AND D,NYQUIST PLOTS) AND CV(A AND B, CYCLIC VOLTAMMOGRAMS).RESULTS FROM A SOLUTION OF 5.0 MM[FE(CN)6]3− AND 5.0 MM[FE(CN)6]4−, IN PBS BUFFER, PH7.2. ... 26
FIGURE 3.17-SWV(A) MEASUREMENTS OF MIP/CI-HME BASED BIOSENSOR AND THE CORRESPONDING CALIBRATION CURVE (B), ALSO COMPARED TO THE NIP SENSING LAYER.DIFFERENT CONCENTRATIONS OF AΒ-42(NG/ML) IN PBS BUFFER.ALL ASSAYS WERE PERFORMED IN 5.0 MM[FE(CN)6]3− AND 5.0 MM[FE(CN)6]4−, IN PBS BUFFER, PH7.2. ... 27
FIGURE 3.18-SWV(A) MEASUREMENTS OF MIP/CI-HME BASED BIOSENSOR IN DIFFERENT CONCENTRATIONS OF AΒ-42(NG/ML) IN CORMAY SERUM, AND THE CORRESPONDING CALIBRATION CURVE (B, IN BLUE), ALSO COMPARING TO THE NIP(B, ORANGE). ALL ASSAYS WERE PERFORMED IN 5.0 MM[FE(CN)6]3− AND 5.0 MM[FE(CN)6]4−, IN PBS BUFFER, PH7.2. ... 28
FIGURE 3.19-RAMAN SPECTRA OF CI-HME,PEDOT/CI-HME,MIP/AΒ-42/PEDOT/CI-HME,NIP/PEDOT/CI-HME AND MIP/-/PEDOT/CI-HME ... 29 FIGURE 3.20-SEM TOP VIEW IMAGES (A)CI-HME(B)PEDOT/CI-HME ... 30 FIGURE 3.21-SEM TOP VIEW IMAGES (A) REMOVAL/NIP/PEDOT/CI-HME,(B)MIP/PEDOT/CI-HME AND (C)
REMOVAL/MIP/PEDOT/CI-HME ... 30 FIGURE 3.22-AFM(A)CI-HME(B)CI-HME/PEDOT ... 31 FIGURE 3.23-AFM(A)MIP/PEDOT-CI-HME(B) REMOVAL/MIP/PEDOT-CI-HME, AND (C)AΒ-42/MIP/PEDOT-CI-HME 31 FIGURE A.0.1-EXPERIMENTAL SETUP ... 40 FIGURE C.0.2-LASER EFFECT ON PENCIL 9B WITH DIFFERENT PAPER SUBSTRATES,(A)OP AND (B)WHATMAN Nº1.PLOT OF THE 4
DIFFERENT LASER POWER AND SPEED REGIONS THAT CAUSE DIFFERENT AFTER EFFECT IN THE PENCIL/SUBSTRATE.(C)SAMPLE OF OP WITH AN EXAMPLE OF LOST INTEGRITY (MARKET AS RED), MESH (MARKED AS YELLOW) AND IMPROVED CONDUCTIVITY (MARKED AS GREEN). ... 41 FIGURE D.0.3-FINAL CI-HME ... 41 FIGURE E.0.4-EDS ANALYSIS OF A 9B PENCIL SAMPLE WITHOUT LASER TREATMENT.(A)CUMULATIVE SPECTRUM OF THE EDS
xvi FIGURE E.0.5-EDS ANALYSIS OF A 9B PENCIL SAMPLE WITH LASER TREATMENT.(A)CUMULATIVE SPECTRUM OF THE EDS ANALYSIS,
WHERE THE PRESENCE OF IRIDIUM AND PHOSPHOROUS ARE DUE TO THE SAMPLE'S COATING.(B)EDS MAPPINGS OF CARBON, OXYGEN, ALUMINIUM, SILICON AND CALCIUM. ... 42 FIGURE G.0.6-PRE-TREATMENT OF P-HME WITH NACL, COMPARATION BETWEEN P-HME, A PRE-TREATMENT WITH CA AND TWO
PRE-TREATMENTS WITH CV.ASSESSED IN 5.0 MM[FE(CN)6]3− AND 5.0 MM[FE(CN)6]4−, IN PBS BUFFER, PH7.2 ... 43
xvii
List of tables
TABLE 2.1–MATERIALS AND REAGENTS USED AND THEIR ORIGIN ... 10 TABLE 3.1-IDEAL CONDITIONS FOR PENCIL 9B SAMPLES IN OFFICE PAPER AND WHATMAN Nº1 ... 16 TABLE 3.2-COST ANALYSIS OF CI-HME ... 32 TABLE 3.3-COST COMPARISON BETWEEN CI-HME AND THE TWO MORE COMMON TYPES OF ELECTRODES USED FOR
xix
Acronyms
a.u. Arbitrary units
AD Alzheimer Disease
AFM Atomic Force Microscopy
APP Amyloid precursor protein
ATP 4-Aminothiophenol
Aβ Amyloid β peptide
CA Chronoamperometry
CE Counter electrode
CENIMAT Centre for Materials Research
CI-HME Carbon Ink Homemade Electrodes
CSF Cerebrospinal fluid
CV Cyclic Voltammetry
EDOT 3,4-Ethylenedioxythiophene
EIS Electrochemical Impedance Spectroscopy
FWHM Full width at half maximum
LDW Laser Direct Writing
MIP Molecularly Imprinted Polymer
NIP Non-molecularly Imprinted Polymer
OP Office Paper
oPDA o-phenylenediamine
PBS Phosphate buffer saline
PEDOT poly(EDOT)
P-HME Pencil Homemade Electrodes
POC Point of care
PPI Pulses Per Inches
RE Reference electrode
RGB Red, Green and Blue
SEM Scanning Electron Microscopy
SWV Square Wave Voltammetry
xx
XPS X-ray photoelectron spectroscopy
0
Symbols
µm micrometre
Al2O3 Aluminum Oxide
CaCO3 Calcium Carbonate
Fe2+ Ferrous ion
Fe2O3 Iron (III) Oxide
Fe3+ Ferric ion
K3[Fe(CN)6] Potassium hexacyanoferrate III
K4[Fe(CN)6] Potassium hexacyanoferrate II trihydrate
KCl Potassium Chloride
M Molar
mL millilitre
mm millimetre
mV millivolt
NaCl Sodium Chloride
Rct Charge Transfer Resistance
Rs Sheet Resistance
SiO2 Silicon Dioxide
V volt
2
Motivation and objectives
The aim of this master thesis is to develop a new form of early diagnosis and monitoring, in a simple, low-cost and reliable way, of Alzheimer Disease.
A crucial factor for the prevention and treatment of diseases is their correct diagnosis, and with
Alz-heimer’s an easy and affordable method of diagnosis is still non-existent. Alzheimer’s disease affects
over 45 million people worldwide and this number is estimated to double every 20 years in aging pop-ulations, thus reaching a value of 115.4 million in 2050. Early detection of this disease, as well as the capability to distinguish it from other forms of dementia, is key to plan timely caring actions and help families intervene before the disease becomes too serious.
This project presents a new form of early diagnosis and monitoring, using a simple paper-based biosensor. This biosensor has carbon-based electrodes combined with plastic antibodies, which use the principles underlying the immune system, to detect the presence of biomarkers associated with the dis-ease, without requiring invasive procedures. It seeks to measure the levels of Aβ-42, a peptide associated with the formation of plaques in the brain tissue, and that will work as the biomarker in this project.
Thus, the main goal is to create a device that can be cheap and eco-friendly, but still effective. For this purpose, two types of carbon-based materials are tested: pencil and a commercial carbon-ink. Alt-hough both materials are conductive, this project also focused on improving their conductive proprieties by laser technology.
In terms of structure, the thesis is divided in two main parts:
4
1)
Introduction
1.1)
Alzheimer Disease
Dementia involves a decline in cognitive skills used to perform every-day activities. The Alzheimer Disease (AD) is the most common form of dementia, with 60-80% cases of dementia being attributed to AD and affecting over 45 million people worldwide [1], [2]. Although symptoms can vary widely, the
first problem many patients notice is forgetfulness, severe enough to affect their ability to function at home or work. However, the changes take place in the brain long before the signs of memory loss.
AD pathogenesis is complex, involving abnormal amyloid-β (Aβ) metabolism, Tau hyperphosphor-ylation, oxidative stress, reactive glial and microglial changes, and other pathological events [3]. In a
patient with this disease, the brain has visible differences in its tissue, in the form of misfolded proteins called plaques and neurofibrillary tangles that are responsible for breaking down the brain’s structure. Plaques are deposits of protein fragment (Aβ) that build up in the spaces between nerve cells, while
tangles are twisted fibers of Tau proteins that build up inside cells [3]. Though autopsy studies show that
most people develop some plaques and tangles as they age, those with AD tend to develop far more and in a predictable pattern, beginning in the important areas of memory, before spreading into other regions. The diagnosis of AD is done typically via extensive clinical examinations based on specific clinical diagnostic criteria. This process involves several exams that aren’t always reliable[4]. The identification
of relevant biomolecules that could act as AD biomarkers, and therefore allow rapid and effective diag-nosis of this disease, is highly pertinent. The amyloid precursor protein (APP), which is composed by
amyloid β peptide (Aβ), is therefore the chosen biomarker for this project’s device. The commencement of neurodegenerative disorders is known to be directly linked to high levels of Aβ-42/ Aβ-40 ratio,
where Aβ-42 is the long form of the Aβ peptide and Aβ-40 is the shorter chain [5].
Although there is no cure, an early diagnosis is still one of the most important tools to fight the progression of this disease. There are already forms of detection of this biomarker such as ELISA [6], [7]
and biosensors utilizing surface plasma resonance [8], [9], field effect transistor [10] and others[11] that have
been reported to demonstrate the detection of Aβ. Most of these forms of detection only take in consid-eration the detection in cerebrospinal fluid (CSF), which makes them invasive and some don’t allow a
point-of-care (POC) analysis [12]. A biosensor that could detect this biomarker in blood samples could
allow a reduction of cost, portability, and an overall easier way to diagnose the disease.
1.2)
Biosensors
Biosensors are analytical devices that incorporate a biological/biochemical sensing element and a transducer, to deliver a quantifiable response. The interaction between the analyte and the recognition element should be selective and capable of generating chemical/physical changes that are monitored by a transducer [13].
The type of components of a biosensor, as well as its construction, depends on its application, in addition to the sensitivity, sample characteristics, cost and lifetime. Generally, the most important ele-ment of the device is the recognition eleele-ment, as it determines its selectivity. The range of analyte con-centrations for which the device is sensitive is often associated with the transduction system, so the proper choice of these elements is critical [13], [14].
The analytical signal can be measured using optical (colorimetric, fluorescence, luminescence and interferometric, calorimetric) [15] and electrochemical methods (potentiometry, amperometry,
conduc-timetry/capacitive and impedimetric) [11], [16]–[18], calorimetric differential mass (piezoelectric/acoustic
waves) [18] or magnetic methods [19]. In the health field, the most commonly used biosensors are
5
1.2.1)
Electrochemical Biosensor
Electrochemical biosensors are the most common type of biosensors used today due to their porta-bility, cost effectiveness, small size, and easy use. All these features makes these perfect for POC de-vices [22].
The principle behind an electrochemical biosensor is that the electrons flow between the electroactive species and the electrode surface, producing a chemical reaction and changing in the electrical properties of the solution. These changes can be sensed and used both for qualitative and quantitative analysis [23].
Typically, electrochemical biosensors consist of an analyte, receptors, measurable signals, transducer and a data analysis system. Each of these has a different role within the biosensor. The analyte is a biological/chemical element that works as the target; it can vary from virus, bacteria, peptides, and oth-ers. The receptors are biological or chemical elements that have identical properties to the analyte; these must be compatible with each other in order to bind and interfere with current flowing (that generate the signal). A transducer is the element used to transfer and convert the signal into the data analysis system. Overall, this biosensor works in the form of an electrochemical cell, where the presence of electrodes and electrolyte become necessary [13]. These electrodes can be made from different kinds of materials,
which leads to variations in terms of sensitivity and in the length of the detection time of the sensor. Ideal electrodes are highly sensitive and show a fast response time; examples of the best materials are gold, silver and carbon.
When building an electrochemical biosensor, the most common combination for the electrodes is a 3-electrodes system, with a reference electrode (RE), a counter electrode (CE) and a working electrode (WE). The RE is used to maintain a known and stable potential, so it must be kept at a distance from the reaction site. The WE acts as the transduction element in the (bio)chemical reaction, while the CE es-tablishes a connection to the electrolytic solution so that a current can be applied to the WE. All of these should be both conductive and chemically stable.
Voltammetry is the analytical technique that monitors electrochemical biosensors, consisting of a potential sweep application and subsequent reading of the electrical current so generated. Depending on the waveform applied on the 3-electrodes system, various electro-analytical methods can be employed, such as Cyclic Voltammetry (CV), Chronoamperometry (CA), Square Wave Voltammetry (SWV) and Electrochemical Impedance Spectroscopy (EIS) [19].
In CV the potential is applied as a sweep/linear function of time. This method explores the behaviour of electroactive compounds and the mechanism of oxidation and reduction and it allows to verify the reversibility of systems, to determine the presence of chemical events associated to the transfer of charge and to verify the occurrence of adsorption of products in the electrode [19], [24].
SWV is a pulsed-voltammetry, in which the potential is applied by pulsing one potential to another, rather than sweeping. It allows the analysis through the shape of the current-potential curve, resulting from the application of a given potential that changes according to the pulse amplitude and duration. The obtained signal is the resulting current from both pulses. It exhibits excellent sensitivity and high rejection to capacitive currents. This measurement requires an initial time where the working electrode is polarized to a potential, where the redox reaction does not occur. The current-potential curves have a well-defined profile and are generally symmetric, since the currents are measured only at the end of each half-period and the variations in the height and width of the potential pulse are always constant, for a given range of potentials. The height of the peak produced is proportional to the concentration of the electroactive species [19].
Chronoamperometry is a time-dependent technique, used to study the kinetics of chemical reactions, diffusion processes and adsorption. In this technique, a potential step is applied to the electrode and the resulting current vs. time is observed [25]. Since the current is integrated over relatively longer time
in-tervals, chronoamperometry gives a better signal to noise ratio in comparison to other amperometric techniques [19].
6 measured. This assay allows quantifying the resistance or capacitance of the electrolyte at the WE sur-face. The Impedance is the proportionality factor between the phase potential and the phase current over time, measured in Ohm [19], [24]
.
1.3)
Molecularly Imprinted Polymer
In conventional assays, natural antibodies are used to interact in a selective way with a given target analyte. But these natural materials show several limitations, like high production costs and low chem-ical stability. In the presence of organic solvents or in other non-physiologchem-ical conditions, such as high temperature, pH and high salt concentration, natural antibodies lose their functionality. An alternative approach is to substitute these materials of natural origin by synthetic materials that display similar properties (biomimetic materials) [26].
Plastic antibodies mimic the response of natural antibodies while being of synthetic origin. These are obtained mostly by molecularly-imprinted polymer (MIP) technology, where a polymer is grown around the target molecule as can be seen in Figure 1.1. The exclusion of the target from the polymerized matrix generates imprinted sites that match the size and shape of the target [26].
Figure 1.1 - MIP production steps. oPDA is the monomer used herein and AB42 the target biomarker.
These imprinted sites are expected to act similarly to natural antibodies, rebinding to the target with great affinity and selectivity [26], [27]. The use MIP and plastic antibodies allows the achievement of the
artificial moulding of the analyte much faster than with a naturally occurring recognition and response
[28] [29]. When creating MIPs for proteins or peptides, in order for the molecular imprinting to be
success-ful, it is essential to use molecules with high affinity to the target.
Since the MIP will be part of an electrochemical sensor, the polymer may be produced by electro-polymerization. This method allows to adjust several parameters that regulate the rate of polymer nu-cleation and growth and to control the film thickness and morphology [30]. The template particles and the
monomers are mixed in the same solution and create the polymeric matrix directly on the sensor surface when the required electrical conditions are applied.
1.4)
Paper Electronics and Carbon Electrodes
Paper is the cheapest and most widely used flexible substrate in day-to-day life. It has a significantly lower price than plastic substrates and it also presents the advantage of being recyclable and made from reusable raw materials [31].
7 paper substrates [32], [33]. Paper has a porous structure and a large surface roughness. It can show fibres
with different sizes and shapes, depending on their origin and treatments [34].
The lack of medical care in poor-resource countries and the constant need for renewable/reusable materials has opened doors for paper as a substrate for biosensing. Paper is easy to fabricate, mass-producible and disposable, so it makes sense to develop an easy-to-use, rapid and inexpensive POC device with this substrate [35], [36]. However, its hydrophilic nature makes it unsuitable for
electrochem-istry, at least in its natural form. In order to create a biosensor capable of sustaining electrochemical procedures, the substrate was hydrophobized using a wax coat as in microfluidic devices [35]. Wax
print-ing is a method that requires only two steps, the printprint-ing patterns of wax on the paper surface and the melting of the wax into the paper to form a hydrophobic barrier. This technique is adapted to fabricate large numbers of paper devices in a single batch, due to its rapidity and low cost [37], [34].
There are thousands of conductive materials that can work as electrodes, but the most abundant is carbon. Carbon comes in numerous varieties of forms and has an extensive application in electrochem-ical studies [38],[39],[40]. When compared with metal electrodes, carbon has many advantages due to its low
cost, wide range of potential windows and high chemical stability. This element exists in many allotropic forms such as graphite, graphene and diamond [41]. The most common form is based on the graphite
structure, which can be modified or enhanced by surface treatments and modifications. These ap-proaches can increase surface roughness, surface area or oxygenate functional groups on the electrode surface.
Graphite has both metallic and non-metallic properties, being very useful as an electrode material. The pencil graphite leads are composite materials containing graphite (~65%), clay (~30%), and a binder (wax, resins, or high polymer) [42]. According to the European Letter Scale, graphite pencils are marked
with numbers, indicating the degree of hardness or blackness from 9H (the hardest) to 8B (the softest), and letters H (hardness) and B (blackness). The B-type leads contain more graphite and are softer, and the harder H-type leads have more clay, whereas HB type pencil leads contain equal portions of graphite and clay. Worldwide, 4% of graphite is used to produce pencils consisting of a fine powder in an inor-ganic (resin) or orinor-ganic matrix (clay or a high polymer).
1.5)
Laser Direct Writing
Carbon based materials are very commonly used as electrodes for electrochemical assays for their intrinsic properties, attributed to the structural properties of carbon itself [43]. From all these, graphene
and graphene derivatives have emerged as the most promising materials, due to their outstanding elec-trochemical properties, such as high conductivity, large surface area and mechanical robustness [44].
These materials can be produced by numerous deposition techniques, such as RF sputtering, screen-printing, inkjet screen-printing, spin-coating, among others. All these methods offer numerous advantages, however they are rather expensive and have prolonged processes with several fabrication steps. Thus, during the past decades, alternative techniques have been studied and Laser Direct Writing (LDW) showed great potential [45].
LDW consists in an easy and simple method of obtaining patterns on the surface of diverse materials ranging from common precursors, like paper and cloth to polymers and metals, always under ambient conditions [45]. This procedure is done by a laser, a highly amplified and focused beam of radiation,
which enables high accuracy and resolution printing, freedom of design, fast fabrication with very lim-ited steps, complex micro and nanofabrication. It even excludes the necessity of lithography masks and clean-room equipment. All these characteristics make LDW a very cheap and fast alternative [46]. When
carbon-based materials are printed by laser direct writing one more advantage is presented, since the laser beam can promote structural or chemical changes in the substrate, instead of ablation: the formation of graphene films. This has been demonstrated in several studies with multiple carbon precursors, like paper, Kevlar or Kapton [45]. The ease of obtaining high quality porous graphene films on the surface of
8
2)
Materials and Methods
This work is divided in two main parts. The first one consists in the production and optimization of carbon-based electrodes, using a CO2 infrared laser cutting system as a tool for fabrication and
improve-ment of conductive proprieties of the materials. In the second part, an electrochemical biosensor is pro-duced by integrating a MIP material as biorecognition element.
This chapter begins with a brief description of the materials and equipment used, followed by a description of the experimental procedures involved in this work.
2.1.1)
Pencil electrodes
For the fabrication and study of this type of electrode support, two types of paper were used: What-man no. 1 chromatography paper (GE Healthcare, 87 g/m², 570x460 mm sheets) and office paper (OP) (Navigator, 80 g/m2,210x297 mm sheets). The pencils tested were from DERWENT Graphic and
ranged from 3H to 9B (hardest to softest).
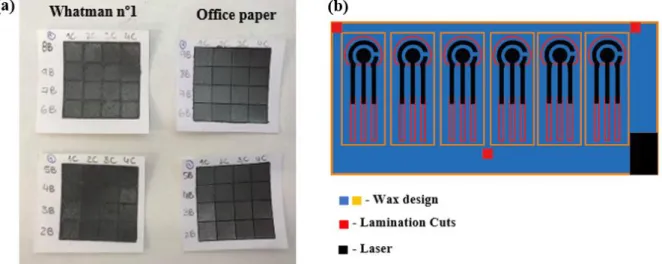
Before using a regular sensor design, tests were made to the pencil and paper, using a simple matrix where the different types of pencil had one to four layers (C), as can be seen in Figure 2.1a. Using a Universal Laser System CO2 VLS 3.5, a pulsed cutting laser (wavelength of 10.6 µm), associated with
a plano-convex lens (focal length of 50.8 mm, spot size of 0.127 mm) a change in the graphite structure can be made. The laser interface allows the definition of all laser parameters such as the laser power, the speed and the number of pulses per inches (PPI) in the form of a Red, Green, and Blue (RGB) color code.
Figure 2.1- (a) Study of pencils and type of paper, effects of laser in different layers. (b) Adobe Illustrator Design
The results were monitored by four-point probe measurements and a multimeter.
When the laser parameters were optimized, and a conclusion could be made about which pencil and paper substrate were better, the next step consisted in applying these to a classical 3-electrodes design, for the construction of the electrochemical biosensor. Due to this application, the paper needed to show a hydrophobic behavior, for which a wax treatment was made on the substrate.
Adobe Illustrator was used to create the computerized design shown in Figure 2.1b. A Xerox Col-orQube 8570 wax printer was used to apply the hydrophobic layer on the substrates. After printing, the wax needs to diffuse throughout the fibers of the paper; for this purpose, a hot plate annealing stage was done in a SCHOTT ROBAX equipment, for 2 minutes, at 120 ºC.
9 layers of pencil 9B. After that, the mold was detached and the chips were displayed and organized in the laser table using the alignment marks as can be seen in Figure 2.1b; the best condition for this type of electrodes (also named as chips) was 4W Power, with a 0.2286m/s speed with the table at -0.2’’.
To keep the chips protected and to create a distinguished area between the electrodes and the con-tacts, the chips were laminated according to Figure 2.1b. Silver ink from Conductive Compounds was used to coat the contacts in order to improve the readings of the chips. A hot plate annealing stage was then done for 20 min, at 120 ºC, to evaporate the solvents. The samples considered for this study were Pencil Homemade Electrodes (P-HME).
2.1.2)
Carbon Ink electrodes
For the fabrication of these electrodes, carbon ink from Conductive Compounds was used. The paper substrate had the same treatment as the previous chips, but instead of using moulds, the substrate was laminated and then coated with two layers of commercial carbon ink, followed by hot plate annealing, for 20 min, at 120ºC. The samples considered for this study were Carbon Ink Homemade Electrodes (CI-HME).
2.1.3)
Characterization of the home-made electrodes
Both electrodes were characterized by SEM-FIB using a Carl Zeiss AURIGA CrossBeam work-station instrument SEM images were captured in in-lens mode, with an acceleration voltage of 2 kV and an aperture size of 30 µm. Samples were glued onto aluminum substrates using a double-sided carbon tape and were coated with a thin carbon layer (<20 nm) using a Q300T D Quorum sputter coater.
EDS analysis was performed in a Hitachi TM 3030Plus Tabletop SEM, in low vacuum conditions for the identification of clay and graphite proportions in the composition of the different used pencil leads, as well as any other existent components.
The external layers of the electrodes surface were chemically and electronically analysed by X-ray photoelectron spectroscopy (XPS) to unfold the effects of laser ablation. The used equipment was an AXIS Supra XPS from Kratos Analytical and the used parameters were monochromated Al Kα radiation and pass energies ranging from 5 to 40 eV. The deconvolutions were done with CasaXPS. The asym-metric line shape was A(0.4,0.38,20)GL(30), whereas the symasym-metric ones were all GL(30). The full widths at half maximum (sp2: 0.5, π to π*: 2.7, sp3 and carbon-oxygen bonds: 1.2-1.3) and the relative
peak positions were held constant for all samples.
The crystallinity and structure of the samples were obtained by X-Ray Diffraction (XRD),
PANalyt-ical, model X’Pert Pro, in Bragg-Brentano geometry with Cu Kα line radiation (λ=1.5406 Å). The dif-fractograms were acquired in a range of 2θ ranging from 10 to 70 ° with a range of 0.03 °.
Raman spectroscopy data was generated by a Renishaw Qontor Raman microscope, equipped with 532 and 633 nm lasers, spectral resolution of 0.3 cm-1 (FWHM), mapping capability with 100 nm of
lateral resolution and real time dynamic AUTO FOCUS.
Atomic force microscopy (AFM) measurements were performed in an Asylum Research MFP-3D Standalone operated in alternate contact mode in air (commonly known as tapping mode), using com-mercially available silicon AFM probes (Olympus AC160TS; k = 26 N/m, f0=300 kHz). The resulting topographies were plane fitted in Igor Pro software (Wavemetrics) and the final images generated using Gwyddion software.
2.2)
Electrochemical sensor
2.2.1)
Apparatus
10 The interface between the electrodes and the Autolab was made through a homemade interface devic, specially designed by CENIMAT for this purpose. The fabrication protocol and pictures of the interface are shown in Annex A (Figure A.0.1).
2.2.2)
Materials and Reagents
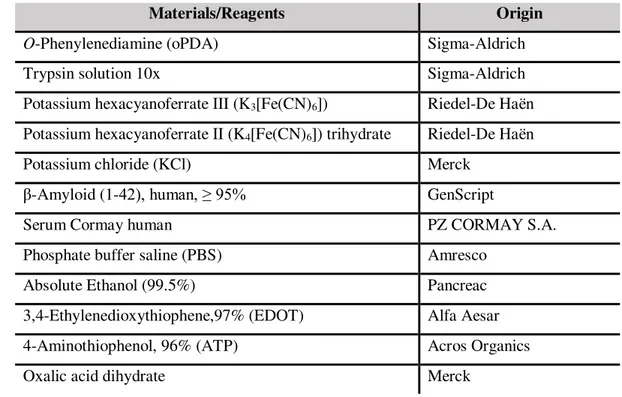
The materials and reagents used are listed in Table 2.1. All chemicals were of analytical grade and de-ionized water (conductivity <0.1 µS/cm) was employed.
Table 2.1– Materials and Reagents used and their origin
Materials/Reagents Origin
O-Phenylenediamine (oPDA) Sigma-Aldrich
Trypsin solution 10x Sigma-Aldrich
Potassium hexacyanoferrate III (K3[Fe(CN)6]) Riedel-De Haën
Potassium hexacyanoferrate II (K4[Fe(CN)6]) trihydrate Riedel-De Haën
Potassium chloride (KCl) Merck
β-Amyloid (1-42), human, ≥ 95% GenScript
Serum Cormay human PZ CORMAY S.A.
Phosphate buffer saline (PBS) Amresco
Absolute Ethanol (99.5%) Pancreac
3,4-Ethylenedioxythiophene,97% (EDOT) Alfa Aesar
4-Aminothiophenol, 96% (ATP) Acros Organics
Oxalic acid dihydrate Merck
2.2.3)
Solutions
The electrical features of the sensing surface were followed by checking the electrical features of a standard redox probe composed of 5.0×10⁻³ mol/L K
3[Fe(CN)6] and K4[Fe(CN)6], prepared in PBS
1.0×10⁻² mol/L, pH 7.36.
A KCl solution of 0.1 mol/L was prepared in deionized water. This solution was used as solvent of an EDOT solution of 0.01 mol/L. A 5.0×10⁻³ mol/L solution of aminothiophenol was prepared with a
30% ethanol aqueous solution acting as solvent. The oPDA standard solutions of 5.0x10⁻⁵ mol/L were
prepared in PBS buffer, pH 7.36.
To prepare a control sensing layer (non-imprinted polymer, NIP), the polymer was formed in the absence of the target protein. For this purpose, an oPDA solution of 50 µmol/L was electropolymerized. The MIP sensing layer was prepared similarly, by added 10µL of a solution of Aβ-42 (10 µg/mL con-centration, prepared in PBS buffer, pH 7.36) to 990µL of the previous solution.
Calibrating solutions required the preparation of stock solutions of Aβ-42 oligomer. This was pre-pared in a concentration of 0.5 mg/mL, in PBS buffer, pH 7.4. The Aβ-42 oligomer was prepared ac-cording to Marco Gobbi et al [50], where the monomeric peptide solutions were diluted to 100x10-6 mol/L in 50 x10 -3 mol/L phosphate buffer, 150x10-3 mol/L NaCl, pH 7.4, and incubated for 24 hours at 4ºC.
Less concentrated standards were obtained by accurate dilution of the previous solution in PBS buffer or in Cormay Serum.
11
2.2.4)
Analytical Procedures
All assays were conducted in triplicate to ensure reproducibility. The first procedure in each chip was related to the reading of a blank signal (only buffer). This was necessary to ensure an analytical correlation within assays of chips from the same batch. The implemented procedures depended on the assembly of the chip, described next. The pencil (P) or carbon ink (CI) homemade electrodes (HME) were assigned as P-HME or CI-HME, respectively.
2.2.4.1)
Carbon Ink Chips
CV and SWV measurements were conducted in the standard iron redox probe. For CV assays, the potential was scanned from -0.7 to +0.7 V, at 50 mV/s. For SWV studies, potentials ranged from -0.4 to +0.3 V, at a frequency of 10Hz, with a step height of 250 mV.
EIS assays were performed with the same redox couple solution [Fe(CN)6]3-/4- with open potential
circuit (OCP), using a sinusoidal potential perturbation with an amplitude of 0.01 V and a number of frequencies equal to 50, logarithmically distributed over a frequency range of 0.1-100 kHz. The imped-ance data was fitted with commercial software Nova.
After the first readings, a pre-treatment was conducted by CA, applying +1V for 10 seconds in the EDOT solution. Another reading was made to ensure that the layer of PEDOT was well-formed on the WE. Then, the chip was incubated in ATP for 1h. After this incubation stage, the electropolymerization was made by CV with either MIP or NIP preparing solutions. The potentials were scanned from -0.45 to +0.8 V, at 100 mV/s, in 5 consecutive cycles. The template removal procedure was made (in both, MIP and NIP sensing layers), by incubating the chip in Trypsin solution for 90 min at 36ºC, followed by another incubation in oxalic acid for 2 hours at room temperature.
The calibration curve was performed by SWV and EIS measurements. Readings were made for MIP and for NIP materials, with each assay performed at least 3 times. Each calibration curve was achieved after a 20 minutes incubation period for each Aβ-42 standard solution, and for increasing concentrations. Each Aβ-42 incubation was followed by an iron redox probe reading, extracting the electrical features of the surface for each standard concentration. The Aβ-42 concentrations ranged from 0.1ng/mL to 1.0 µg/mL, prepare in buffer.
Calibration assays were also conducted by incubating Aβ-42 standard solutions prepared in serum and followed by SWV measurements. For this purpose, Aβ-42 was prepared in Cormay serum solution, diluted 100 times, and in the same concentration range as before.
The chemical/physical data of the synthetic materials was obtained by surface analysis using Raman spectroscopy, SEM and AFM. The samples considered for this study were: PEDOT/CI-HME, MIP/PE-DOT/CI-HME, trypsin/ MIP/PEDOT/CI-HME and NIP/PEDOT/CI-HME.
2.2.4.2)
Pencil Chips
With this type of electrodes, a study was conducted to understand the best type of pre-treatment to be applied. The best pre-treatment ended up being the same as described in 2.2.4.1). The pencil home-made electrodes (P-HME) weren’t electrochemically stable so no further procedures were applied. The samples considered for this study were: P-HME, P-HME/KCl, P-HME/NaCl, PEDOT/P-HME.
2.2.5)
Characterization of the Sensors
Raman spectroscopy data was generated by a Thermo Scientific DXR Raman spectroscope, equipped with a confocal microscope and a 532 nm laser. A 5mW laser power at sample was allowed for 25 μm
slit aperture.
13
3)
Results and discussion
In this chapter, all the work regarding the biosensor fabrication and functionalization is presented and discussed. First, section 3.1) presents the substrate characterization, comparing the two types of paper studied. Secondly, section 3.2) shows the optimization results of laser parameters used to increase conductivity of P-HME, as well as a comparison between the two types of carbon-based materials used to serve as electrodes in this work (P-HME and CI-HME). Finally, section 3.3 presents the electrochem-ical characterizations of both types of sensor, with respectively studies and analysis.
3.1)
Paper Characterization
Two types of paper were used in the construction of the sensor: OP and Whatman nº 1. These papers are used herein as a support for casting the CI or P-carbon materials, making it important to know the morphological and crystallographic features of these supports.
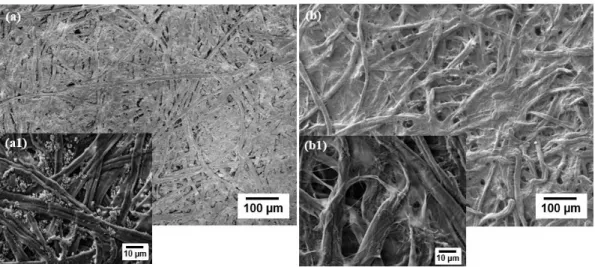
SEM analysis of OP is shown in Figure 3.1a, where the surface displays a matrix of randomly
dis-persed long cellulose fibers of about 5 to 15 μm width. In addition, these fibers also seem flattened, probably due to the compression step during the manufacturing process.
Figure 3.1- SEM images top view of (a) OP and (b) Whatman nº1.
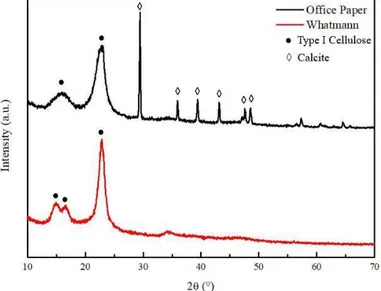
14 The structural analysis of the paper was made by X-Ray Diffraction, as can be seen in Figure 3.2.
Figure 3.2 – Structural Characterization of Whatman nº1 (red) and OP (black) by XRD. Type I cellulose marked as ● and calcite marked as ◊.
By diffractogram analysis, it is possible to observe the characteristic peaks of type I cellulose (ICDD file: 00-056-1718719), marked as ●. In Whatman paper two peaks can be identified at 14.88º and 16.63º, which does not happen in the OP, where there is only a large peak 15.9º. This can be justified by the presence of more residual amorphous materials in its cellulose fibers, which create a fusion of the peaks. Type I cellulose has a monoclinic geometry, with unit cell constants a = 8.3, b = 10.3, c = 7.9 Å and
angles α = 90, β = 84 and γ = 90 °.
When analyzing the OP diffractogram it is possible to identify another crystalline structure, marked as ◊ that is not present in Whatman paper. This structure is Calcite (CaCO3) (IDD file: 01-072-1937); it
has a rhombohedral geometry and unit cell constants a = b = 4,99 and c = 17,08 Å with angles α= 90, β = 90 e γ = 120 °. Calcite is the principal additive to this type of paper fabrication; it is also used to alter the optical properties of the paper forming porous agglomerates, is responsible for the opacity and gloss of this kind of paper and improves the ink reception capacity, so it is more used in substrates for writing and printing.
3.2)
Carbon-based electrodes characterization
3.2.1)
Pencil Characterization
Commercial pencil leads are made using graphite and clay and each one has a certain mixing ratio, which differs according to its hardness. While clay gives the hardness and works as a binder (H charac-teristics), graphite gives the B characteristics to a pencil which can be described as the blackness and softness. Higher hardness is directly related to an higher percentage of clay and lower percentage of carbon [44], [51], [52].
According to Y. Kim et al [51] clay’s main contents are SiO2, Al2O3 and Fe2O3, but it can vary
15
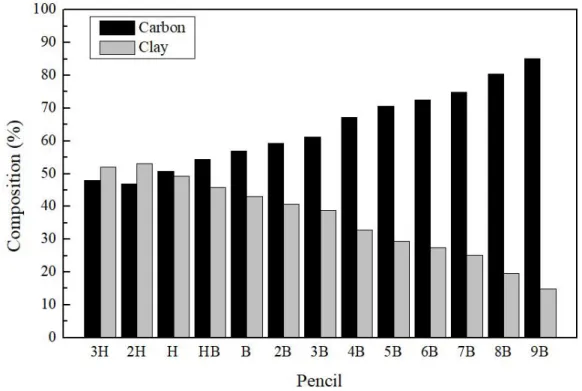
Figure 3.3 - Grade of lead pencil. H (for hardness) to B (for blackness). Results were normalized based on the carbon percentage. Clay comp osition comprises the percentages for aluminum, sili con, oxygen
and residual calcium.
The obtained data was very similar to both Satoru Kaneko papers [33], [44], as the pencils became softer,
they showed a visible increase in carbon proportion in its composition and 9B was highlighted has hav-ing the biggest carbon percentage of them all. On the other hand, pencils 2H and 3H showed the highest composition of clay and also had the highest percentage of aluminum.
The samples existing components were identified as carbon, silicon, aluminum, oxygen and had some residual calcium, all accordingly to R.N. Bhowmik paper [52]. The only missing element that was
expected to be found through this EDS analysis was iron. Its absence can be justified by either the existence of such trivial amounts that the software did not consider it relevant or the manufacturer just does not apply iron(III) oxide in its clay.
The electrical conductivity of a pencil trace depends on the quality of the contact between graphite particles in the percolating network. Expansion and contraction of this network, induced by either me-chanical stress or chemical interactions, should greatly affect the quality of inter-particle contacts and thus the overall electrical conductivity. Samples with the highest percentage of carbon are expected to work better as electrodes, since they should be more conductive.
3.2.2)
Identification of laser parameters
The first studies were conducted with samples of different grades of pencil with different layers. Before any laser treatment, their sheet resistance (Rs) was measured with a four-point probe. In Annex
B (Table B.0.1) are represented the values of Rs according to the type of pencil and layers used for
pencils 9B to 2B since the others showed no resistance. Sheet resistance was calculated using equation 1.
𝑅𝑠 = 𝑘𝑉 (𝑚𝑉)
𝐼 (µ𝐴)
(1)
16 Pencils 8B and 9B revealed the best sheet resistances (488.10 Ω/□ and 619.98 Ω/□, respectively) with no treatment as expected, since they had the lowest concentration of clay and higher concentration of graphite (carbon) [44], thus these were the chosen to proceed with the study. Since no studies about
the effect of laser in pencil were found, a wide range of conditions was tested, which revealed better results for pencil 9B, as can be seen in Annex C (Figure C.0.2).
When analyzing the graph on Figure C.0.2, the strong influence of the substrate can be noticed. Four different regions were created:
- A region where the laser treatment did not make any impact on the sample’s surface (grey area);
- A region where there was an improvement on Rs values (green area);
- A region where although there was an improvement on Rs the substrate was affected and created
a sort of mesh (yellow area);
- And finally, a region where the sample was destroyed (red area).
OP showed a smaller area where laser treatment improved the samples Rs, so more conditions were
tested. Even with a smaller area of improvement, better results were achieved with this type of substrate. The samples were hand-made in a squared shape as mentioned in 2.1.1), so “human-error” had to be
kept in mind.
With laser treatment, the best results achieved for each substrate are presented in Table 3.1.
Table 3.1 - Ideal Conditions for Pencil 9B samples in Offi ce paper and Whatman nº1
Substrate Laser Condition Sheet Resistance (Ω/)
Office Paper Power: 3.5 W Speed: 0.138 m/s
29.911
Whatman nº1 Power: 2.5 W Speed: 0.127 m/s
37.162
OP is less expensive and easier to find than Whatman and, as the main goal was to produce a low-cost biosensor, it turned out to be the best choice as substrate. A hydrophobization step was required, considering that the hydrophilic nature of paper is not compatible with electrochemical biosensing ap-plications, since any solution would be soaked by the substrate itself, provoking short-circuits between the electrodes.
17
Figure 3.4 – (a) Resistance values with different speed and power conditions in hydrophobized OP with Pencil 9B samples. (b) Example of pencil 9B samples. (c) Final P-HME.
After analyzing the obtained results, it can be concluded that slower speeds and lower power lead mostly to better electrical properties. Although there is a significant area where resistance values are around 150 Ω, some lacked integrity and/or were inconsistent. The best condition consisted on 4 W of power and 0.229 m/s of speed, which presented a resistance of about 5% of its original value, making these the chosen parameters to produce the electrodes used in the stages ahead.
With the laser parameters established, the final step of production of P-HME was to encapsulate these using laminating sheets to prevent any damage and coat the contacts with silver ink to improve the electrical contact for the electrochemical readings (Figure 3.4c).
CI showed no need to have laser treatment, as it had 25.69 Ω/ by itself and the laser only decreased its conductivity proprieties. An image of the final CI-HME can be consulted in Annex D (Figure D.0.3). In order to understand and justify the effect of laser in pencil-based samples, morphological and crystallographic analysis were conducted, as can be seen in sections ahead.
3.2.3)
SEM Characterization
Morphological characterization of pencil samples with and without laser irradiation and of CI-HME were made using SEM, as can be seen in Figure 3.5 and Figure 3.6 respectively.
18
Figure 3.6 - SEM top view of CI-HME.
Since the chosen paper was OP and SEM images were taken in top view, Whatman samples were not taken in consideration. As can be seen in Figure 3.5, there are no visible significant surface changes with the laser incidence, at this magnification. Increased magnification images could show surface dif-ferences, but higher resolution could not be achieved due to technical limitations of the equipment at the time.
The CI-HME sample revealed a “grainy texture” despite resembling a continuous film. Some gaps
and fissures can be observed, due to the production or annealing process. This morphology is similar to commercial chips, so it works as a good method of comparison.
3.2.4)
EDS Characterization
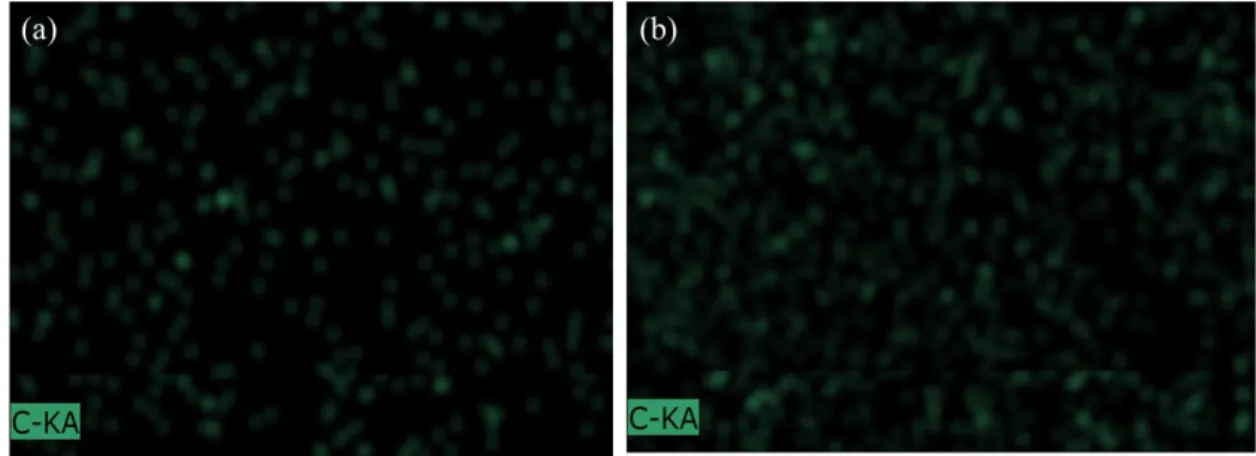
In addition to the EDS analysis made in 3.1), another analysis was made to a 9B pencil sample with laser treatment, in order to understand if any modification occurred. Results can be seen in Figure 3.7 and Annex E ( Figure E.0.4 and Figure E.0.5 ).
Figure 3.7 - EDS analysis of 9B pencil sample with and without laser treatment. EDS mapping of car-bon in sample without (a) and with laser treatment (b).
19 The analysis found evident that the laser treatment leads to a change in atomic mass percentage of the components, since the same elements as the previous sample exist in less quantities: carbon, silica, oxygen, aluminium and residual calcium. The thermal effect of the laser treatment might have induced the formation of molten grains and micro cracks in the outer layers of the graphite surface, which would result in extreme physical stress and possible structural re-arrangement [53].
3.2.5)
Raman Spectroscopy
To have a better understand of what the role of laser in the improvement of pencil’s conductivity proprieties was, Raman Spectroscopy was used. The results can be seen in Figure 3.8.
Figure 3.8 – Raman Spectra of OP with pencil 9B with and without laser treatment
The Raman spectra of all carbon systems showed only a few prominent features, no matter the final structure. These evidenced two intense bands (G and D) around 1500 cm-1, corresponding respectively
to natural graphite (1575 cm-1) and the type of graphite material (1355 cm-1), and few other second order
modulations around 2700 cm-1. The peaks shape, intensity and positions allowed distinguishing several
forms of carbon from a metallic nanotube to amorphous carbon [54].
In general, the intensity ratio (ID/IG) is characteristic of the extent of disorder present within the
ma-terial: the higher the ratio, the lower the disorder. The G band is the first-order Raman band of all sp2
hybridized carbon materials. The D band is a defect activated band in sp2 hybridized carbon materials.
The intensity of the 1575 cm-1 line rises with the laser treatment, which is associated with an increase in
the amount of sp2 carbon [55], making a higher I
D/IG ratio and justifying the increased conductivity of the
sample.
3.2.6)
XRD Characterization
X-ray diffraction was an essential tool to identify the crystalline phases of the graphite and compare
with the other characterization methods, the results can be seen in Figure 3.9.
20
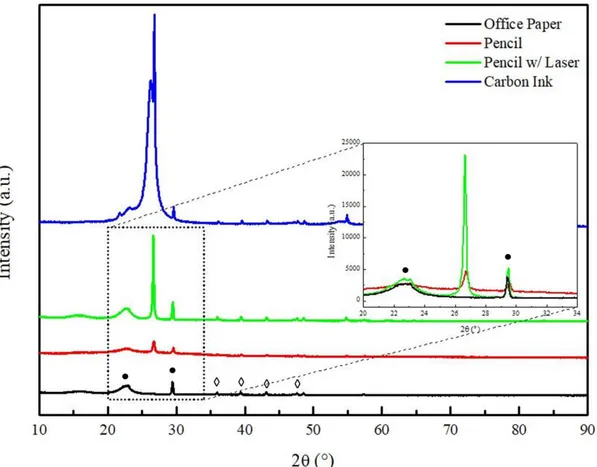
Figure 3.9 – XRD diffractogram of OP, 9B Pencil with and without Laser and Carbon Ink. Type I Cellu-lose marked as ● and Calcite marked as ◊
By analyzing the XRD diffractogram the presence of the spectrum corresponding to the paper sub-strate is clear, showing the characteristic cellulose and calcite peaks (marked as ● and ◊ respectively) as mentioned before in 3.1).
Apart from the presence of the substrate, another peak is visible at 26.6 º corresponding to graphite (IDD file: 01-072-0961). This peak is present in both pencil samples but is more intense with laser treatment. The sample with no laser had a full width at half maximum (FWHM) of 0.3022 º that de-creased to 0.1877 º with laser treatment. The inde-creased intensity of the peak and decrease FWHM proved that there was a crystallographic organization of graphite, by induction of oxygen-containing groups by means of a physico-chemical reaction [52].
3.2.7)
XPS Characterization
XPS can measure the elemental composition, empirical formula, chemical state and electronic state of the elements within a material. This technique helps to gather further information about the existing phases and oxidation states at the sample’s surface that could not, otherwise, be obtained with XRD.
21
Figure 3.10 – C 1s region of XPS spectra of 9B pencil sample without (a) and with laser treatment (b) .
The energies and intensities of the photoelectron peaks enable identification and quantification of surface elements, based on the unique binding energy each element has. The shift in binding energies of one element is due to different bonding situations (which is referred to as chemical shift).
The bond of carbon atoms can hybridize, to form σ and π bonds, in three different ways: sp3
hybrid-ization, which is a typical structure of diamond and silicon (C-C); sp2 hybridization, which is a
two-dimensional graphite layered structure (C=C) and sp1 hybridization, that is a one-dimensional structure.
Structure depends strongly on sp2 and sp3 bonds [56]. π bonds form only between sp2 hybrids, are weaker
than σ bonds and they are responsible for the electronic properties of the carbon films, namely their conductivity and optical bandgap. As for σ bonds, they define the mechanical properties of carbon films,
such as their hardness, which is therefore linked with sp3 hybrids [57]. So, an accurate measurement of
the sp2 and sp3 hybrids concentration is desirable for understanding the properties of the carbon films.
Graphite and graphitic-like compounds have an asymmetric C 1s peak-shape (as they are conductive) centred at 284.5 eV. Also present, is the structure related to the π to π* transition (shake-up) at around 286.4 eV [58], [59]. Deconvolutions of carbon C 1s peaks provide quantitative information regarding the
binding modes of carbon. It is revealed that 9B pencil samples without laser treatment contain a signif-icantly higher amount of sp3 carbon (C-C) when compared to laser treated samples (15.99% compared
to 2.99%). As the laser treatment lowers the amount of sp3 carbon bonds, the sp2 portion is increased
from 76.61% to 90.16%.
The laser treated samples, due to their increased amount of sp2 bonds, shown by the stronger
inten-sity, have a higher electrical conductivity.
3.3)
Electrochemical Characterization
3.3.1)
Pencil
The first approach was to verify the behaviour of the WE after its preparation. This was done by monitoring the electrical features of the oxidation/reduction peaks of the standard redox probe, by dif-ferent electrochemical techniques. These readings identify the typical values of this iron probe, enabling a comparative study of the modifications made in the following steps to be carried out. These readings also helped to guarantee homogeneity within chips prepared throughout this work.
When the iron redox probe is followed by CV, the scan towards the positive potentials promotes the oxidation of iron, converting Fe2+ into Fe3+ and yielding a current flow from the solution species to the
22 reaction equals the extent of the reduction reaction), and the voltage separation between the current peaks must be 59 mV for a reversible process.
With this type of electrodes, the oxidation and reduction peaks of the iron probe were too far apart, indicating that the surface did not display enough conductivity properties for the intended application. To solve this, a pre-treatment or a cleaning step became necessary and were implemented. This is a common procedure used among electrochemical biosensing development, also used in commercial 3-electrodes devices.
3.3.1.1)
Electrochemical study
The main purpose of the first study was to select a suitable pre-treatment or cleaning process that could improve the conductivity proprieties of the P-HME. In the literature, there are several papers using pencil-based electrodes, but never with laser treatment as this work was the first attempt to carry out such preparation of 3-electrodes systems. Yet, as the main target was to improve the carbon surface in terms of electrical output, the chosen parameters were based on Jayant I. Gowda et al[60] and Golnaz Parvizi-Fard et al [61] papers, relying mostly in electrochemical approaches in specific solutions. Herein, four solutions were tested: KCl 0.5 M and 0.1 M, NaCl 0.1 M and EDOT. NaCl studies can be consulted in Annex G (Figure G.0.6).
KCl Studies
To identify the best cleaning condition for this type of electrodes, the first study was made using a KCl solution 0.1M, as it had been used in several papers regarding graphite and other carbon-based electrodes [60], [62].
With a pre-treatment of the KCl solution by CV, several conditions were tested, the best conditions are shown in Figure 3.11a. With a potential range of [-2; +2] V, 40 cycles and 100 mV/s (CV1), CV analysis shows oxidation and reduction peaks of -0.35 V and 0.35 V, which indicated a quasi-reversible behaviour. Although the voltage separation indicated a quasi-reversible behaviour, the peaks were too separated and this pre-treatment was still not ideal for the purposes of this work.
Adding more cycles could make the electrode degrade and fewer cycles made little to no difference on the original reading. Changing the concentration of the KCl solution to 0.5 M (CV2) and keeping the same parameters made the peaks much closer, with a voltage separation of 105 mV.
Figure 3.11 - Pre-treatment of P-HME with KCl, (a) compar ison between P-HME and two pre-treat-ments with CV; (b) compar ison between P-HME and two pre-treatpre-treat-ments with CA. Assessed in 5.0 mM
[Fe(CN)6]3− and 5.0 mM [Fe(CN)6]4−, in PBS buffer, pH 7.2.
In an attempt to reduce the time spent on CV assays and to try to obtain better results, a CA pre-treatment was studied and the results are shown in Figure 3.11b. With the 0.1 M KCl solution, the time