Licenciado em Ciência e Engenharia Informática
A Model-Driven Approach for Mobile Business
Intelligence
Dissertação para obtenção do Grau de Mestre em Engenharia Informática
Orientadores :
Prof. Doutor Vasco Miguel Moreira Amaral,
Pro-fessor Auxiliar, Faculdade de Ciências e
Tecnolo-gia, Universidade Nova de Lisboa
Nuno Pereira Gomes, Geographical Information
Systems Consultant, Novabase
Presidente: Doutor João Miguel da Costa Magalhães Arguente: Doutor Ademar Manuel Teixeira de Aguiar
A Model-Driven Approach for Mobile Business Intelligence
Copyright cDavid Monteiro Duarte, Faculdade de Ciências e Tecnologia, Universidade Nova de Lisboa
Acknowledgements
I would like to express my sincere gratitude to everyone who directly or indirectly sup-ported me throughout these last academic years.
First I would like to thank the teacher Vasco Amaral, for his availability to collaborate with me on this dissertation, for all the advice and knowledge shared. Your help was indispensable.
To my college Faculdade de Ciências e Tecnologias from Universidade Nova de Lis-boa, in particular to Computer Science Department for all the knowledge and opportu-nities transmitted during the last five years.
A special thanks to Novabase enterprise group, for the conceived opportunity, trust and the knowledge shared. In particular, to Nuno Pereira Gomes for accepting to collab-orate with me, and to all the colleagues I have met on this company, for all the moments shared with me, it made easier this chapter of my academical life.
To everyone who accepted to spent some of their time to participate on the usability tests. Your contribution was crucial to the realization of this work.
To my family, specially to my parents, a paragraph is not enough to thank you for the constant love, support and values taught, which contributed, in all aspects, to my personal growth.
To everyone whose name I am not mentioning here, but contributed directly or indi-rectly to the realization of this dissertation.
Abstract
The concept of Mobile Business Intelligence is nowadays gaining prominence in busi-ness markets. With the emergence and evolution of mobile technologies such as smart-phones and tablets, the users gain the opportunity to analyze the corporate information, anywhere and anytime, based on charts, tables and dashboards. However, there is also the question of how to provide the freedom to the user to build its own analytical com-ponents.
This work will address the problem of developing a hybrid mobile solution towards the Business Intelligence domain, offering monitoring services and simultaneously ad-dressing the problem of user empowerment, with easy configuration and semi-automatic generation of analytical widgets. To provide such capacity to the user, the proposed so-lution is based on the design of a Domain Specific Modeling Language, aligned with the Model-Driven Development approach and inspired by the Product Lines principles.
The last part of this work is dedicated to evaluate the language usability based on an empirical test, executed by a set of subjects with different backgrounds of specializa-tion. In this sense, we define two groups: end users and domain experts. The goal is to determine the extent to which the prototype can be used to empower the end users. As support for the analysis we have extracted a set of measures, alongside with the final appreciation from the domain experts group, composed by people currently working on Business Intelligence.
Resumo
O conceito de Mobile Business Intelligenceencontra-se em destaque no mercado em-presarial. Com o aparecimento e constante evolução de tecnologias móveis tais como smart phonese tablets, os utilizadores ganham a oportunidade de analisar a informação de negócio em qualquer altura e em qualquer lugar, sob forma de gráficos, componentes tabulares e painéis interativos. No entanto, surge também a questão de como atribuir liberdade ao utilizador de modo a construir os seus próprios componentes analíticos, configurando a sua própria visão sobre os indicadores de negócio.
Com este trabalho pretende-se desenvolver uma solução móvel híbrida deBusiness Intelligence, onde essencialmente se pretende dotar os utilizadores de capacidades de mo-nitorização e paralelamente endereçando o problema deuser empowerment, da configura-ção de componentes analíticos. Nesse sentido, a soluconfigura-ção proposta passa pelo desenho de uma Linguagem de Modelação Dominio Específico, implementada usando aborda-gens de Desenvolvimento Orientado a Modelos e inspirado nos princípios de Linhas de Produto.
A última parte deste trabalho é dedicado à avaliação da usabilidade da linguagem, baseando num teste empírico com a participação de um conjunto de utilizadores com di-versos percursos formativos. Nesse sentido, foi definido dois grupos: utilizadores finais e especialistas do domínio. O objetivo é determinar até que ponto o protótipo desenvol-vido é capaz de capacitar os utilizadores finais na configuração dos seus componentes. De modo a suportar as análises, extraímos um conjunto de métricas, juntamente com a apreciação final de profissionais do domínio, sendo indivíduos que atualmente traba-lham na área deBusiness Intelligence.
Contents
1 Introduction 1
1.1 Problem Statement and Motivation . . . 2
1.2 Objectives . . . 3
1.3 Context . . . 4
1.4 Contributions . . . 5
1.5 Document Structure . . . 5
2 Background Concepts 7 2.1 Theoretical Background . . . 7
2.1.1 Model . . . 7
2.1.2 Domain-Specific Language . . . 8
2.1.3 Model-Driven Development . . . 9
2.1.4 Software Product Line . . . 10
2.1.5 The Domain of Business Intelligence . . . 10
2.2 Technical Background . . . 20
2.2.1 Mobile Development Methodologies. . . 20
2.2.2 The Target Platform . . . 22
2.2.3 Modelling tools . . . 25
2.3 Summary and discussion. . . 26
3 The User Empowerment on Business Intelligence 27 3.1 Categorization . . . 27
3.1.1 Interactive Reports and Dashboards . . . 28
3.1.2 Ad-Hoc querying . . . 28
3.1.3 Data Discovery . . . 28
3.2 Example of Tools . . . 29
3.2.1 SAP Web Intelligence. . . 29
3.2.2 Tableau . . . 30
4.3.1 Second Version of the Target Platform . . . 41
4.3.2 Editor UI specification . . . 42
4.3.3 Generated Widgets UI specification . . . 45
4.3.4 Customization . . . 45
4.4 Summary and discussion. . . 46
5 The Modeling Language Design 49 5.1 Language Design . . . 49
5.1.1 Designing the Abstract Syntax . . . 50
5.1.2 Designing the Concrete Syntax . . . 57
5.1.3 Well-Formedness rules . . . 58
5.2 Summary . . . 60
6 Implementation 61 6.1 Meta-models and meta-data implementation . . . 62
6.1.1 Line, Bar and Area Chart . . . 62
6.1.2 Pie Chart. . . 62
6.1.3 Heat Map . . . 63
6.1.4 Pivot Table. . . 63
6.1.5 Drop down filter . . . 63
6.1.6 Meta-data . . . 64
6.2 Model instance . . . 65
6.3 Architecture design . . . 66
6.4 Architecture implementation . . . 67
6.4.1 Editor Component . . . 67
6.4.2 Server Component . . . 69
6.4.3 Target Platform extension . . . 80
6.5 Examples . . . 82
6.5.1 Requesting the Editor Component view . . . 82
6.5.2 Generating a widget . . . 83
6.5.3 Saving the generated widget . . . 83
7 Validation 89
7.1 Prepared material for the experiments . . . 90
7.2 Evaluation Procedure . . . 90
7.2.1 Users Interview . . . 90
7.2.2 Training Session. . . 90
7.2.3 Case Study Presentation . . . 91
7.2.4 Empirical Tests . . . 91
7.2.5 Satisfaction Questionnaires . . . 92
7.3 The Subjects . . . 92
7.4 The Tasks . . . 93
7.4.1 Multiple Choice Questions . . . 93
7.4.2 Practical Experiments . . . 96
7.5 End user test results analysis . . . 97
7.5.1 Multiple choice questions results . . . 97
7.5.2 Practical experiments results . . . 98
7.5.3 Threats to validity . . . 105
7.5.4 Conclusions . . . 106
7.6 Domain experts validation . . . 107
7.6.1 The results . . . 107
7.7 Summary and discussion. . . 109
8 Conclusions and Future Work 111 8.1 Conclusions . . . 111
8.2 Future Work . . . 112
A Additional Information 119 B Usability Tests: Additional Material 125 B.1 End user closing questionnaire . . . 126
B.2 Domain expert closing questionnaire . . . 127
List of Figures
1.1 Generic architecture. . . 4
2.1 On the left side a depiction of Model-Based Engineering, on the right side a depiction of Model-Driven Development . . . 9
2.2 Overview of a Software Product Line [GS03] . . . 10
2.3 Business Intelligence generic architecture adapted from [KR02] . . . 11
2.4 Conceptual cube. . . 14
2.5 Cube slicing . . . 14
2.6 Cube dicing . . . 14
2.7 Star schema generic example . . . 16
2.8 Dragging and dropping dimensional attributes and facts into a report. Im-age and example taken from [KR02]. . . 17
2.9 Examples of graphical data representations . . . 18
2.10 Mobile development approaches [OE15] . . . 21
2.11 Mobile BI Architecture . . . 24
2.12 Mobile BI Dashboard example. The end user does not have the features to generate new widgets nor to configure the dashboard presentation . . . . 25
3.1 Gartner on self-service tools and type of users. Adapted from [Sch] . . . . 28
3.2 SAP WEBI. First the end user interacts with Query Panel to model the data-set. Then the data is available to explore in the Report Editor . . . 30
3.3 Tableau Desktop. Dragging of fields to property shelves. This interaction generates a visual component . . . 31
3.4 Dashboard construction with drag-and-drop actions over pre-defined wid-gets and into the dashboard panel . . . 33
3.5 Card-View template configuration . . . 34
4.9 UI of a generated widget . . . 45
4.10 Homologous VS Current By Year: generated widget example. . . 46
5.1 Abstract Syntax: Each widget has its specific Data Mapping properties . . 51
5.2 Abstract Syntax:The Function and Condition are common properties . . . 52
5.3 Abstract Syntax:Properties of the Line, Bar and Area chart. For sake of sim-plicity the other elements were hidden, namely the Data Block and Meta-Data . . . 54
5.4 Abstract Syntax:Properties of the Pie Chart . . . 54
5.5 Abstract Syntax:Properties of the Heat Map . . . 54
5.6 Abstract Syntax:Properties of the Pivot Table . . . 55
5.7 Abstract Syntax:Properties of the Drop Down Filter . . . 55
5.8 Abstract Syntax:Meta-Data. . . 57
6.1 Implemention Stages . . . 62
6.2 Designed architecture instantiated with the technologies . . . 67
6.3 Pie chart basic example: The Editor renders the containers for the Sectors and Quantity properties based on the meta-model . . . 69
6.4 Standalone Modules: EVL Standalone Module loads the user instantiated model and the well-formed rules files for Model-Validation. EGL Stan-dalone Module loads the user model and the widget template for Model-To-Code-Generation. Both uses the JSON Driver to integrate the model instance with the Epsilon features. . . 71
6.5 Widget internal structural relationship . . . 73
6.6 Model of a specific example: Area chart showing the billed amount by region and year. Each year is a serie, i.e, an area. . . 75
6.7 Data mapping process for the area chart example, when executed in the Target Platform. . . 75
6.8 HVSC-Y asset data-flow . . . 78
6.9 Overview: Server internal structural relationship . . . 80
6.10 Widgets Metadata . . . 82
6.11 Overview: Extended Target Platform structural relationship . . . 82
6.13 Generating a Widget . . . 84
6.14 Saving the Widget . . . 85
7.1 General procedure for the modeling language evaluation . . . 92
7.2 Multiple choice: first question . . . 94
7.3 Multiple choice: second question . . . 94
7.4 Functions container after confirming the selected function . . . 95
7.5 Multiple choice: third question . . . 95
7.6 Multiple choice: fourth question . . . 96
7.7 Time spent for each subject . . . 98
7.8 Time measures, with error bars . . . 99
7.9 Task-Completion Rates . . . 100
7.10 Number of Errors by Type and Severity Level . . . 102
7.11 Top N Wrong Configuration . . . 103
7.12 Incorrect interaction with the container. In this example the subject touched far away from the button to open the meta-data list. Claiming that, the en-tire container should be touchable. . . 104
7.13 Answers regarding the hardest question . . . 105
7.14 Appreciation regarding the Editor features . . . 109
A.1 BI Concepts Model . . . 120
A.2 Solution overview . . . 121
A.3 Conception stages of the prototype . . . 122
List of Tables
1.1 Challenges description - Adapted from [Cha+13] . . . 2
3.1 User empowerment tools comparison. Table constructed based on the tools study . . . 36
5.1 Blocks concrete syntax . . . 58 5.2 Concrete syntax regarding the common and specific properties. The icon
on the top right corner, indicates the type of data-blocks that each container accepts . . . 58
6.1 Server REST API . . . 79
Listings
6.1 JSON meta-model example describing the properties of the line bar and area chart . . . 62 6.2 JSON meta-model example describing the properties of the pie chart . . . 62 6.3 JSON meta-model example describing the properties of the heat map . . . 63 6.4 JSON Meta-model example describing the properties of the pivot table . . 63 6.5 Meta-model example describing the properties of the drop down filter . . 63 6.6 Meta-data excerpt describing the case study multi-dimensional model . . 64 6.7 Model instance describing a line-chart . . . 65 6.8 Editor HTML Document and Angular ngRepeat and ngBind Directives. . 68 6.9 Well-formed rule excerpt - EVL Syntax. On thecheckclause the EVL rule
is specified. On theMessageclause a customized message is written to be presented to the end user when the rule is violated. . . 72 6.10 Pseudo template for query generation - EGL plus SQL syntax . . . 74 6.11 Excerpt of the query generated for the specific example of the figure 6.6,
for the year 2016 serie. When executed on the Target Platform, it returns the data-set. . . 75 6.12 Overall pseudo template for the area chart. Including the data mapping
process - EGL and Javascript syntax . . . 76 6.13 Example of an extended SQL query - with a Condition and a Top 10
1
Introduction
The ever-increasing innovation in mobile technologies is leading to more services being offered to end users, either for personal or professional purposes. It is no novelty that the organizations recognize this trend and the opportunities in their business activities, namely the possibility of empowering customers, partners and employees, wherever the location and the context of the moment [SM03].
Business Intelligence (BI) is no exception [MPM15]. Converging BI and mobility, re-sults in the opportunity to manipulate corporate data and deliver useful knowledge any-where and anytime, leveraging the productivity of domain users using ubiquitous ap-plications that provide a presentation of business related information elements as key performance indicators (KPIs), dashboards or reports.
Table 1.1: Challenges description - Adapted from [Cha+13]
Challenge Description
Mobile development cost
The vast diversity of existing devices makes the develop-ment expensive in terms of time and resources costs. For instance, how to construct an application compatible with multi-platforms?
Data availability It is important that mobile applications deliver available and up-to-date information, regardless of possible offline status and locations.
Dealing with mobile re-sources limitations
Resources of mobile devices typically are more limited in comparison, for example, with desktop computers. Stor-ing, processing and rendering can be a problem if the de-vice cannot cope with the volume of the data and dimen-sions of the visual components.
User empowerment Self-service solutions bring challenges as end users are not required to have the technical knowledge to make proper use. Thus this tools must abstract the complexities as well as offering expressiveness focused on the problem space of the domain.
Corporate information security
Data mobility and user empowerment brings security con-cerns related to the business information, as unauthorized users could easily access and explore the corporate data.
1.1
Problem Statement and Motivation
Given this set of challenges, we will focus on the user empowerment issue in the context of analytical components construction, for mobile devices. As aforementioned, the devel-opment of mobile applications requires considerable amount of effort and a background of knowledge that requires technical expertise, affecting the end users productivity.
For instance, Novabase1, an IT organization, based on the current technology trends and aligned with their organizational opportunities, has currently developed a Mobile BI solution for the energy sector, targeted to business users for monitoring purposes,
1
through dashboard visualization on tablet devices. The motivation was to have a cus-tomizable and extensible solution where they have full control regarding which com-ponents are delivered to the clients. However, the analytical content delivered is pre-defined and strictly coupled with the business concepts, which means that, the current prototype does not provide any means of user customization and self-construction of analytical components. The user empowerment is an important characteristic because they, better than anyone, know what information they want to visualize. To cope with the constant user needs, the current architecture would require the allocation of IT re-sources on maintenance tasks that would be better allocated on horizontal improvements of the application. Also, as a consequence of developing pre-defined analytical compo-nents, if new clients arise, the contents will need to be rebuilt, namely the data queries and the data mapping on the visual properties. By conceiving a strategy, on which the business users are empowered with the ability of configuring generic components, these challenges will be covered.
The current state-of-the-art related to the topic of business user empowerment, on BI domain, is quite vast. Most of the existing technologies provide several approaches to tackle all the challenges previously mentioned. Despite the capability to provide ex-tensive and powerful analytical features, some of the tools follows a "One size fits all" approach, in the sense that they provide a means of data analysis that fits all type of users, from regular to advanced users. This is why, the author on [Eck13] argues, based on statistical results from a survey made on 2012, that this tools are difficult to use for business users.
Similarly, Imhoff counsels BI managers with an example: to provide a buffet of BI components. The goal is to BI teams construct a starter library of contents as part of a self-service BI system, so business users can pick and choose what they need based on their requirements.
At this point we can formulate our research question in the following way: Is it possible to empower the users so that we can establish a mean of cooperation between the business and IT groups?
1.2
Objectives
The objective is to define a way to solve the business user empowerment issue in a context of mobility. It will be analyzed an approach of cooperation between IT and business users, to provide a level of freedom that enables the latter to build analytical components, based on the customization of templates (assets). The final goal is to deploy and integrate those components on a host mobile application optimal for tablet devices.
play the role of product line developer, to define the assets. The business users, which will be considered as the DSML end user, will consume those assets in order to define the variable aspects, by customization of the analytical widget template.
In fact, the Model-Driven Development concept will be the core of the solution as it will enable the end users, who are not required to have technical skills, to develop their analytical components thanks to the key concept of model-to-text transformation that will generate the code from the model specification. On top of that, a vast quantity of traditional model manipulations will be available to cover other specific goals. As such, this strategy, besides covering the research question, also brings the opportunity for further research and development to address additional uses cases with a model based solution.
Figure 1.1: Generic architecture
1.3
Context
This work will be developed in the context of a project at Novabase, an IT company specialized in software development. Historically, this company was born in 1989 as a start-up. During the second half of 1990, has positioned as an umbrella organization, constituted by a network of enterprises.
In particular, our work will focus on Energy&Utilities sector, in the Energy Core Solu-tions team (ECS). The ECS team is vast and has a strong background of scientific, techno-logical and business knowledge, resultant from several years of experience on construct-ing solutions for this sector.
1.4
Contributions
As primary contributions, it is expected the following:
• Development of a prototype for BI whose core will be aligned with the concepts of Model-Driven Development, offering a Domain Specific Modelling Language that will serve as the support for end user customization and inspired by the concepts of Software Product Line;
• Conception of a prototype solving the user empowerment issue, and aligned with the portfolio of solutions of the department;
• Review and extension of the current mobile prototype implemented by the ECS department;
• Conception of an usability evaluation whose lessons learned will also serve as input and baseline for future work.
1.5
Document Structure
The dissertation is structured on the following way:
• The chapter 1 introduces the reader on the theme of this thesis, presents the problem statement and delineates the objectives and contributions of this work;
• In chapter 2 is provided a theoretical and technical background of concepts related to this dissertation;
• In the chapter 3 is presented the related work concerning the user empowerment issue in the Business Intelligence area;
• The chapter 4 introduces a case study example which will be used throughout the dissertation. Additionally, we took advantage of the case study to present the over-all solution, which describes, in a generic perspective, the modules needed to con-ceive the prototype and the procedure for its construction. Lastly, it is presented the prototype front-end with a running example;
2
Background Concepts
In this chapter we cover theoretical and technical background concepts related with this dissertation. Foremost, we explain some theoretical concepts that align with the user em-powerment issue, then we perform a domain analysis by presenting theoretical concepts related with the Business Intelligence area. In the technical background the presentation of the first Mobile BI prototype developed by Novabase takes place, along with other rel-evant aspects like Modeling Frameworks used on the implementation of Domain-Specific Languages.
2.1
Theoretical Background
2.1.1 Model
Thomas Kuhne defines a model as "an abstraction of a system allowing predictions or inferences to be made" [Küh06]. This definition covers the generic idea of a model, as being a conceptual process that generalizes and describes a target object by capturing its essential properties [Küh06]. A model, must then, be capable of reducing unnecessary information, rather than just being a full copy of the original system represented.
A meta-model, on the other hand, is a model of another model [Küh06], just like a meta-data is data that describes other data1. Kuhne’s explains in [Küh06], that one can regard a meta-model as artifacts that defines the vocabulary and constraints used in models. Therefore, if a model is a conceptual process of a system, a meta-model is yet another abstraction that captures the general properties of one or several instances of models.
1
is oriented to a specific area of knowledge or activity, it concerns to a particular range of problems of a particular domain [Fow10].
Thus, it raises the level of abstraction in comparison with general purpose languages (GPLs)3, by addressing the specification directly to the concepts of the problem space. It sacrifices generality and flexibility in order to leverage simplicity, quality, the minimiza-tion of the accidental complexity and the increasing of the end user productivity.
Another important characteristic is the representation format readable by the end-users, also denominated as concrete syntax [Gre+04]. A DSL can have textual or graphical notation, that, in common, conforms to elements and rules defined on a abstract syntax.
2.1.2.1 Domain-Specific Modeling Language
Modeling languages provides the syntax and semantics to models. Domain-Specific Modeling Languages (DSML) limits the modeling specification (either textual or visual) to the concepts and properties of the domain.
2.1.2.2 Abstract Syntax
The abstract syntax defines the individual elements of a language and the rules that de-fines how those elements can be combined [Gre+04].
The abstract syntax is, therefore, a type of meta-model structure that captures, in a abstract form, the domain properties of the DSL.
With the definition of the abstract syntax it is possible to define several instances of textual and graphical concrete syntaxes that are scoped to the concepts related with the domain. This is useful when the development of the DSL is concerned with the involve-ment of the domain users, as a list of options, towards the more suitable concrete syntax.
2.1.2.3 Concrete Syntax
The concrete syntax is the format of the language, is what the user interacts with [Voe+13], the general categories are textual or graphical. Textual syntax tend to be more flexible in terms of detailed formalizations, like algorithms. Graphical notations, on the other hand, are better in describing concepts like relations or flow [AH10]. However, the choice is not
2http://www.oxfordlearnersdictionaries.com/definition/english/domain 3
mutually exclusive, i.e, a language can be represented via textual and graphical format, synchronized with each other, to present different levels of formal specifications.
2.1.2.4 Transformations
The author on [Gre+04] defines transformation as "a process that creates or modifies one or more output specifications, from one or more input specifications". Thus, given a model expressed with a modelling language, for instance with a DSML, a vertical trans-formation process can be used to generate a lower abstraction level of specification. This introduces the notion of Model Driven Development, as methodology of development based on models [Gre+04].
2.1.3 Model-Driven Development
The author on [Voe+13], refines the definition of model by pointing out two types of models, descriptive and prescriptive. A descriptive model is a representation of an ex-isting system, that can be used for requirement analysis and documentation purposes [Voe+13]. On the other hand, a prescriptive model is used to (semi)automatically con-struct the target system [Voe+13]. This characteristics introduces the concepts of Model Based Engineering (MBE) and Model-Driven Development (MDD), respectively.
MBE paradigm, is the case where descriptive models play an important role on the life-cycle of software development. However, these artifacts do not drive the develop-ment process, as they do not generate the impledevelop-mentation. The developdevelop-ment is rather code-driven, in the sense that, developers read the model and manually code the soft-ware, this is a tedious process and error-prone.
MDD solves this problem basing upon prescriptive models [Voe+13]. Rather than just representation artifacts, they raise the level of abstraction and drive the development pro-cess, based on model-to-text transformations to generate the implementation. Therefore, increasing user productivity and software quality.
features, built from a common set of production assets that captures the knowledge about how to produce the family members[Gre+04].
As represented on2.2, a product line development uses two distinct but collaborative development processes:
• Product line development: Defines the kinds of products developed (the product line scope), builds and supplies the production assets for the product development [Gre+04];
• Product development:Applies the aforementioned assets to produce products, and provides feedback to the upstream product line development for continuously im-provement of production assets [Gre+04].
Figure 2.2: Overview of a Software Product Line [GS03]
2.1.5 The Domain of Business Intelligence
a domain, wherein its concepts are horizontal to diverse business areas. Hence, it is fun-damental to understand this domain. As such, in this section we provide an explanation of concepts related to BI domain, which will be the support and the scope for the entire cycle of development.
The sources of domain knowledge were acquired from the literature of Business In-telligence and Data Warehousing area alongside with the collaboration of experts on the area.
2.1.5.1 Historical perspective of Business Intelligence
Historically, Business Intelligence (BI) was first defined by H.P Luhn in 1958. In his pa-per, he describes an automatic system, denominated as Business Intelligence System, to distribute information to different organizational sections accordingly to their interests and needs. He starts by defining the term Business as a "collection of activities carried on for whatever purpose" and Intelligence as the "ability to apprehend the interrelationships of the presented facts in such a way as to guide action to a desired goal" [Luh58].
Later on, as new approaches to store data appeared (relational model by Edgar Codd in 1970) and easier ways to access and analyze information were provided by the emer-gence of data-warehouses and new set of tools offering decision support functionality, Howard Dresner based on Luhn’s ideas, refined the BI definition as an umbrella term that "includes the applications, infrastructure and tools, and best practises that enable ac-cess to and analysis of information to improve and optimize decisions and performance" [Ele11].
2.1.5.2 Business Intelligence Generic Architecture
Longbing Cao et al. on [CZL06], defines the process of constructing a BI system by ex-tracting, transforming and loading data stored in disperse enterprise information sys-tems (EIS), into a data warehouse (DW) for linkage with a visualization area. These com-ponents forms the generic BI/DW environment [KR02]
for "cleansing, combining data from multiple sources, de-duplicating data, assign-ing warehouse keys" [KR02];
• Analytical Repository: This is where the information is loaded to. It comprises an historical warehouse of data (DW), where the latter is organized, stored and available for data-driven support systems;
• Data access tools: This layer comprises the tools that access the stored data and supports the decision making processes of the users. It comprises tools like pre-defined and/or Ad-Hoc reporting, dashboards presentation, data-mining engines. [CZL06]
2.1.5.3 Data Warehouse implementation
The data warehouse objective is to provide a centralized, consistent, easily accessible and understandable source of historical information.[KR02]
Regarding the implementation, two paradigms arises: Immnon and Kimball approach. Both agree on having a central repository of information for decision support systems, the difference resides in how to design it.
The Immnon approach follows a top-down pattern. His proposal is to model a central enterprise data warehouse in a third normal form (3NF). Only then, the definition of sub-jected oriented, multi-dimensional and standalone data repositories takes place. These are defined as data-marts.
On the other hand, Kimball defends that normalization techniques used for designing operational systems should not be used to model data warehouses [KR02]. His proposal is to define a bottom-up approach, by designing multi-dimensional data-models that are linked together, resulting in a centralized enterprise and denormalized data warehouse.
Regardless the approach used, data modelling is an important milestone on the con-struction of data warehouses. It describes the properties and relations between entities, defines the structures that stores the information.
In analytical scenarios, the technique most used is multi-dimensional modelling
2.1.5.4 Conceptual Multi-Dimensional Model
From a conceptual view, a multi-dimensional model can be represented as a cube, as rep-resented in the figure2.4, or hyper-cube for more than three dimensions. The cells of the conceptual cube are the thinner elements, these represents the business measurable at-tributes that are bounded by the dimensions. The latter represents the edges of the cube, and give contextual information by providing multiple points of view and aggregation levels over the business related events. For example, sales amount of a specific product in a particular city by year, with the capability of drilling down to the month level.
The navigational features are possible with the definition of hierarchies. These struc-tures combines the dimension elements with parent-child relationships. It enables the analysis at different levels of aggregation. For instance, drilling down from sales amount by year to month or rolling up from week to month level, where the relationshipY ear↔
M onth↔W eekforms a hierarchy.
Operations through the cube: The cube and the hierarchies provides operations that leverages the analysis. Common operations are:
• Slice: It is, essentially, returning a square subset from the cube, by choosing a sin-gle value from the chosen dimension and retrieving the cells contained in it. For instance, returning sales amount from the year 2015 - figure2.5;
• Dice: It produces a cubic subset from the main cube, by picking multiple values from multiple dimensions - figure2.6;
• Drill down:It steps down the concept of hierarchy, aggregating the measures from higher and summarized to lower and detailed levels;
• Roll/drill up:It is the reverse of drilling down. Navigates from lower to higher and summarized levels;
Figure 2.4: Conceptual cube
Figure 2.5: Cube slicing
2.1.5.5 Relational Multi-Dimensional Model
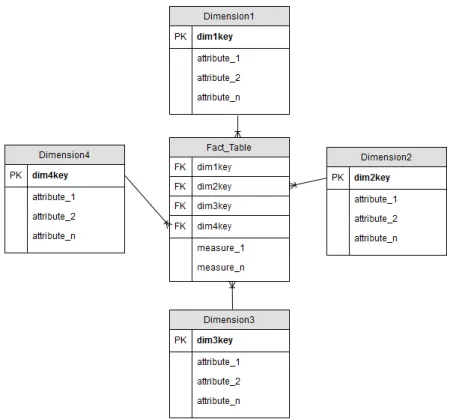
Relational databases managements systems (RDBMS) provides an approach to imple-ment the conceptual model, basing on the derivation of relational models like star-schema. These models are comprehended by fact and dimension tables that captures the logical properties and provides the basis for storing and querying the multi-dimensional data.
Fact-Table As depicted on 2.7, the fact-table is the central entity in multi-dimensional schema’s. It is constituted by registers that are structured, on one hand, by a set of numer-ical attributes, and on the other hand, by the composition of dimension foreign keys that, all together, forms the composite primary key of the fact table and identifies uniquely a business event.
The numerical attributes represents the business measures, that are complemented with the dimension keys. The latter is used to join with dimension tables, to contextualize the measures. Furthermore, the dimension keys defines the granularity of the fact table and tell us the what the scope of the measurement is [KR02].
For instance, given a range of registers of sales over the year of 2014 and 2015, analysing the data aggregated by year and month results in a fined grained data-set, when com-pared to analysing the data aggregated only by year.
Dimension Table Dimension tables comprehends the textual and key attributes that gives context to the facts through joining operators with the fact table. This entity can, also, embed hierarchical structures to enable the analysis of the facts over different di-mensional levels.
Facts and Dimensions As illustrated on the figure 2.7the fact-table is joined together with dimension entities, forming a star-like structure, often called a star-schema. The fact-table represents the central entity and expresses many-to-many relationships between dimension entities.
This relational modelling strategy provides the following benefits [KR02]:
1. Leverages the simplicity;
2. Introduce performance benefits;
3. Accommodates changes;
4. Enables a complementary nature between facts and dimensions.
Figure 2.7: Star schema generic example
2.1.5.6 Data Access layer
The data access layer provides access to the data-warehouse and support users in their decision-making activities with the manipulation of the multi-dimensional data [Pow].
An application belonging to this layer can be a pdefined or parameter-driven re-port, interactive applications like dashboards, advanced tools for visual analysis or data mining [KR02].
• Reports: Parametrized or pre-defined snapshots of information in a readable for-mat. The objective of a report is to present detailed information related to a specific subject, for analysis purposes [Her]. Reports are deployed manually by IT depart-ments, or scheduled for automatic generation and deployment;
• Dashboards: Dynamic information in a readable format. The objective of dash-boards is to provide a comprehensive overview of contextual and measured in-formation by presenting charts, maps, prompts for filtering, interactive features to navigate information and key performance indicators for goal tracking [Her];
• Analytical Widgets: A widget is a miniature application view that can be embed-ded in other applications4. A web-widget for instance, is a mini application that can be integrated on a web page. An analytical widget, is, therefore, a small and embeddable application for analytical purposes.
4
Figure 2.8: Dragging and dropping dimensional attributes and facts into a report. Image and example taken from [KR02].
Data visualization Visualization provides graphical representation of data, algorithms, processes. In particular, the visual representation of data provides an effective way to present raw data, leveraging the user visual sense. The common components used for data presentation are charts, table and maps.
Some examples of graphical data representations are:
• Line Chart:As illustrated on2.9(a), it is represented by a series of data-points con-nected with a straight line, this type of charts are most often used to visualize data that changes over time;
• Area Chart:As illustrated on2.9(b), it has the same concepts of the line chart, only it fills the area between the line and the origin Y value;
• Bar Chart: A bar chart presents grouped data with rectangular bars with lengths proportional to the values that they represent;
• Pie Chart: As illustrated on figure 2.9(c), it is a circular chart divided into sectors which is proportional to the quantity it represents;
• Heat Map: As illustrated on2.9(d), it is a two-dimensional representation of data where the individual values contained in the cells of the matrix are represented as colors. The intensity of the color changes, dynamically, based on the range of the values;
(a) Line Chart (b) Area Chart
(c) Pie Chart (d) Heat Map
Figure 2.9: Examples of graphical data representations
Key performance indicators A metric is a quantifiable attribute that can be measured to monitor business aspects, [Kau10] defines a metric as a "a quantitative measurement of statistics describing events or trends (...)". These attributes are typically located in the fact table.
Key Performance Indicators (KPI) is based on metrics and the strategic objectives de-fined by the organization. For [Kau10], the word "objective" is "critical to something being called a KPI". Thus, it is oriented towards a specific goal, to help business users to track performance. Hence, a KPI should be:
• Readable: Results should emphasize the meaning with versatile graphical visual-izations [FHK09];
• Enriched with context:Aligned with readability, "The indicator should be enriched with relevant context information", in order to leverage the interpretation [FHK09];
Mobile Business Intelligence The term Mobile BI is not recent. For some years that ubiquitous applications are used alongside with BI. However the devices were more lim-ited than nowadays, reporting and analysis tasks were, therefore, more constrained. With the increase of mobile device features, this topic gained prominence [AH10].
With reference to the features and capabilities that mobile devices offers nowadays and the concepts of Business Intelligence, the definition of Mobile BI aligns with: "The capability that enables the mobile workforce to gain business insights through informa-tion analysis using applicainforma-tions optimized for mobile devices."[VS13]
Mobile BI applications resides on the Data access tools layer. Typical usage models of this applications on BI are [AH10]:
• Alerts: Alerting of events;
• Push reporting: On demand or scheduled report deployment;
• Pull reporting: The users specify the type of data they want for analysis.
2.1.5.7 The users
The user community that interacts with corporate data is vast, from technical users to dashboard end-users. Many classifications are possible to depict, driven by dimensions like role, specialization area, cognitive capabilities, skills, data access and visualization needs to support their tasks.
However the categories can be generalized, covering the specific characteristics of each user. For instance, Kurt Schegel from Gartner, a marketing research company for information technologies, provided on [Sch] a study where it classified two generic types of users: Information consumers and producers.
Information consumers is a category that comprehends the users who gather infor-mation through operational and analytical applications, namely dashboards and reports, to support their activities [IW11]. Most of the time, producing content for reporting and analysis is not a priority because this users do not have the time, experience or the need to produce and analyse information for decision making [FHK09]. An example of con-sumer could be an executive who spends a good portion o his time away from his desk and wants to continuously keeping track about the performance indicators from his com-pany with pre-defined dashboards or reports[Eck11].
one or several measurable attributes, statistical functions and custom scripts. The latter is useful, for example, to monitor a KPI with the indicator from the current versus the ho-mologous year and to check if it is below a given threshold by mean of alerts. Users can also formulate questions that would require easy data navigation. For example, drilling the information, by zooming in and out at different levels of dimension hierarchies, for instance : "Products sold by year, month or day". Slicing the information by means of filtering, "How much was the profit, on day 24/12/2015?".
On other scenarios, it is possible to encounter questions that, despite of involving summaries over the data, requires specific systems to deal with specific requirements. For example, a continuous data-flow processing mechanism to provide responses in real-time:"Which products, were most frequently sold in the last 10 minutes, with a refresh interval of 10 sec? Provide a top 10". Other questions requires advanced algorithms, for instance forecasting, in order to answer questions like: " Given the today profit, how will it be for tomorrow?". Another example, would require geo-spatial features, for example: "In which areas the product is sold more often?"
2.1.5.8 Concepts Model
In the figureA.1is depicted a model describing, graphically, the concepts of the domain and some features that BI data access applications provides. For sake of space, the figure is located on the appendix A. The foreseen solution will be aligned with some of those concepts to express the necessary configurations to map data summary questions with the (semi) automatic generation of mobile analytical components.
2.2
Technical Background
2.2.1 Mobile Development Methodologies
The current methodologies and frameworks, on mobile development, offers to devel-opers different capabilities. As illustrated on figure2.10, they usually differ on the trade-off between platform independence and maximizing the user experience by accessing the features that are exposed through the device Application Programming Interface (API). By doing that, some approaches sacrifices important features like the capability to exe-cute regardless of the underlying platform or the powerful features that one specific API provides.
The state of art on mobile development, currently comprises the following method-ologies: Native Development; Cross-Platform Development; Web Development; Hybrid Development
Figure 2.10: Mobile development approaches [OE15]
2.2.1.1 Native Development
This method of development is oriented to a specific platform. Based on integrated de-velopment environments (IDE), the dede-velopment is driven by the supported language of the device operating system, for instance Java for Android platforms, C Sharp for Win-dows, Swift for IOS. The construction of a multi-platform application is, therefore, more expensive as it requires to organizations recruit various specialized developers with a broader technical knowledge related with the different platforms.
2.2.1.2 Web Development
because each platform has it unique style and flexibility. Therefore, it is still required some knowledge of each platform API in order to leverage the user experience.
2.2.1.4 Hybrid Development
Hybrid approach takes the best from web and native-development. It solves the multi-platform challenge by applying the notion of wrapping a web application in a shell that bridges the API of the device to the browser. Thus, despite of being a web application, it offers full access to the API, offering the same features as a native one. However, because it still is a web application, it fails at delivering the same performance and pleasantness as truly native applications.
2.2.2 The Target Platform
The target platform is a hybrid mobile application for Mobile Business Intelligence. It is based on the Ionic front-end framework, Angular JS as the client-code, Highcharts as the chart library, SQLite as the local data persistence and Cordova as the native bridge.
2.2.2.1 Related frameworks and technologies
Angular JS (Version one) 5 Is a Javascript framework for dynamic web apps. Essen-tially, based on its core features, it extends HTML syntax to makes the web-page more responsive to user interaction. It is based on separating the presentation layer with the business logic, following a kind of Model View Controller (MVC) or Model View View Model (MVVM). The author on [Min12], discusses that, the Angular JS framework does not implement this patterns in the traditional sense, rather the developers of this frame-work document the pattern as a Model-View-Whatever (MVW), in the sense that the developer can choose which Model-View pattern to use, based on their preferences or requirements.
Example of documented core features of Angular JS are6:
• Controller: Javascript functions that are bound to specific scope objects;
• Scope:Objects that represents the model. They are the glue between the controller and the view;
5https://angularjs.org/ 6
• Data Binding: Is the automatic data-synchronization between view and model. This way, the view is the projection of the model, at all times. The Angular JS framework provides a strategy for synchronization where any changes on the view are reflected on the model and any changes on the model are propagated on the view, this approach is documented as Two-Way Data Binding;
• Services: Singleton-objects that are bounded and instantiated in the application. For example the $http7Service to communicate with remote HTTP servers;
• Directives: Directives are HTML markers, like elements, attributes. It can be used to create new custom page components. Angular JS comes with a set of built-in directives, like the ngIf8 directive, that recreates or removes a portion of a HTML element, depending on the result of evaluating a conditional expression.
Apache Cordova 9 It is a fork from the Phonegap project. It is an open-source mobile development framework, that allows the development of web applications using stan-dard technologies (HTML5, CSS3, Javascript) and the deployment on mobile devices, regardless of the platform. Essentially, it acts as a wrapper that bridges the web applica-tions with the API of mobile devices.
SQLite 10It is library that implements a lightweight SQL database engine. It can be eas-ily integrated in native wrappers like Cordova with the support of plug-ins and accessed with Javascript APIs.
Ionic 11 It is a framework aimed to hybrid mobile applications user interface devel-opment, with HTML5. The goal is to provide to users a look-and-feel of native mobile applications, when actually is web-based. It relies on Angular JS for core functionality and on native wrapper technologies like Phonegap and Cordova.
Highcharts 12It is a library of charts written in pure JavaScript, offering an easy way of adding interactive charts to web applications. It has a wide variety of charts configurable and customizable with Javascript Object Notation.
• Capacity of providing the visual information in a quick and efficient manner;
• Synchronize the corporate information with a remote server;
• Be capable of execute, regardless of the platform.
To realize these goals, the prototype was implemented as a hybrid mobile application and its technological stack is formed by the web-development technologies like HTML5, CSS3, Javascript, front-end frameworks like Ionic and AngularJS (Version one), High-charts library for data-visualization, backstage core components like the Apache Cor-dova wrapper and SQLite Database Management System for local data persistence and management. The architecture is illustrated on figure2.11.
Figure 2.11: Mobile BI Architecture
In addition, outside of the core scope of the Mobile BI project, it was implemented a server to synchronize the data with the target-platform.
on figure2.12. The user interacts with the dashboard by choosing which data to present, based on drop-down menu filters.
Figure 2.12: Mobile BI Dashboard example. The end user does not have the features to generate new widgets nor to configure the dashboard presentation
2.2.3 Modelling tools
Modelling workbenches provide a simplified way to develop DSLs. There is a wide spec-trum of choices, among which: GME14; MetaEdit+15; AtomPM16; EMF17.
2.2.3.1 EMF
EMF, for instance, stands for Eclipse Modelling Framework and is a modelling frame-work and code generation facility to build tools and other applications based on models. The Ecore is the core meta-modelling notation and it is used to describe EMF models.
With the support of Graphical Modelling Framework (GMF)18, is provided a genera-tive component based on model-driven approach and a run-time infrastructure to build graphical editors based on EMF.
14http://www.isis.vanderbilt.edu/projects/gme/ 15http://www.metacase.com/products.html
16http://www-ens.iro.umontreal.ca/ syriani/atompm/atompm.htm 17https://eclipse.org/modeling/emf/
18
• Epsilon Validation Language (EVL):It is a model validation language built on top of EOL;
• Epsilon Generation Language (EGL):It is a template-based language, built on top of EOL, for code generation and other textual artifacts, from model specifications.
Despite being extensively used with EMF, it is not bounded to this framework. In particular, Epsilon can be extend with the support of additional technologies, for example XML or JSON. The Epsilon Model Connectivity was conceived for this effect. The Epsilon developers defines EMC as an open model connectivity framework which developers can extend with support for additional types of models/modeling technologies by providing respective drivers.
2.3
Summary and discussion
In this chapter we described the fundamental concepts which are the support for the solution development. Besides that, such concepts are crucial to read the document and to understand the solution.
We started by describing some theoretical concepts such as MDD, DSLs and SPL. Then, we performed a domain analysis encompassing the concepts of BI, which ended with a conceptual model -A.1- describing those concepts, graphically. Lastly, some tech-nical aspects were presented including the detailed presentation of the first prototype, introduced in the first chapter -1.1.
Technically, the solution should reside in the extension of the first prototype in order to address the user empowerment issue. The MDD, DSLs and SPL topics, together, aligns with and tackles this issue by providing the concept of domain-specific abstractions and automation to shield the end users from aspects related with GPLs, thus leveraging their productivity. Therefore, these theoretical concepts can be and will be used on this matter. Nonetheless, before we start to delve into the theoretical and technical details of the foreseen solution, a study comprising the state of the art on the user empowerment issue in BI must be conducted. The results of such study will inspire us to identify what kind of solution aligns better with the context of the problem. The next chapter will cover this point.
19
3
The User Empowerment on Business
Intelligence
In this chapter is described the state of the art related with the user empowerment issue on Business Intelligence. Such related approaches on this topic will clarify the kind of solution which is better aligned with the context of the problem.
As seen previously in the BI domain analysis - 2.1.5 - reports and dashboards are some of the applications that provides access to data. However, constructing them, tra-ditionally requires some level of technical expertise that some users do not have. As aforementioned, this affects both types of users: the technical and the non-technical.
Mobile BI can be considered as an approach to solve the user empowerment issue. In the sense that, end users are not chained to their working place to monitor their corporate information. However, this capability, by itself, does not solve the problem regarding the need of constructing new analytical components, on demand.
This is were the Self Service BI acts. It is a set of facilities that follows a "Do It Your Self" paradigm. Empowering business users to answer their information needs, on-demand, becoming more "self-reliant and less IT dependent" [IW11].
3.1
Categorization
The technological state of the art related this topic is immense. A categorization is de-picted on figure3.1. It explains the category of tools oriented to self-service reporting and data-analysis.
Figure 3.1: Gartner on self-service tools and type of users. Adapted from [Sch]
3.1.1 Interactive Reports and Dashboards
Interactive reports and dashboards delivers some empowerment level, as users can ma-nipulate the data that is fed to visual components by means of filtering and navigation features. Nonetheless, sometimes, there is a need of deeper analysis to answer questions not initially addressed by reports or dashboards. This, brings the need for facilities which facilitates the construction of new analytical components.
3.1.2 Ad-Hoc querying
Ad-hoc querying is a Business Intelligence model that solves the aforementioned prob-lem. It empowers the domain users by enabling them to answer specific questions, on-the-fly, and in a self-dependent manner. Example of facilities that fall on this category are the Ad-Hoc reporting tools, used for instance, to create a short report to analyse the reported information, or to complement an IT pre-defined report, in order to gain a deep understanding of a specific evidence.
However, this model is usually limited to the BI architecture and standards instanti-ated by technical people. This way, the empowerment is not sufficient if the user wants full control over the data, from its source to visualization, for example to easily blend information from multiple sources and present it in a single dashboard.
3.1.3 Data Discovery
The main advantages of this set of tools resides in the possibility of mashing up differ-ent sources of data and extract knowledge for ad-hoc analysis, without the full support of complex processes from IT departments to extract transform and load the information on presentation areas.
In theory, this family of tools are the ones which, typically, provides more freedom. However, in practice, it over empowers the business users, resulting in tools which are too difficult to use correctly by some users, or which does not complies with governance rules of the organization.
3.2
Example of Tools
The state of the art in Self-Service and Mobile BI is vast. Most of the existing solutions unifies this two worlds by providing back-office platforms for construction and deploy-ment of the analytical components.
3.2.1 SAP Web Intelligence
SAP Web Intelligence (WEBI)1 is a self-service tool for ad-hoc reporting. It belongs to Business Objects (BO)2, a former software company, that now belongs to SAP group.
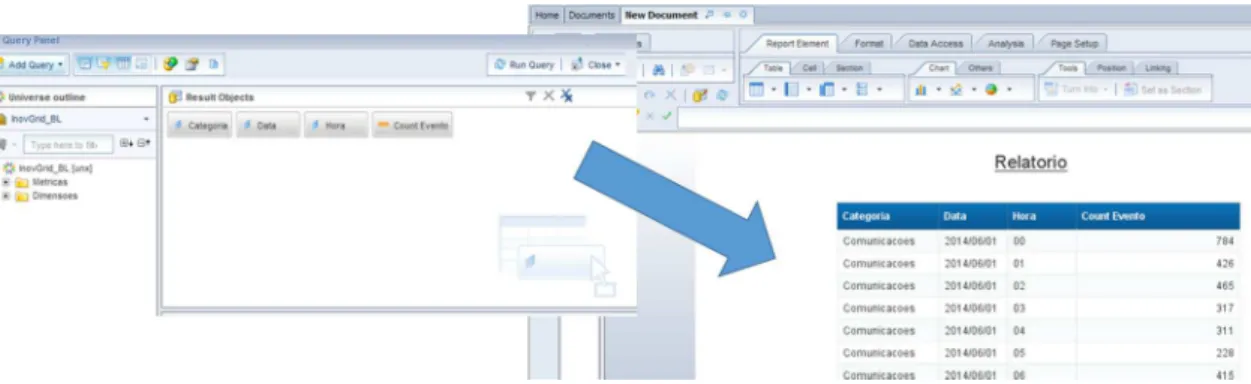
It is web-based and without any programming knowledge, users can construct and export reports with an interface optimized for usage in desktop computers. It provides two main modules, known as Query Panel and Report Editor, respectively depicted on figure3.2. The Query Panel goal aligns with concept of the complementary nature be-tween facts and dimensions studied on the Domain Analysis (section2.1.5.5). The goal is to pre-model a data-set with drag-and-drop actions over blocks that represents the at-tributes from the data schema, into a drop-down area which receives the dropped blocks. This interaction generates a data-set for further exploration in the Report Editor. The lat-ter enables the users to create fast reports based on "for this purpose" (Ad-Hoc) queries over the pre-defined data-set and conforming to the business terms defined in the seman-tic layer, denominated as Universe.
The semantic layer is a configuration module that manages information about the connection with the data-sources, the relying data-models and its notations, namely the names of each entity attributes. These notations can be translated onto simplified and common terms, related with the business area. This brings advantages because the busi-ness user is most likely to be familiar with those terms. Nonetheless, due to the technical concepts and knowledge that this task requires, the configuration of the semantic layer is assigned to the IT staff, and depending on the size and complexity of the requirements, it can be a slow task.
1http://go.sap.com/product/analytics/bi-platform/web-intelligence.html 2
Figure 3.2: SAP WEBI. First the end user interacts with Query Panel to model the data-set. Then the data is available to explore in the Report Editor
3.2.2 Tableau
Tableau Desktop3is a self-service data-discovery tool. It was born in an academic envi-ronment and was evolved from a system called Polaris [HM07]. The goal of the Polaris system was to provide an easy exploratory visualization interface to let users navigate data in multi-dimensional relational databases. It is now commercialized by Tableau and its features are now extend by Tableau Desktop, one of the reference tools for self-service BI. Its powerful features of data manipulation and visualization provides to users a platform suitable for basic to complex visual analysis, not just a system to create high quality visual components [HM07]. The main module of Tableau Desktop is the visual query language, denominated as VizQL. It is the run-time module and conforms with an abstraction layer that captures the meta-data required to access the data-sources and to describe the data model, classifying its attributes, based on heuristics, as measures or dimensions. As represented on figure3.3, the interaction with the visual query language is made with drag-and-drop actions over the blocks and into shelves that receives the dropped attributes, from which is generated the data-visualization.
3.2.2.1 Tableau Mobile
Tableau Mobile4enables users visualize and interact with content, on the go. It provides access to the data-visualizations deployed on the server.
3.2.3 SAP Lumira
SAP Lumira5follows the same paradigm of Tableau. It is a desktop-based, data discov-ery tool. Based on a explicit sequence of steps, it enables users to acquire, manipulate, visualize data through charts or maps and compose dashboards that can be shared with other users.
In order to enhance the user-friendliness, the work flow is guided by four steps:
3http://www.tableau.com/products/desktop 4http://www.tableau.com/products/mobile 5
Figure 3.3: Tableau Desktop. Dragging of fields to property shelves. This interaction generates a visual component
• The first one is data acquiring. This tool provides a set of connectors that enables users to gather data from multiple data-sources;
• Data prepare is another step of the flow. This phase enables users to enrich the acquired data-set before building the visualizations;
• Then, users can easily create visualizations based on a set of pre-defined analytical components like charts, tables or maps. To populate this components, Lumira also provides a visual query language, based on drag-and-drop actions over the data-schema attributes;
• The final step is sharing the information. The user can compose dashboards and reports to share with the organization.
3.2.3.1 SAP BO Mobile
SAP BO Mobile allows the visualization, on mobile devices, of content built on back-office and deployed on server.
3.2.4 Datazen
Datazen6is a Mobile Business Intelligence solution that was built to enable a rapid pub-lishing of BI content such as, KPIs and dashboards, at the same time as granting a good user experience, independently of screen dimensions. Despite of not being, officially clas-sified as a Self-Service BI solution, it offers some degree of freedom to users by integrating an administration panel for KPI construction and a publisher platform for dashboard de-signing and deployment, which is accessible on back-office context, on desktop devices.
6
• Goal: This value is used for comparison with the current value, it enables to end-users to visualize how far they are from a defined goal;
• Status: Defines a dynamic style event alerting when the indicator reaches some threshold, for instance to notify if the current value has exceeded a specific goal threshold.
This variables can be instantiated manually with static values or generated from tex-tual query specification, for example in Structured Query Language (SQL) syntax. Each KPI can be associated with one or more dashboards, enabling end users to visualize the indicator.
3.2.4.2 Construction of Data-Views
Based on the specification of textual queries at back-office, is possible to define an in-termediate layer of data-views. This views can be parametrized when designing the dashboard, shaping the scope of information to be presented by the widgets.
3.2.4.3 Datazen Designer
Datazen Designer is a back-office platform for dashboard construction, on desktop de-vices. The main features provided by this component are:
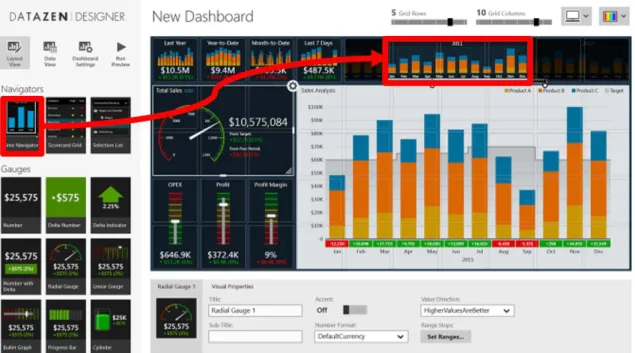
• Layout Designing: As represented on figure3.4, based on drag-and-drop actions and a grid layout, users can place widgets on grid cells and adjust its size dimen-sions. Each draggable widget has a specific role on the dashboard. For example, the Navigator is used to store the parameter values to filter the presented informa-tion. The Gauge is used to show indicators, Chart for data visualization and Map to present and to enable interaction with spatial data.
Each widget has its visual properties, like title, sub-title, type of numeric values, series visualization (bar,line,area). These are defined with the selection of options in menus.
Figure 3.4: Dashboard construction with drag-and-drop actions over pre-defined widgets and into the dashboard panel
3.2.4.4 Datazen Viewer
The viewer platform connects to Datazen server and provides to users, read access to published dashboard and KPIs, in desktop or in mobile devices.
3.2.5 Roambi
Roambi7 is another Business Intelligence solution designed for mobile devices, it offers features that leverages the user interactivity. It also offers some level of freedom to users with a back-office content publishing web-platform, on which is incorporated a user in-terface optimized for running on desktop or mobile web-browsers, on which the users can design and publish dashboards for usage in mobile devices. For this purpose, it dis-poses a set of configuration dashboard templates. These templates are configured on the publisher and then deployed and accessible on mobile devices.
Examples of dashboard templates are:
• Pulse Template: The concept is to present a master-detail panorama. This idea is realized based on the presentation of interrelated KPIs. In addition, each KPI is re-lated to a detailed dashboard that presents the indicator evolution over time. The configuration of a pulse dashboard follows a style of a fill-in-the-blanks configura-tion, based on the meta-data attributes, extracted from the data-source;
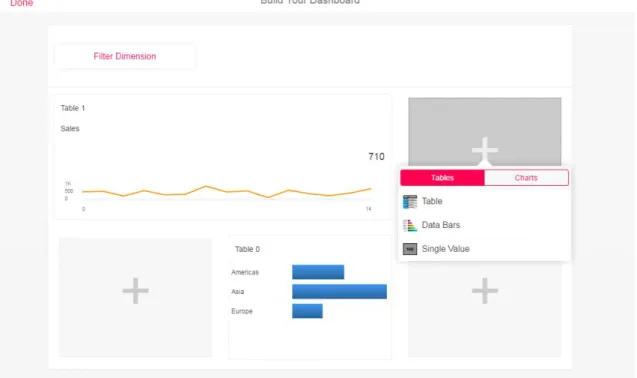
• Card-View Template: Editor with a grid interface, enables users define and place
7
Figure 3.5: Card-View template configuration
3.3
Summary and discussion
In this chapter we presented examples of technologies towards the user empowerment issue on the Business Intelligence domain. Examples were provided based on the cat-egorization depicted initially, wherein the difference between each tool resides on the balance between IT dependency and the user autonomy. As common characteristics, all solutions recognizes the potentiality of mobile BI applications, providing content pub-lishing for mobile devices.
Given the tools described, the ones that provides more autonomy from the IT staff-Tableau Desktop and SAP Lumira - typically have the higher expressiveness in terms of data manipulation, being able to cover a vast spectrum of user visualization needs. The majority, relies on the usage of visual query languages, in order to leverage the visual sense of the user, and on data-blending features, to analyse data from different sources of data, with the minimum IT involvement as possible.
for mobile deployment.
It is important to note that, despite the differences between the technologies analysed, they are not mutually exclusive, but instead, they usually can be used to complement each other. For instance, tools like Roambi or Datazen are better suited for business users who spends most of their time travelling and usually does not have the time nor the inclination to access detailed tools like SAP WEBI to gather simple insights. Thus, these tools can be combined, such that, technologies like SAP WEBI can be used to construct deeper and detailed analysis by BI consultants and tools like Roambi used by the business users to construct and visualize quick analysis for mobility contexts.
Hence we can conclude that, our vision is aligned with the Roambi and Datazen so-lutions. However, we will not focus on conceiving a final product with a closed set of libraries and features. But, instead, we will invest on a mean of cooperation between the business people and the domain experts. These both actors will, then, perform different roles towards a similar end, which is to empower the end user.
The Software Product Line can be applied to conceptually describe this idea. The product line scope is maintained by the domain experts to develop the production assets, regarding the business requirements and needs. The production assets are supplied for product development, being accessible for business people who will perform the product developer role to generate the final product, which is the analytical widget. This coop-erative strategy brings advantages when it comes to situations where the client wants to be empowered, and has specific requirements which requires specific analytical compo-nents. Since the user empowerment is an important feature, the product line developer would define a production assets scope, so that, it provides assets that are aligned with the requirements, but are generic enough to be used and configured by the end user based on his preferences, with the final goal of generating his product.
![Figure 2.8: Dragging and dropping dimensional attributes and facts into a report. Image and example taken from [KR02].](https://thumb-eu.123doks.com/thumbv2/123dok_br/16529803.736257/41.892.272.665.131.424/figure-dragging-dropping-dimensional-attributes-report-image-example.webp)


![Figure 3.1: Gartner on self-service tools and type of users. Adapted from [Sch]](https://thumb-eu.123doks.com/thumbv2/123dok_br/16529803.736257/52.892.163.690.202.451/figure-gartner-self-service-tools-type-users-adapted.webp)