Universidade do Minho Escola de Engenharia Departamento de Inform´atica
Jo˜ao Carlos Sequeira da Costa
Development of an automated pipeline
for meta-omics data analysis
Universidade do Minho
Escola de Engenharia Departamento de Inform´atica
Jo˜ao Carlos Sequeira da Costa
Development of an automated pipeline
for meta-omics data analysis
Master dissertation
Master Degree in Computer Science
Dissertation supervised by
Andreia Filipa Ferreira Salvador
Miguel Francisco Almeida Pereira Rocha
A G R A D E C I M E N T O S
Ao fazer esta tese, pude contar com o apoio de v´arias pessoas sem as quais este trabalho seria apenas uma sombra do que se tornou. Este ´e o meu obrigado a quem em mim acreditou.
`
A Andreia, pois sem uma boa orientadora muito dificilmente se faz uma boa tese. Tanta correc¸˜ao foi sempre bem aplicada, se n˜ao pela minha falta de conhecimento, pelo menos pela minha teimosa desatenc¸˜ao. A uma orientadora exigente at´e `a ´ultima mensagem, que nunca deixou de acreditar em mim, o meu obrigado.
Ao professor Miguel, mentor dispon´ıvel para todos os momentos em que se requeria a sua atenc¸˜ao. A um excelente professor, o meu obrigado.
Ao V´ıtor, que quando eu estava a um passo da soluc¸˜ao, ajudou-me a resolver problema atr´as de problema. A um bom amigo, o meu obrigado.
`
A minha Catarina, parceira nas alturas entusiasmantes, em que tudo corria bem, e nas complicadas, em que tudo era desafio. A ti, que aturaste tudo o que em mim havia a aturar, e que tamb´em nunca perdeste a tua confianc¸a em mim, o meu obrigado.
Porque quando o trabalho aperta a fam´ılia costuma ser a primeira a ficar `a distˆancia, aos meus pais, que para tudo se prontificaram para ver o seu filho dar o ´ultimo passo rumo a mestre. A quem devo tudo, o meu obrigado.
E a Deus. Porque me mostras o caminho.
A B S T R A C T
Knowing what lies around us has been a goal for many decades now, and the new ad-vances in sequencing technologies and in meta-omics approaches have permitted to start answering some of the main questions of microbiology - what is there, and what is it do-ing? The exponential growth of omics studies has been answered by the development of some bioinformatic tools capable of handling Metagenomics (MG) analysis, with a scarce few integrating such analysis withMetatranscriptomics (MT)orMetaproteomics (MP) stud-ies. Furthermore, the existing tools for meta-omics analysis are usually not user friendly, usually limited to command-line usage.
Because of the variety in meta-omics approaches, a standard workflow is not possible, but some routines exist, which may be implemented in a single tool, thereby facilitating the work of laboratory professionals. In the framework of this master thesis, a pipeline for integrativeMGandMTdata analysis was developed. This pipeline aims to retrieve compre-hensive comparative gene/transcript expression results obtained from different biological samples. The user can access the data at the end of each step and summaries containing sev-eral parameters of evaluation of the previous step, and final graphical representations, like Krona plots and Differential Expression (DE) heatmaps. Several quality reports are also generated. The pipeline was constructed with tools tested and validated for meta-omics data analysis. Selected tools include FastQC, Trimmomatic and SortMeRNA for prepro-cessing, MetaSPAdes and Megahit for assembly, MetaQUAST and Bowtie2 for reporting on the quality of the assembly, FragGeneScan and DIAMOND for annotation and DeSEQ2 for
DEanalysis.
Firstly, the tools were tested separately and then integrated in several python wrappers to construct the softwareMeta-Omics Software for Community Analysis (MOSCA).MOSCA
performs preprocessing of MG and MT reads, assembly of the reads, annotation of the assembled contigs, and a final data analysis.
Real datasets were used to test the capabilities of the tool. Since different types of files can be obtained along the workflow, it is possible to perform further analyses to obtain additional information and/or additional data representations, such as metabolic pathway mapping.
R E S U M O
O objectivo da microbiologia, e em particular daqueles que se dedicam ao estudo de co-munidades microbianas, ´e descobrir o que comp˝oe as coco-munidades, e a func¸˝ao de cada microrganismo no seio da comunidade. Grac¸as aos avanc¸os nas t´ecnicas de sequenciac¸˝ao, em particular no desenvolvimento de tecnologias de Next Generation Sequencing, surgiram abordagens de meta- ´omicas que tˆem vindo a ajudar a responder a estas quest˝oes. V´arias ferramentas foram desenvolvidas para lidar com estas quest˝oes, nomeadamente lidando com dados de Metagen ´omica (MG), e algumas poucas integrando esse tipo de an´alise com estudos de Metatranscript ´omica (MT) e Metaprote ´omica (MP). Al´em da escassez de ferra-mentas bioinform´aticas, as que j´a existem n˝ao costumam ser facilmente manipul´aveis por utilizadores com pouca experiˆencia em inform´atica, e est˝ao frequentemente limitadas a uso por linha de comando.
Um formato geral para uma ferramenta de an´alise meta- ´omica n˝ao ´e poss´ıvel devido `a grande variedade de aplicac¸˝oes. No entanto, certas aplicac¸˝oes possuem certas rotinas, que s˝ao pass´ıveis de serem implementadas numa ferramenta, facilitando assim o trabalho dos profissionais de laborat ´orio. Nesta tese, uma pipeline integrada para an´alise de dados de MG e MT foi desenvolvida, pretendendo determinar a express˝ao de genes/transcriptos en-tre diferentes amostras biol ´ogicas. O utilizador tem dispon´ıveis os resultados de cada passo, sum´arios com v´arios parˆametros para avaliac¸˝ao do procedimento, e representac¸˝oes gr´aficas como gr´aficos Krona e heatmaps de express˜ao diferencial. V´arios relat ´orios sobre a quali-dade dos resultados obtidos tamb´em s˜ao gerados. A ferramenta foi constru´ıda baseada em ferramentas e procedimentos testados e validados com an´alise de dados de meta- ´omica. Es-sas ferramentas s˜ao FastQC, Trimmomatic e SortMeRNA para pr´e-processamento, Megahit e MetaSPAdes para assemblagem, MetaQUAST e Bowtie2 para controlo da qualidade dos contigs obtidos na assemblagem, FragGeneScan e DIAMOND para anotac¸˜ao e DeSEQ2 para an´alise de express˜ao diferencial.
As ferramentas foram testadas uma a uma, e depois integradas em diferentes wrap-pers de python para comp ˆor a Meta-Omics Software for Community Analysis (MOSCA).
A MOSCA executa pr´e-processamento de reads de MG e MT, assemblagem das reads,
anotac¸˝ao dos contigs assemblados, e uma an´alise de dados final
Foram usados dados reais para testar as capacidades daMOSCA. Como podem ser obti-dos diferentes tipos de ficheiros ao longo da execuc¸˜ao daMOSCA, ´e poss´ıvel levar a cabo an´alises posteriores para obter informac¸˜ao adicional e/ou representac¸ ˜oes de dados adi-cionais, como mapeamento de vias metab ´olicas.
C O N T E N T S
1 i n t r o d u c t i o n 1
1.1 Context and motivation 1
1.2 Objectives and plan 2
1.3 Thesis organization 3
2 s tat e o f t h e a r t 4
2.1 Overview of Next Generation Sequencing technologies 4
2.1.1 Roche 454 4 2.1.2 Life technologies 5 2.1.3 Illumina 6 2.1.4 Pacific Biosciences 6 2.1.5 Paired-end vs single-end 7 2.2 Metagenomics 7 2.2.1 Metagenomics pipelines 10 2.3 Metatranscriptomics 11 2.3.1 Metatranscriptomics pipelines 13
2.4 Integrated analysis of metatranscriptomics coupled to metagenomics 13
2.5 Steps and tools for MG/MT data analysis 15
2.5.1 Steps and tools for Preprocessing 15
2.5.2 Bioinformatic tools for Assembly 19
2.5.3 Bioinformatic tools for Annotation 20
2.5.4 Bioinformatic tools for Statistical analysis 23
2.6 The databases for annotation 23
2.6.1 UniProt 23
2.6.2 KEGG 24
2.6.3 Conserved Domains Database 24
2.6.4 InterPro 25
2.6.5 NCBI’s RefSeq 26
3 d e v e l o p m e n t 27
3.1 Pipeline architecture and implementation in MOSCA 27
3.1.1 Preprocessing 27 3.1.2 Assembly 31 3.1.3 Annotation 33 3.1.4 Data analysis 34 3.1.5 Implementation details 35 iv
Contents v
4 p i p e l i n e t e s t i n g 36
4.1 Datasets for pipeline testing 36
4.2 Results 37 4.2.1 Preprocessing 37 4.2.2 Assembly 41 4.2.3 Annotation 42 4.2.4 Data analysis 44 5 c o n c l u s i o n 48
L I S T O F F I G U R E S
Figure 1 Utilization of web resources of MG analysis throughout the years.
FromDudhagara et al.(2015). 12
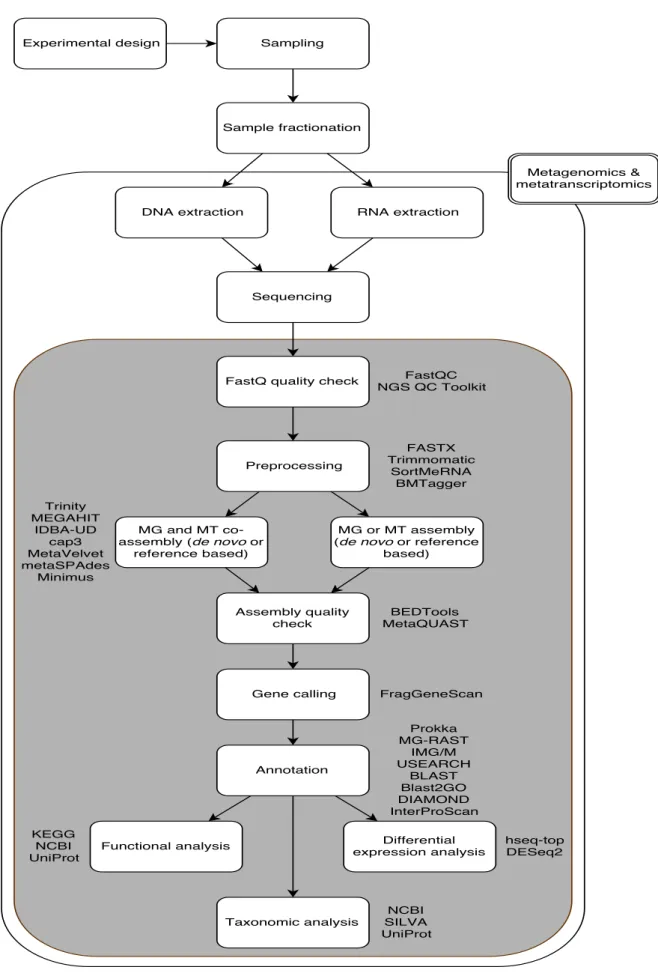
Figure 2 Typical Meta-Omics pipeline workflow, from the laboratory to the
bioinformatics processing steps. Inside the squares are the major steps. The tools and software possibilities are represented next to
each step of the workflow. 16
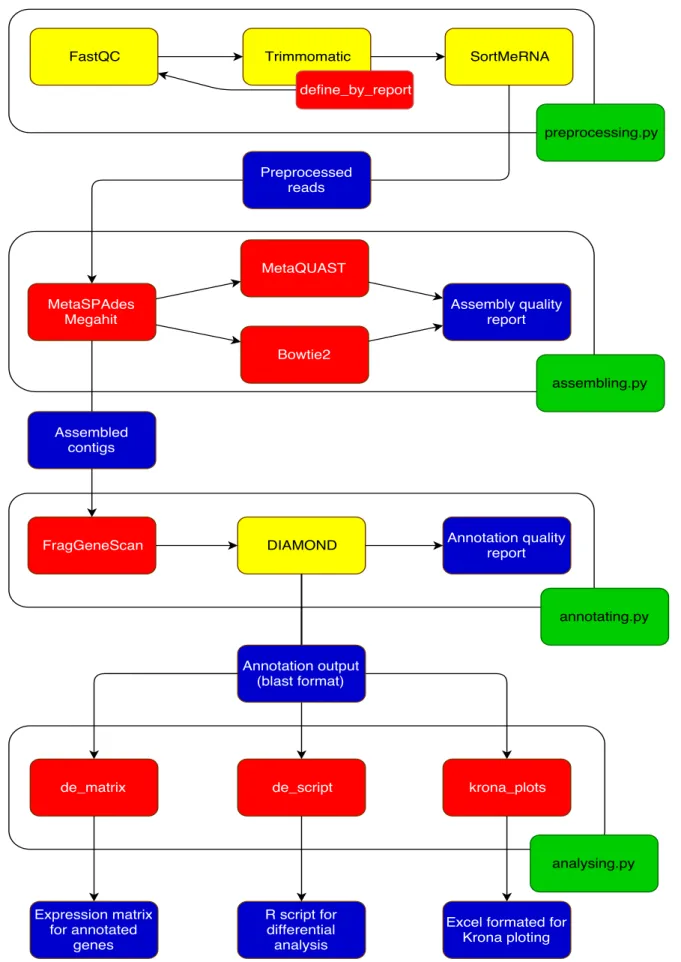
Figure 3 The four scripts (green) integrating the four steps of meta-omics
analysis, by incorporating wrappers for some tools in the form of classes (yellow) and functions (red). Some of the functions integrate additional functionalities, like the ones present in the analysis phase.
Output files (blue) connect the various steps of the pipeline. 28
Figure 4 Taxonomic identification of the species present in sample DNA2. 44
Figure 5 Assignment of genes to pathways for the DNA2 sample. 45
Figure 6 Example of heatmap representing the most expressed genes in the
three samples (RNA1, RNA2 and RNA4), and evidencing the
differ-ences in expression of the genes by a colour gradient. 46
Figure 7 Example of heatmap denoting the distance between the three
sam-ples (RNA1, RNA2 and RNA4), illustrated in a colour gradient, with
clustering of the distance values. 47
L I S T O F TA B L E S
Table 1 Summary of the main characteristics of Next Generation Sequencing
(NGS) technologies (Buermans and Den Dunnen,2014). 8
Table 2 Main steps of MG data analysis integrated in common pipelines.
From (Ladoukakis et al.,2014). 11
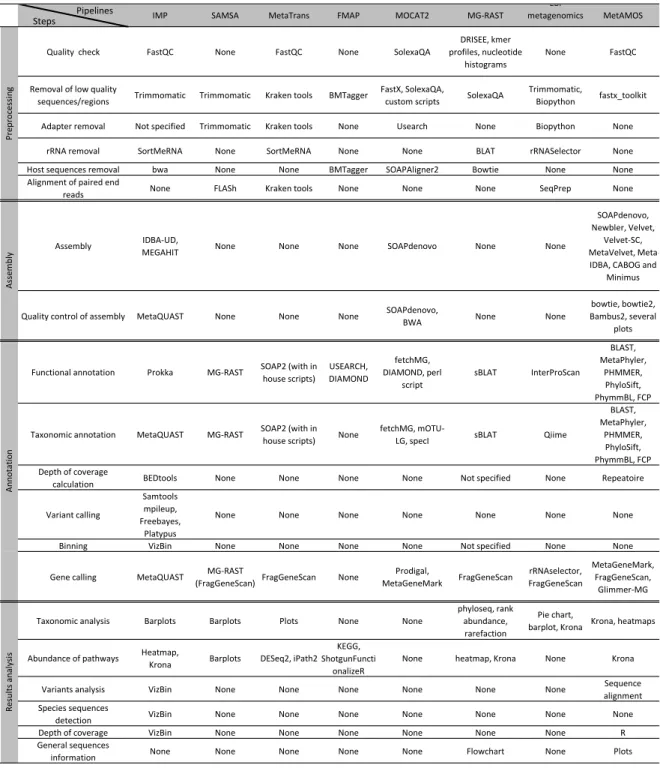
Table 3 Comparison of different steps and tools present in some MG and MT
pipelines. 17
Table 4 The six artificial sequences files available from Trimmomatic
distri-bution, two for Single end (SE) and four for Paired end (PE) mode, and the corresponding sequencing kits from Illumina. The TruSeq3-PE-2.fa file contains the same sequences as the TruSeq3-PE.fa, but containing their reverse complements, it allows for palindrome
clip-ping. 31
Table 5 Quality evaluation results using FastQC on MG FastQ files (DNA1
to DNA8) before and after trimming with Trimmomatic. Green color
means ”pass”, yellow color means ”warn” and red color means ”fail”. 38
Table 5 Continued. 39
Table 6 Quality evaluation results using FastQC on metagenomics 16S rRNA
genes FastQ files (RRNA 1 to 3) before and after trimming with Trim-momatic. Green color means ”pass”, yellow color means ”warn” and
red color means ”fail”. 40
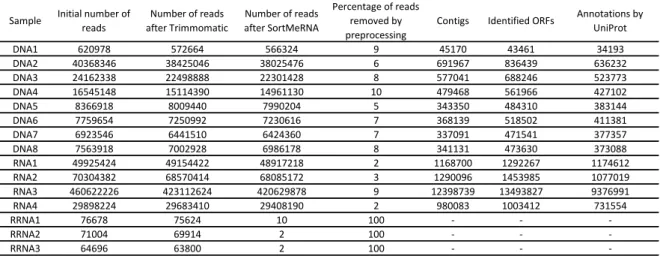
Table 7 Number of reads in the datasets throughout preprocessing, number
of contigs after assembly, number of Open Reading Frame (ORF)s identified in the contigs and number of genes annotated with
refer-ence to the UniProt database. 41
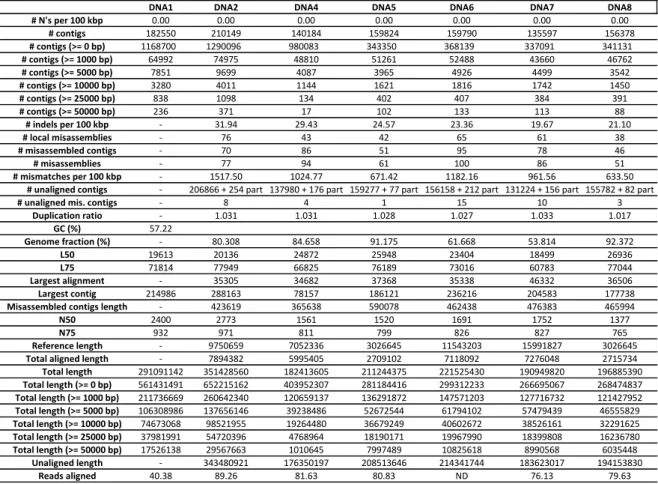
Table 8 Several metrics concerning the quality of the contigs produced by
MEGAHIT, obtained by MetaQUAST and Bowtie2. 42
Table 9 Several metrics concerning the quality of the contigs produced by
MetaSPAdes, obtained by MetaQUAST and Bowtie2. 43
A C R O N Y M S
BLASTBasic Local Alignment Search Tool. bpBase Pair.
CDDConserved Domains Database. cDNAcomplementary DNA.
CDS Coding Sequence. DEDifferential Expression. DNADeoxyribonucleic acid. dsDNAdouble stranded DNA.
EBIEuropean Bioinformatics Institute.
EMBL-EBIEuropean Bioinformatics Institute. FMAPFunctional Mapping and Analysis Pipeline. GbGygabase.
GC Guanine/Cytosine. GUIGraphical User Interface. HMM Hidden Markov Models.
HPLC High Performance Liquid Chromatography. IMPIntegrated Meta-omic Pipeline.
KbKylobase.
KEGGKyoto Encyclopedia of Genes and Genomes. KFUKEGG Filtered UniProt.
KO KEGG Orthologous. LCFAlong-chain fatty acids. Mb Megabase.
MGMetagenomics. MMMeta-metabolomics.
MOSCAMeta-Omics Software for Community Analysis. MP Metaproteomics.
Acronyms ix
MPAMeta Proteome Analyzer. mRNAMessenger RNA. MS Mass Spectrometry. MTMetatranscriptomics.
NCBINational Center for Biotechnology Information. NGSNext Generation Sequencing.
NR Non redundant.
ORFOpen Reading Frame.
OTUOperational Taxonomic Unit. PCRPolymerase Chain Reaction. PEPaired end.
PIRProtein Information Resource. RNARibonucleic acid.
RPKReads per kilobase.
RPKMReads Per Kilobase per Million. rRNARibossomal RNA.
SESingle end.
SIBSwiss Institute of Bioinformatics. SMRTSingle Molecule Real Time. SNPSingle nucleotide polymorphism.
SOLiDSequencing by Oligo Ligation Detection. TbTerabase.
TPMTranscripts per million.
1
I N T R O D U C T I O N
1.1 c o n t e x t a n d m o t i vat i o n
Next Generation Sequencing (NGS)technologies have evolved rapidly during the last years,
generating a large amount of sequencing data obtained from a large variety of organ-isms. Metagenomics (MG), Metatranscriptomics (MT) and Metaproteomics (MP) refer to the study of the genome, transcriptome and proteome of more than one organism occur-ring in a biological sample, respectively. In nature, microorganisms rarely occur isolated and their metabolism depends on relationships that can be established with the environ-ment (other microorganisms, plants and animals, organic and inorganic materials).
The microbiology of several biotechnological processes is still poorly described due to the difficulty on studying complex microbial communities. This knowledge is crucial for the optimization of biotechnological processes which depend on the activity and interaction of highly diverse microbial communities.
The bioinformatics tools utilized for the study of an isolated organism are usually not suitable for the analysis of diverse communities. Tools for studying complex microbial sys-tems are usually in house developed tools, non-available for the scientific community. There are also freely available tools but usually require deep knowledge on bioinformatics, which most biologists and engineers don’t have. Also, some existing tools are not flexible because they were created to address specific questions and to deal with specific data formats.
More recently, open-source pipelines for analyzing meta-omics data have been developed, and several advantages, but also drawbacks can be pointed out. One of the major limita-tions of both MPandMT, but alsoMGanalysis, is the difficulty in choosing the reference database for mapping and identifying the expressed genes and proteins. UsingMGdata as a reference to identify transcripts and proteins can greatly increase the identification rates (Heyer et al.,2017). In order to further increase the number of genes/proteins identified, de novo options, such as assembling without a reference, or aligning nucleotidic reads against more general databases, can be considered, which do not rely only in reference-based ap-proaches and are particularly relevant in the analysis of complex microbial communities which are poorly characterized.Integrated Meta-omic Pipeline (IMP)(Narayanasamy et al.,
1.2. Objectives and plan 2
2016) and Functional Mapping and Analysis Pipeline (FMAP) (Kim et al., 2016) already consider some of these aspects. These and other pipelines were reviewed and compared with the pipeline developed in the framework of this thesis,Meta-Omics Software for
Com-munity Analysis (MOSCA).
For the various tasks of meta-omics analysis, several tools were tested in their direct, command line interface, and then integrated in python wrappers. Several options exist for every task at hand, but only one tool was chosen for every task, with the exception of the assemblers, because of the reported difference between MetaSPAdes and Megahit results (Vollmers et al.,2017), and the databases for annotation, since different biological databases may contain profoundly different information available for the same sequences. The end goal is always to provide files in useful formats for posterior handling, and the output files from each step are made available.
Testing the tool withDeoxyribonucleic acid (DNA)andRibonucleic acid (RNA)samples collected from anaerobic bioreactors, containing bothMGandMTinformation, allowed for a comprehensive application of the entirety of the workflow.
1.2 o b j e c t i v e s a n d p l a n
The objective of this thesis was to develop an easy-to-use bioinformatics pipeline for in-tegrated MG and MT data analysis, allowing the comparative analysis between different samples.
To attain this global objective, the following specific aims were defined:
1. To review state-of-the-art pipelines for meta-omic analysis, identifying their advan-tages and disadvanadvan-tages, and the tools integrated in their workflows.
2. To create a mostly automated pipeline by only requiring the user input at the begin-ning to give general information on the type of the data, the place where the data is stored, the assembler to use in the assembly step and the database for the annotation step.
3. To integrate and adapt selected tools which can improve data analysis and compari-son, and define and construct workflows for different types of analyses.
4. To test selected tools with real datasets, obtained from anaerobic digesters from the host research group.
1.3. Thesis organization 3
1.3 t h e s i s o r g a n i z at i o n
This thesis presents the construction ofMOSCA, and the reasoning behind its build up and necessity. Chapter 2 exposes the fields of MGandMT, their possibilities and challenges. It exposes the major steps in the bioinformatic workflow necessary to obtain meaningful in-formation from the datasets produced in the laboratory, and presents several tools designed for tackling the challenges of the several phases of meta-omics analysis. Several pipelines which integrate these tools into a single software are also explored and the implemented tools and approaches identified.
Chapter 3 explains howMOSCA was designed, the reasoning behind the choice of the tools and how they were tested and integrated. The entire picture of tools, functionalities and input/output files is presented in this chapter.
In chapter 4, the results obtained with real datasets, for testing the pipeline, are shown. Chapter 5 closes the thesis with the final remarks concerningMOSCAin its present form, and future prospects.
2
S TAT E O F T H E A R T
2.1 ov e r v i e w o f n e x t g e n e r at i o n s e q u e n c i n g t e c h n o l o g i e s
In 1977, twoDNAsequencing techniques were developed, by Frederick Sanger and Walter Gilbert, based on the chain-termination method and chemical modification ofDNA respec-tively. The first generation of sequencing techniques was dominated by Sanger’s approach, even though it presented laborious work, used radioactive chemicals, was expensive and slow. This technique went on as the main solution toDNAsequencing until the end of the Human Genome Project.
Even though sequencing is the best tool for comprehensive analysis of several genomic questions, only now is it begining to represent a standard of genomic studies, in part due to the hurdles of performing whole-genome sequencing for every sample and individual. Instead, scientists have had to rely on genome-wide association studies using Single
nu-cleotide polymorphism (SNP)-arrays for the comparison of different genomes (Buermans
and Den Dunnen,2014).
The development ofNGSallowed for cheaper and quicker sequencing, distinguishing it from the Sanger approach by enabling massively parallel analysis, and large datasets have emerged as a result. Today, it is possible to sample a certain microbiome and sequence all the genetic material, from the smallest Ribossomal RNA (rRNA) subunit to complete genomes of single organisms or even entire populations, in such low times and with costs that were considered impossible in the recent past (Liu et al., 2012; Buermans and Den Dunnen,2014;Bahassi and Stambrook,2014;Van Dijk et al.,2014).
SeveralNGStechniques have been developed, with a focus on increasing the read length longer reads are easier to assemble and allow for a better detection of sequencing errors
-and the output per run, -and decreasing the run time (Quail et al.,2012).
2.1.1 Roche 454
454GS FLX was the firstNGStechnology viable enough for the market, released in 2005 by 454, following the Human Genome Project, and is based on pyrosequencing. After 454 was
2.1. Overview of Next Generation Sequencing technologies 5
purchased by Roche, two more platforms were developed, namely the FLX+ and the GS Junior systems, which are improvements over the same technology. The advantage of these systems is the larger read length and fast workflow - allowing for 10 hour sequencing - but their smaller outputs have put the competition ahead, and Roche is putting their activity to an end (Liu et al.,2012;Buermans and Den Dunnen,2014).
2.1.2 Life technologies
Sequencing by Oligo Ligation Detection (SOLiD)was developed by Agencourt in 2006, and
purchased by Applied Biosystems the same year. The technology of two-base sequencing based on ligation sequencing is capable of generating paired end reads, and the fact that each base is interrogated twice by octomer ligations increases the read accuracy to 99.99%, which represents a main advantage of this method, even though the output is only half the maximum of the competition (Liu et al.,2012;Buermans and Den Dunnen,2014).
Ion Torrent, developed on the 350 nmCMOS technology, makes use of an oil-water emul-sion - thus giving the name emulemul-sionPolymerase Chain Reaction (PCR)to the process - to partition small reaction vesicles, each with ideally one reaction sphere, a library molecule and all the reagents needed for the process, where the PCR reaction will take place. The large output of this method is hindered by some problems of emulsion PCR, besides the normal complications of PCR: it is hard to get one library molecule per reaction vesicle - only about 1/3 of vesicles will have that 1 molecule to 1 vesicle ratio and extraction of the spheres from the emulsion is still not efficient. Nucleotide incorporation is detected through quantification of proton presence in the medium, calculated through pH change of the medium. The lack of an imaging step (unlike Roche’s luciferases’ reaction or Illumina’s fluorescent imaging) leads to a significant decrease in run time. Continuous development of the Ion torrent technology increased the output level from 10Mb up to 1Gygabase (Gb), and the average read length from 100Base Pair (bp)up to 400bp(Buermans and Den Dun-nen,2014).
Ion Proton Systems were first applied on the Proton-I chips, which were developed on the 110 nmCMOS technology, allowing for a decrease in sphere and censor wells diameter and an increase in number of wells to 165 million per chip and in output up to 8-10 Gb
per run. In 2015, the Proton-II chips, which possess double the number of wells because of the corresponding decrease in the sizes of the vesicles, were released, with the announced larger output, but not the decrease in run time.
2.1. Overview of Next Generation Sequencing technologies 6
2.1.3 Illumina
Solexa, which developed the Genome Analyzer in 2006, was purchased by Illumina, which improved the technology of sequencing by synthesis used by Genome Analyzer. On 2010, Illumina launched the HiSeq 2000, which had the biggest output per run up to 600Gb, that can be obtained in 8 days, but with an error rate of almost 2%. Nevertheless, it became the cheapest solution per base when compared with 454 andSOLiD. The second sequencer developed by Illumina was the MiSeq, which has shorter run times and outputs, being more indicated for amplicon sequencing and bacterial genome sequencing (Liu et al.,2012; Buermans and Den Dunnen,2014).
In 2014, Illumina released two new sequencing models, the NextSeq 500 and the HiSeq X Ten. NextSeq 500 was devised as a smaller, more flexible version of HiSeq 2000, allowing for two modes of operation, both with much less time per run but also with substantially less output, and with two modes of data output, one with up to 60 Gb and another with up to 120Gbof data output. HiSeq X Ten represents a truly revolutionary breakthrough by seeking the 1000$ genome goal - the challenge of creating a technology capable of sequenc-ing a human genome with less than 1000$ of cost. Introduction of patterned flowcells has allowed for much compacted clusters, and with the application of this method to HiSeq X Ten. This Illumina technology is now regarded as the best option forMGstudies in which genomes are sequenced (Illumina,2015).
2.1.4 Pacific Biosciences
The single molecule real-time sequencing technique used by Pacific Biosciences’ RSII distin-guishes itself from previous sequencing techniques in the fact that it is sensitive enough to detect the incorporation of a single, fluorescently labeled nucleotide, so this method has no need for amplification steps. Although library preparation follows the common workflow of the other methods, it does have some major perks: the adapters have a hairpin structure
(Single Molecule Real Time (SMRT) loop adapters), which leads to the double stranded
DNA (dsDNA) to become circular after ligation, and the quantity of DNA required for
building the library is high, possibly limiting high for some studies such as ChIP-Seq or single-cell genomics.
During sequencing, a molecule may be read several times, depending on a combination of insert size and read length. RSII has no cycles of nucleotide incorporation alternated with imaging or staining, relying instead on a real-time approach, recording the incorporation of the nucleotides at 75 frames per second with use of a powerful optical system, with each kind of nucleotide having its own label. Finally, the enzyme used is a modified version
2.2. Metagenomics 7
of phi29, which has no Guanine/Cytosine (GC)bias, high read length, low error rate and strand displacement properties, coming at a cost of decreased 3-5 exonuclease activity.
Even though this process generates a large amount of sequencing errors (10-15%, mostly comprised of insertions/deletions), these errors are randomly distributed across the se-quenced molecule, as opposed to the other techniques in which the error rate increases towards the end of the sequences. This allows for an alignment of multiple reads for the same areas of the sequenced molecule to remove most of those errors, and by use of the PacBio Quiver software the error rate may decrease to as low as 0.001%. The long read data, absence of GCbias and insight into the kinetic state of the polymerase during sequencing directs the use of this technique to approaches involved in the study of small genomes, since RSII produces a small output (Buermans and Den Dunnen,2014).
Table 1 summarizes the main principles of different sequencing technologies and the
expected output.
A big progress has went off ever since the days in which 454 pyrosequencer was the only reliableNGStechnology, and several technologies exist and continue to emerge in an effort to present the cheapest, quickest, and most reliable technology of NGS. Now that the technology to produce the datasets is available, the big challenge is, and will continue to be in the next years, to store all that data and devise computational solutions for the organization and analysis of such data (Illumina,2015; Buermans and Den Dunnen, 2014; Bahassi and Stambrook,2014;Van Dijk et al.,2014).
2.1.5 Paired-end vs single-end
With the present higher sequencing capacity, it has become usual to sequence in a paired way, in which the same DNA fragment is sequenced from both ends. This translates in two files with the same number of reads, where the first sequence of the forward file cor-responds to the same DNA from which comes the first sequence of the reverse file. All steps in the preprocessing phase must output two files with the same number of reads, or one with the reads from both files interleaved. These sequences may overlap or not, but represent additional clues to the original sequence. By handling paired end data the right way, this is, treating both files as fragments of the same sequences, removal of undesired sequences will be more accurate, and so will the assembling.
2.2 m e ta g e n o m i c s
Less than 2% of bacteria can be cultured in laboratory, which immediately raises the ques-tion of how can we study the remaining 98% that make up the backbone of most of Earth’s ecosystems (Illumina Proprietary, n.d.). An answer has come in the form of MG, which
2.2. Metagenomics 8 T able 1: Summar y of the main characteristics of NGS technologies ( Buer mans and Den Dunnen , 2014 ). C o m p an y Te ch n o lo gy Se q u en ce b y D et ec ti o n R u n t yp es R u n t im e R ea d le n gt h ( b p ) # re ad s p er r u n O u tp u t p er r u n G S FL X Ti ta n iu m Sy n th esi s P yr o p h o sp h at e d et ec ti o n Si n gl e an d 23h 700 1 m ill io n 7 0 0 Mb G S Ju n io r Sy st em Sy n th esi s P yr o p h o sp h at e d et ec ti o n Si n gl e en d 10h 400 0 .1 m ill io n 4 0 Mb Io n t o rr en t Sy n th esi s P ro to n r el ea se Si n gl e en d 4h 2 0 0 -4 0 0 4 m ill io n 1 .5 -2 G b P ro to n -I Sy n th esi s P ro to n r el ea se Si n gl e en d 4h 125 6 0 -8 0 m ill io n 8 -1 0 G b P ro to n -I I Sy n th esi s P ro to n r el ea se Si n gl e en d 8h 100 2 4 G b A b i/ so lid Li ga ti o n Fl u o re sc en ce d et ec ti o n o f d i-b ase p ro b es Si n gl e & p ai re d -e n d 1 0 d ay s 7 5 + 3 5 2 .7 b ill io n 3 0 0 G b H iS eq 2 0 0 0 /2 5 0 0 Sy n th esi s Fl u o re sc en ce ; r ev er si b le te rm in at o rs Si n gl e & p ai re d -e n d 1 2 d ay s 2 x 1 0 0 3 b ill io n 6 0 0 G b Mi Se q Sy n th esi s Fl u o re sc en ce ; r ev er si b le te rm in at o rs Si n gl e & p ai re d -e n d 65h 2 x 3 0 0 2 5 m ill io n 1 5 G b N ex tS eq 5 0 0 Sy n th esi s Fl u o re sc en ce ; r ev er si b le te rm in at o rs Si n gl e & p ai re d -e n d 16h 2x150 4 0 0 m ill io n 1 0 0 G b H iS eq X Te n Sy n th esi s Fl u o re sc en ce ; r ev er si b le te rm in at o rs Si n gl e & p ai re d -e n d 5 d ay s 2x150 6 b ill io n 1 .8 Tb P ac if ic b io sc ie n ce s R SI I Si n gl e m o le cu le sy n th esi s Fl u o re sc en ce ; t er m in al ly p h o sp h o lin ke d Si n gl e en d 2 d ay s 5 0 % o f re ad s > 1 0 kb 0 .8 m ill io n 5 G b H el ic o s H el isc o p e Si n gl e m o le cu le sy n th esi s Fl u o re sc en ce ; v ir tu al te rm in at o r Si n gl e en d 1 0 d ay s 30 5 0 0 m ill io n 1 5 G b Li fe Te ch n o lo gi es R o ch e Ill u m in a/ so le xa
2.2. Metagenomics 9
involves the partial or complete sequencing of several genomes present in aDNAsample -either from viruses, bacteria or human beings (Illumina Proprietary,n.d.;Oulas et al.,2015; Tringe and Rubin,2005;Thomas et al.,2012).
MGcomes in two ways, shotgunMGand marker geneMG. ShotgunMGis the complete sequencing of all the genomic material in a sample, including protein coding genes, oper-ons and other information present in the genome, with the sub-goal of identifying what organisms compose the community of a certain sample, but having as its main objective identifying the ”community potential” of the sample, the collection of genes present and that may be expressed under certain conditions.
In aMG workflow, after sequencing, shorter reads are assembled into larger contigs by reference-based or by de novo assembly. One strategy or even both may be used, depending on the dataset in question, the existence of a reference library and the specifications of the research project. Genes will be then annotated and the possible transcripts and proteins expressed will be identified.
Another approach is Marker GeneMG, where in the taxonomic prokaryotic studies, 16S
rRNAis usually the target gene when the aim is to get phylogenetic information, since this gene is common to all prokaryotes. Both approaches present a set of complex challenges, which have been tackled over the years with more advanced and specific informatics solu-tions (Oulas et al.,2015;Overview and Illumina,2012). Among them, are:
1. PCR noise and errors - single base pair errors, replicate sequence artifacts, PCR chimeras.
2. Deep sequencing - some genes are not abundant, and may not show up on sequencing results, thus underestimating the diversity of the sample.
3. Mosaicism - horizontal transfer may result in incorrect identification of a genome. 4. Intragenomic Heterogeneity - more specific to 16S rRNA gene studies, since
bacte-ria may have several copies of these genes with significant vabacte-riations for the same genome.
Having opened the possibility of studying new ecosystems, MG allows their study in native conditions, without the need of culturing in the laboratory. The study of many important ecosystems, like the soil and the human microbiome, benefited greatly from this approach, that has already expanded the knowledge concerning the different composition of microbial life in every corner of the biosphere.
MG shotgun studies have already been applied to human feces (Breitbart et al., 2003; ˇ
Zifˇc´akov´a et al., 2016), mines (Tyson et al., 2004), Sargasso Sea (et al. Venter, 2004), oil sands tailings ponds (Tan et al.,2015), hydrocarbon-contaminated aquifers (Tan et al.,2015), marine sediments (Urich et al., 2014), soil (Zifˇc´akov´a et al.ˇ , 2016), sewage (Zifˇc´akov´a et al.ˇ ,
2.2. Metagenomics 10
2016), sewage, swine wastewater sample, treated wastewater, river water and drinking wa-ter (Zifˇc´akov´a et al.ˇ ,2016), among others.
On the other hand, rRNA 16S marker gene MG has, for example, been applied to soil (Pearce et al.,2012), (Gołe¸biewski et al.,2014), (Damon et al.,2012), geothermal steamvents (Benson et al.,2011), extremely acidic waters (Garc´ıa-Moyano et al.,2012), oxygen minimum zone of the eastern tropical South Pacific (Stevens and Ulloa, 2008) and Tibetan Plateau (Xiong, Liu, Lin, Zhang, Zeng, Hou, Yang, Yao, Knight and Chu,2012) populations, and is now a routine approach in most laboratories studying microbial communities. But, identi-fying the microbial taxonomy and genomic potential in a sample might not be enough, the next step forward would be to understand what those identified species are doing there, and this can be achieved by using shotgun MG (Tringe and Rubin, 2005; Thomas et al., 2012).
2.2.1 Metagenomics pipelines
Initially, tools developed for single genome approaches were applied inMG, but they were not suitable for dealing with MGdata since genomic information is retrieved from several different organisms (Oulas et al.,2015). Today is a different reality, there are already several pipelines developed for the study ofMG, many of them available online.
The pipelines are considerably diverse (see Table 2): some have fully integrated
work-flows for MG, including quality assessment of sequencing raw data, the assembly and the annotation of genes (Arumugam et al., 2010; Treangen et al., 2013). The difficulty in the installation and in the utilization differs depending on the chosen pipeline, and therefore some will require more computational knowledge from the user than others.
Some pipelines were designed to perform shotgun MG analysis only, others are exclu-sive to 16S rRNAgene analysis (QIIME, Mothur (Plummer and Twin,2015)), while others possess the flexibility to work with both types of analyses (MG-RAST (Wilke et al., 2016), EBI metagenomics (Hunter et al., 2014)). As in other areas of informatics, a trade-off is made with these pipelines: more powerful computational solutions with more tasks inte-grated demand more technical knowledge from the user, while more focused tools have a smoother learning curve with intuitive user interfaces, many even available in the web (Ladoukakis et al.,2014;Oulas et al.,2015).
Ladoukakis et al.(2014) compared seven shotgun MGpipelines - CloVR-metagenomics, Galaxy platform (metagenomics), IMG/M, MetAMOS, MG-RAST, RAMMCAP and Smash-Community (Table 2). From those, MetAmos and SmashCommunity were considered the
most robust and versatile solutions, because they integrate all steps of MG bioinformatics analysis and showed the best quality of the results, although they are not the easiest to operate by less experienced users.
2.3. Metatranscriptomics 11
Table 2: Main steps ofMGdata analysis integrated in common pipelines. From (Ladoukakis et al.,
2014).
Dudhagara et al. (2015) also reviewed 12 MG pipelines available accessible through the web - MG-RAST, IMG/M, METAREP, CoMet, METAGENassist, MetaABC, MyTaxa, metaMicrobesOnline, Coding Sequence (CDS) Metagenomics, CAMERA, METAVIR and VIROME. These studies consider MG-RAST and IMG/M the best options for the functional analysis for already assembled data, mostly because they presented an easy interface, a database setup designed for dissemination of results to the scientific community and also because of their considerably bigger databases and a wide range of annotation tools.
Concerning 16S rRNA studies, QIIME is the most used pipeline for the corresponding taxonomic interpretation (Oulas et al.,2015), being the fastest and producing similar results to mothur and MG-RAST (Plummer and Twin,2015).
2.3 m e tat r a n s c r i p t o m i c s
To know what pathways the microorganisms are utilizing can be translated in knowing what genes are being expressed more intensively, which leads to the study ofMessenger
RNA (mRNA). When collectively studying the transcriptome of several organisms in the
same ecossystem, it is calledMT.
MT analysis integrated with MG have recently been developed, since the differential analysis of the abundance of the mRNA sequences reveals important pathways used by the community and indicate for instance which organisms are vital for maintaining the balance of microbiomes, or through what mechanisms do microorganisms survive extreme conditions.
Indicating the real activity of a microbial population, MTfunctions as a complement to
MG, which only informs about what pathways can be used - the genomic potential of the population (Bikel et al., 2015; Aguiar-pulido et al., 2016). MT presents simpler datasets thanMG, since mRNAconfines to the coding regions of the genome and not all genes are
2.3. Metatranscriptomics 12
Figure 1: Utilization of web resources of MG analysis throughout the years. FromDudhagara et al.
(2015).
transcribed under a certain condition, thus allowing for less complex datasets that generate more focused and useful functional information.
MTdistinguishes itself fromMGin some steps of its analysis:
• For studies aiming at the study of mRNA, a depletion of rRNA is necessary, at the wet- and dry-lab level (Narayanasamy et al.,2016).
• mRNA is very unstable, which might be a factor for ruining the sample before se-quencing
• It is harder to distinguish between bacterial and other living beings RNA, which might be a serious problem in human microbiome studies.
• Overrepresented sequences that would be discarded in MGas undesired are normal in aMTdataset, and therefore to be kept.
• The size of RNA fragments is usually smaller than that of DNA, so each RNA se-quence is usually sese-quenced much more times thanDNA sequences, thus allowing for more reliable results of sequencing.
With the development of kits of enrichment of bacterialRNA and several techniques of
Aguiar-2.4. Integrated analysis of metatranscriptomics coupled to metagenomics 13
pulido et al.,2016). Several works have been developed inMTfunctional and differential analysis, such as the ones applied to soil (Carvalhais et al.,2012), stimulus-induced biofilms (Ishii et al.,2015), mouse intestine (Xiong, Frank, Robertson, Hung, Markle, Canty, McCoy, Macpherson, Poussier, Danska and Parkinson, 2012), kimchi (Jung et al., 2013), bovine rumen (Poulsen et al.,2013) and deep-sea populations (Baker et al.,2013), among others.
2.3.1 Metatranscriptomics pipelines
MTpipelines follow basically the same steps and have to deal with most of the problems of their MGcounterparts, in addition to the overwhelming presence ofrRNAin comparison to mRNA. In four steps - preprocessing of reads, annotation of contigs, aggregation of the annotated contigs, and analysis of results -MTpipelines obtain information about the entire transcriptome, and therefore on the metabolic pathways expressed and also on taxonomic composition of complex microbial communities (Westreich et al.,2016).
Until recently, there was no pipeline fully integrating the steps of assembly and anno-tation for MT data. A comparison of four assemblers - Trinity, Oases, Metavelvet and IDBA-MT - revealed Trinity as the most reliable in assembling more reads to contigs with annotation value (Celaj et al., 2014). In 2016, the first pipelines to integrate all the steps of metatranscriptomics were released: MetaTrans and SAMSA. MetaTrans performs both taxonomic - making use of 16S rRNA - and gene expression analysis of RNA-Seq, after quality-control assessment and rRNA removal. It uses complementary DNA (cDNA) li-braries for PE sequencing, and maps them against functional databases (Martinez et al., 2016). SAMSA identifies the more prominent species and the functional differences be-tween MTdatasets, which allows for multisample comparison. It does require reads to be longer than 100 bp or paired-end, however, which is not always easy to fulfill (Westreich et al.,2016).
2.4 i n t e g r at e d a na ly s i s o f m e tat r a n s c r i p t o m i c s c o u p l e d t o m e ta g e n o m i c s To be able to figure out which pathways are being most expressed in a given sample, it is necessary to integrate MGand MTdata analysis (Dudhagara et al., 2015;Nayfact et al., 2016). However, there are only a few publicly available pipelines developed for multiomics approaches. Very recently, the first publicly available pipelines integrating MG and MT
analysis have been presented, and the two available to date will be described in detail below.
IMP and FMAP are two available pipelines developed to analyze simultaneously MG and MT data for a better interpretation of MT studies. IMP is an open-source pipeline designed for the preprocessing, assembly and analysis ofMGandMTdata (Narayanasamy
2.4. Integrated analysis of metatranscriptomics coupled to metagenomics 14
et al., 2016). The two main features that distinguish it from other pipelines are its itera-tive co-assembly of MG and MT reads and its containerization in docker - allowing for reproducibility of its results. Docker (Chamberlain and Schommer, 2014) is a virtual ma-chine whose environment may be built to reproduce the computational environment of the researcher at the time of his work, in an easy to build, accessible way. IMP is the only pipeline to integrate MGand MT reads by iterative co-assembly, which greatly increased the identification of protein coding genes when compared to results obtained based on as-sembly ofMGreads only. However,Differential Expression (DE), the analysis of diferential expression of genes, was not considered in this pipeline.
The preprocessing steps include trimming and quality filtering (by Trimmomatic) and
rRNAfiltering (by SortMeRNA 2.0). Assembly is achieved through read mapping (by bwa), extracting unmapped reads (by samtools and BEDtools) and filtering host sequences. After assembly, VizBin is used for binning, and in the analysis step, Prokka is used for the annota-tion and VizBin for a detailed and interactive look at the results. Written in Bash, Make and Python, docker and python are the only requirements previous to the installation of theIMP
for using the tool, allowing for a easier installation and use of the pipeline (Narayanasamy et al.,2016).
FMAPis the only implementation to date that handles bothMGandMTanalysis while also performing DE analysis with support from the MG information, which is vital to understand the functional behaviour of a community. Besides that,FMAPalso implements more typical MG features, like sequence alignment and determination of gene families presence.
In the preprocessing step of the workflow, the usual removal of low-quality and hu-man sequences is done through BMTagger, and the alignment of the remaining reads goes through USEARCH or DIAMOND, with a KEGG Filtered UniProt (KFU) reference cluster as database - enriched in bacteria, fungi and archaea sequences, for more robust and infor-mative results. The result of this alignment may be extracted for annotation with another software.
After assembly, gene abundance is determined by raw count orReads Per Kilobase per
Million (RPKM), and for differential quantification, metagenomeSeq, using raw count, and
Kruskal-Wallis and quasi-Poisson, both using RPKM, are the tools selected for that step. The three show variable quality of results depending on the situation, and so the three are implemented inFMAP.
Enriched operons analysis is based on the differential gene abundance, considering dif-ferential abundant the operon corresponding to the gene difdif-ferentially abundant. The defi-nition of operon in FMAPis tied to the KEGG Orthologous (KO)concept, where eachKO
corresponds to a molecular-level function. InFMAP, the differential abundance of operons also means the differential abundance of its corresponding pathway, and another output of
2.5. Steps and tools for MG/MT data analysis 15
FMAP is an input to Kyoto Encyclopedia of Genes and Genomes (KEGG)online pathway map tool, where it is possible to easily visualize which pathways are more represented in the sample, among all pathways available inKEGG(Kim et al.,2016).
A limitation ofFMAPis that it was not designed for comparison of data between different samples, although having ShotgunFunctionalizeR in its workflow, an R package specific for functional comparison of metagenomes of different samples (Kristiansson et al.,2009).
A typical workflow for MG/MTstudies, including the main steps and tools for a com-plete bioinformatics data analysis, is presented in figure2.
2.5 s t e p s a n d t o o l s f o r m g/mt data analysis
NGSmethods can produce large amounts of data, which are necessary in meta-omics stud-ies. There are optimized informatics tools that handle such large amounts of data and that were designed for the different steps of meta-omics data analysis, namely quality control, preprocessing, assembly, bining, annotation and statistical and visual analysis. Several of these tools have been integrated in pipelines, to allow for easier workflows (Table3). A brief
overview of the main steps and most common tools utilized in each step ofMGand/orMT
data analysis will be given.
2.5.1 Steps and tools for Preprocessing
The preprocessing mainly consists on the removal of undesired sequences fromNGSdatasets. All pipelines include a preprocessing phase, but some integrate only a small number of steps, like MetAMOS, while others offer more complex preprocessings, likeIMPand Meta-Trans (Table3).
After the quality of the sequencing reads has been inspected, preprocessing prepares the dataset for the further steps, by removing undesirable sequences. Trimming is to remove the sequences of less interest from the datasets, either because they are too short, they are from species not in the scope of the study or there is too much doubt about the consensus sequence, the latter being quantified by the scores relative to each position of the read. Trimmomatic (Bolger et al.,2014) is one of the solutions for removing low quality and short sequences and BMTagger (Rotmistrovsky and Agarwala,2011) is capable of identifying and removing human sequences. When the work involves study ofmRNA, a depletion ofrRNA
sequences is necessary. SortMeRNA (Kopylova et al.,2012) identifies therRNAsequences and removes them from the dataset.
q ua l i t y c h e c k o f f a s t q r e a d s In the first in silico step of a post-NGSbioinformatics workflow, the datasets of reads produced by sequencing usually undergo quality check.
2.5. Steps and tools for MG/MT data analysis 16
Figure 2: Typical Meta-Omics pipeline workflow, from the laboratory to the bioinformatics process-ing steps. Inside the squares are the major steps. The tools and software possibilities are represented next to each step of the workflow.
2.5. Steps and tools for MG/MT data analysis 17
Table 3: Comparison of different steps and tools present in someMGandMTpipelines.
Steps Pipelines IMP SAMSA MetaTrans FMAP MOCAT2 MG-RAST
EBI
metagenomics MetAMOS
Quality check FastQC None FastQC None SolexaQA
DRISEE, kmer profiles, nucleotide
histograms
None FastQC
Removal of low quality
sequences/regions Trimmomatic Trimmomatic Kraken tools BMTagger
FastX, SolexaQA,
custom scripts SolexaQA
Trimmomatic,
Biopython fastx_toolkit
Adapter removal Not specified Trimmomatic Kraken tools None Usearch None Biopython None
rRNA removal SortMeRNA None SortMeRNA None None BLAT rRNASelector None
Host sequences removal bwa None None BMTagger SOAPAligner2 Bowtie None None
Alignment of paired end
reads None FLASh Kraken tools None None None SeqPrep None
Assembly IDBA-UD,
MEGAHIT None None None SOAPdenovo None None
SOAPdenovo, Newbler, Velvet,
Velvet-SC, MetaVelvet, Meta-IDBA, CABOG and
Minimus
Quality control of assembly MetaQUAST None None None SOAPdenovo,
BWA None None
bowtie, bowtie2, Bambus2, several
plots
Functional annotation Prokka MG-RAST SOAP2 (with in
house scripts) USEARCH, DIAMOND fetchMG, DIAMOND, perl script sBLAT InterProScan BLAST, MetaPhyler, PHMMER, PhyloSift, PhymmBL, FCP
Taxonomic annotation MetaQUAST MG-RAST SOAP2 (with in
house scripts) None
fetchMG,
mOTU-LG, specI sBLAT Qiime
BLAST, MetaPhyler, PHMMER, PhyloSift, PhymmBL, FCP Depth of coverage
calculation BEDtools None None None None Not specified None Repeatoire
Variant calling
Samtools mpileup, Freebayes,
Platypus
None None None None None None None
Binning VizBin None None None None Not specified None None
Gene calling MetaQUAST MG-RAST
(FragGeneScan) FragGeneScan None
Prodigal, MetaGeneMark FragGeneScan rRNAselector, FragGeneScan MetaGeneMark, FragGeneScan, Glimmer-MG
Taxonomic analysis Barplots Barplots Plots None None
phyloseq, rank abundance, rarefaction
Pie chart,
barplot, Krona Krona, heatmaps
Abundance of pathways Heatmap,
Krona Barplots DESeq2, iPath2
KEGG, ShotgunFuncti
onalizeR
None heatmap, Krona None Krona
Variants analysis VizBin None None None None None None Sequence
alignment Species sequences
detection VizBin None None None None None None None
Depth of coverage VizBin None None None None None None R
General sequences
information None None None None None Flowchart None Plots
P repr o cessi n g A ssem b ly A n n o tat io n Resul ts an al ysi s
FASTQ format is an usual output file format ofNGS, but a quality control tool should also have the capacity to analyze SAM, a compressed version of FASTQ, and BAM files, the binary version of SAM (Jones et al.,2012). In addition, two scoring formats, PHRED-33 and PHRED-64, originate two different FASTQ versions depending on theNGStechnology used
2.5. Steps and tools for MG/MT data analysis 18
(Cock et al.,2010). Finally, a quality check should output statistical and graphical analyses of several subjects about the quality of the datasets being studied. FastQC (Andrews et al., 2010) and NGS QC Toolkit (Patel and Jain,2012) are two solutions for this task, with FastQC being the most used and validated.
FastQC (Andrews et al.,2010) is currently the most popular tool at checking the quality of NGS data, but other options exist, like DRISEE for calculating sequencing errors and custom application of histograms for measuring presence of bases in every position of the dataset, and SolexaQA (Cox et al.,2010), which posses several informative graphical results aswell. FastQC retrieves a quality report showing the important characteristics of NGS
data in boxplots, line plots and including a colored code indicating if there is any quality problem and at which level. This analysis is fast, easy to use and to interpret, which has led FastQC to become the most used quality control tool. The strength of FastQC is reflected in the fact that several pipelines used FastQC to generate the initial quality control report, and in further steps during the preprocessing stage.
u n d e s i r e d s e q u e n c e s r e m ova l After the quality of the sequencing reads has been inspected, preprocessing prepares the dataset for the further steps, by removing undesirable sequences. Trimming is to remove the sequences of less interest from the datasets, either because they are too short, from species not in the scope of the study, there is not enough confidence about the consensus sequence, quantified by the scores relative to each position of the read, or there are artificial sequences from the experimental work of obtaining the nucleotidic sequences.
Trimmomatic (Bolger et al., 2014) is becoming more and more popular as a toolbox for tailoringNGSdatasets in many different ways, most concerned with data quality, making use of the quality related information contained in FastQ files. Different tools allow for a versatile response to data problems, which is translated into a powerful and versatile solution for quality and artificial sequences trimming. These are some of the reasons that explain its incorporation in many pipelines, mainly for removing artificial sequences and for cropping or removing entire sequences. SolexaQA and FastX (Gordon and Hannon,2010) are examples of alternative toolboxes available for the bioinformatics community, and can be found integrated in some pipelines as well.
r r na a n d h o s t s e q u e n c e s r e m ova l Because most of the pipelines are focused on
MG data analysis, which contains much less rRNA sequences than MT data, removal of
rRNA sequences is not widespread throughout their preprocessing workflows. For the identification and removal ofrRNAsequences inNGSdatasets, the choice of both software and reference database is highly important. SILVA databases (Quast et al., 2012) have be-come the golden standard amongrRNAdatabases, containing all types ofrRNAsequences
2.5. Steps and tools for MG/MT data analysis 19
in a single resource: all domains - prokaryotic, archaea and eukaryotic - and allrRNA sub-units - 16S, 23S, 18S and 28S. Different tools can be used to map the datasets to databases, which use different approaches. For example, prior to alignment of sequence reads to databases, SortMeRNA (Kopylova et al., 2012) and BLAT (Kent, 2002) generate an index for each database, while rRNASelector (Lee et al.,2011) uses HMMER andHidden Markov
Models (HMM).
Host sequences removal is a very important step, since even when not working with samples from human gut, it still must be assured that the samples are voided of human sequences for submission in certain web servers for annotation and posterior analysis. Like
rRNA depletion, it is, however, not implemented in many of the state-of-the-art pipelines forMGandMTdata analysis. The most important question is, again, what database to use. Examples of tools for removing human and other hosts derived sequences are BMTagger (Rotmistrovsky and Agarwala,2011), SOAPaligner (Gu et al.,2013) and Bowtie (Langmead and Salzberg,2012).
2.5.2 Bioinformatic tools for Assembly
Aligning the reads into contigs that represent as closely as possible the sequences present in the original sample is a task already approached with different strategies to make use of the most resources possible. If there are available examples of the target organisms genomes or of closely related species, then a database reference based assembly may be the best solution, which is the strategy of Minimus (Sommer et al.,2007), from the MetAMOS pipeline (Treangen et al., 2013). If there is no closely related genomes available, de novo assembly is a solution, for which there is Trinity (Celaj et al.,2014) forMTdata assembling, and MetaVelvet (Namiki et al., 2012), metaSPAdes (Nurk et al., 2016), MEGAHIT (Li et al., 2015) and IDBA-UD (Peng et al.,2012) forMG. cap3 (Huang and Madan,1999) can also be used as a standalone assembler or as a complement to other programs by further merging contigs into bigger ones.
After an assembly, it is important to evaluate the results concerning genes and species detection. BEDTools (Quinlan and Hall,2010) possesses a suite of tools for that task, while MetaQUAST (Mikheenko et al., 2016) could be used as alternative, by presenting several classic metrics such total assembly size and N50. By reconstructing the assembly back to the original contigs it is possible to have an ideia of the ammount of reads used in the assembly, allowing to better understand how much of the original information is present in the contigs. Such is achieved by aligning the reads to the contigs, using Bowtie2 (Langmead and Salzberg,2012) or BWA (Li and Durbin,2009), for example.
Despite its proven usefulness, assembling is not included in most pipelines (Table 3). IMP, MOCAT2 and MetAMOS present examples of implementation of an assembling
rou-2.5. Steps and tools for MG/MT data analysis 20
tine, with MetAMOS possessing by far the largest collection of assembling options, with eight different tools to choose from, and three types of assembly, single genome/isolate, metagenomic and single cell assembly. Some of its assemblers are not capable of perform-ing all types of assembly, however, and the tool has been specifically designed towards metagenomic analysis (it was built from AMOS, a genome assembly framework).
IMPincorporates two assemblers and the option to co-assembleMGwithMTdata, in an iterative procedure - after a first assembly, the first contigs and the remaining unused reads serve as input for a second assembly. Additional rounds of assembly could be implemented, but do not show a significant increase in number of contigs after the second assembly.
MOCAT2 (Kultima et al.,2012) assembles the reads into contigs and scaftigs (scaftigs are contigs extended using paired-end information).
q ua l i t y c o n t r o l o f a s s e m b ly MetAMOS also implements by far the most com-plex evaluation and correction of assembling, which starts by mapping the original reads used for the assembling back to the contigs determined by the assemblers (using Bowtie and Bowtie2), and using such mapping to estimate depth of coverage, filter contigs with no reads mapped to them, create links between contigs for scaffolding and re-estimate fragment lengths. Still in MetAMOS, Repeatoire annotates repetitive contigs, allowing for identifying under-collapsed sequence output from the assembling step. Some later applica-tions of other tools also facilitate some annotation steps, and are discussed in the annotation section bellow.
IMP makes use of MetaQUAST to calculate several metrics concerning the contigs pro-duced, such as N50 and number of contigs. Even though this are classic metrics used in the evaluation of assemblies, it lacks an approach such as that of bowtie to deconstruct the assemblies and relate the original reads with the contigs. MOCAT2 makes use of SOAPde-novo and BWA to correct for indels and chimeric regions.
MOCAT2 (Kultima et al., 2012) uses BWA to correct base errors and short indels in the assembly, by aligning the reads to the generated scaftigs, and SOAPaligner2 to resolve chimeric regions, by aligning the several contigs.
2.5.3 Bioinformatic tools for Annotation
After obtaining a list of partial and entire genomes predicted to be present in the sample of study, it is a common step to identify what genes are present, first by identifyingORFs in the sequences, which can be done with FragGeneScan (Rho et al.,2010) and then by submitting each ORF detected to a search software that searches the databases for the closest entries to the sequence, either by homology or pre-determined features. Tools developed for this task are Prokka (Seemann,2014), IMG/M (Markowitz et al.,2008), BLAST (Altschul et al.,
2.5. Steps and tools for MG/MT data analysis 21
1990), DIAMOND (Buchfink et al.,2015), USEARCH (Edgar,2010), and Blast2GO (Conesa et al.,2005), the latter through use of Gene Ontology. MG-RAST (Glass et al.,2010) is also widely used for this purpose, while integrating additional features such as phylogenetic and functional classifications of metagenomes (Meyer et al.,2008), and InterProScan (Jones et al.,2014), the tool that allows for access to InterPro domain information.
All pipelines infer the origin and function of the original reads or of the contigs produced by the assembly steps, in their annotation phase (Table3). Such determination usually starts
by identifying the ORFs, in a process known as gene calling. After that, functional and taxonomic annotation is generally performed by aligning the obtained sequences to protein databases. Binning help in separating the total transcriptome into smaller, taxon specific clusters, necessary for understanding the individual importance of such taxon. Variant calling allows to identify small differences in similar sequences, although it may sacrifice some speed of the pipeline because of the sheer size of data usually processed.
g e n e c a l l i n g The identification of ORFs approach is very dependent on the specific characteristics of the analyzed contigs. One of the most used tools is FragGeneScan (Table
3), which incorporates a machine learning algorithm, and even though it works well when
challenged with short reads, it is versatile enough to be used with longer reads from both
MGand genomic datasets, and by combining models of sequencing error and codon usages in itsHMM, it performs very well with error prone reads. Other tools, such as MetaGene-Mark and Glimmer-MG, have also been specifically developed for handling gene calling in
MGsamples. rRNAselector identifies regions encoding forrRNAinMGandMTdatasets.
f u n c t i o na l a n d ta x o n o m i c a n n o tat i o n Functional and taxonomic annotation is usually tackled by aligning the contigs against databases containing the specific sequences expected to be found on the datasets. In meta-omics studies, however, such databases must be more general, for it is usually not known the totality of species present in the environments from where the samples came. More functional databases, such as UniProt and KEGG, are used to identify the functions of the proteins found in the datasets, which allows for mapping such functions to metabolic pathways, and discover which are the most important ones. Taxonomy may be determined from the alignments in the functional annotation, or it may be determined by aligning the 16S rRNAor DNA sequences to 16S databases, such as SILVA, Greengenes andNational Center for Biotechnology Information (NCBI).
BLAST has been the classic tool used for such alignments, but DIAMOND applies an algorithm tailored for short reads, much faster in such situations when compared with the other solutions. USEARCH and VSEARCH are alternatives similar to DIAMOND, faster than BLAST and tailored forMG. Specifically for taxonomic annotation, MetaQUAST
incor-2.5. Steps and tools for MG/MT data analysis 22
porates an algorithm for searching the SILVA database automatically, when assessing the quality metrics of the contigs (Table3).
d e p t h o f c ov e r a g e Depth of coverage is measured by how many times a certain sequence appears in the dataset. Average depth of coverage is that concept applied to the full dataset. A higher coverage confirms the veracity of the sequences (less randomness from sequencing and assembling errors), and allows to detectSNPs when present on those sequences. MG data usually exhibits less coverage, however, which might compromise organisms identification. Coverage is also used to measure gene expression when applied to MT datasets, since original higher abundance of material related to a certain gene is usually the reason for a higher coverage, which in such cases might be magnitudes of times more variable than inMGdatasets. BEDtools and Repeatoire are two options for calculating depth of coverage, but it is not a much implemented step in the compared pipelines (Table
3).
va r i a n t c a l l i n g Currently,IMPis the only pipeline to integrate the process of identi-fying and putting in relevance small variations between very similar contigs, since because of the sheer scale of the data, identifying such strain specific characteristics is not a priority. Nevertheless, it has its place when studying multiple strains of the same organism. InIMP, samtools´s mpileup tool is used to provide a summary of the depth of coverage for each base pair on the sequences aligned to the assembled contigs, Freebays detects such varia-tions but on the original reads, without aligning them back to the assembly, and Platypus performs both types of variant detection.
b i n n i n g For population studies, binning has proven to be a helpful step in assigning
an Operational Taxonomic Unit (OTU) to the contigs originated in assembly, which are
aggregated in clusters in this step and classified with the OTU for more comprehensive population level information. VizBin (Laczny et al., 2015) accomplishes this, while also producing visual representations of the results, and CheckM (Parks et al., 2015) makes available a suite of tools for evaluating the binning quality.
Binning may serve two purposes: the resulting contigs may be organized into clusters (bins) to diminish data size by only considering one or a few representative sequences from each bin in future analysis; and the contigs may be assigned to a specific taxa, where the assembly serves as the binning process itself. Ideally, there will be one contig by different genome, but in MG it is usually hard to avoid co-assemblies and misassemblies (Kunin et al.,2008). Not just the pure sequence alignment but some nucleotide features related to processes directly involved withDNA, like its repair, and codon usage, might be used for the binning as well.
2.6. The databases for annotation 23
The only two pipelines to integrate binning have applied it for the first function, in an effort to simplify the datasets (Table3). VizBin, for example, provides interactive 2D maps
of points representing the contigs, where it may be possible to discern clusters that might represent several closely related contigs. This maps allow the user to isolate this clusters and reduce them to one single contig.
2.5.4 Bioinformatic tools for Statistical analysis
Many analyses may come from meta-omics studies, and these are even more varied when talking about multi-omics approaches: determiningGCcontent of the genomes, main path-ways active, MT/MG ratios, and much more. There are many R packages, such as Shot-gunFunctionalizer (Kristiansson et al.,2009), that tackle several of these challenges, as does Blast2GO (Conesa et al.,2005).
v i s ua l i z at i o n o f t h e r e s u lt s As seeing the analysis results in a comprehensive, intuitive way is usually easier and more useful than to read results in text, many tools already incorporate several types of graphics, many even interactive, for a more helpful ap-proach to presenting results. As an example, VizBin (Laczny et al., 2015) provides several graphical solutions to perceive the binning results, and Krona tools (Ondov et al., 2011) is an example of interactive graphic results where a user has access to several layers of the same information. Blast2GO (Conesa et al.,2005) makes use of colour changes for a better understanding of the annotation process and of graph representations for highlighting the most important GO, while MG-RAST (Glass et al.,2010) provides pie charts representative of several different communities’ profiles and heatmaps with differential multisample anal-ysis. MEGAN (Huson et al., 2007) is a pipeline designed for handling the latter steps in the analysis of microbiome data, integrating tools such as DIAMOND for annotation, but making available a large suite of tools for visual analysis, involving, for example, Voronoi tree maps, principal coordinates analysis and interaction with InterPro2GO (Camon et al., 2004), eggNOG (Powell et al.,2012) and KEGG (Kanehisa and Goto,2000).
2.6 t h e d ata b a s e s f o r a n n o tat i o n 2.6.1 UniProt
A consortium made of the collaboration between the European Bioinformatics Institute
(EMBL-EBI), theProtein Information Resource (PIR)and theSwiss Institute of
Bioinformat-ics (SIB), Universal Protein Resource (UniProt)is composed of four approaches to the
2.6. The databases for annotation 24
(UniParc), theUniProt Reference Clusters (UniRef) and theUniProt Metagenomic and En-vironmental Sequences (UniMES).
UniProtKB is the main point of acess to UniProt, and is divided in two, distinct parts - UniProtKB SwissProt, where the increment in information is more supervised, with in-formation extracted from the literature or from computational scrutiny, and UniProtKB TrEMBL, with more automated and less reviewed information.
UniParc is a repository of past information not only concerning entries ofUniProt, but also of several other databases, in a comprehensive, aggregated way. UniRef speeds database query by merging the information contained in UniProtKB into clusters according to the per-centage of identity - 50%, 90% and 100% of identity lies between the clusters of UniRef50, UniRef90 and UniRef100 respectively, and UniMES contains data concerning a number of metagenomic studies not available in UniProtKB (UniProt, 2010; Bateman et al., 2015). The massive increase in sequencing initiatives has been followed by a massive increase in
UniProtdata, and theUniProtinterface has seen many changes to facilitate the user survey
through such a big database (Bateman et al.,2015).
2.6.2 KEGG
Starting on 1995 as a repository of information derived from the Human Genome Program,
KEGGhas grown to become one of the most relevant databases concerning functional infor-mation of organisms and analysis of pathways (Kanehisa and Goto,2000). Starting based on three databases, it is now divided in eighteen: KEGGPATHWAY,KEGGBRITE andKEGG
MODULE are designed for systems information, for understanding life at the system level;
KEGGORTHOLOGY,KEGGGENOME andKEGGGENES organize information retrieved from NCBI’s RefSeq and GenBank, aggregating it into KOs, for an easier access to better organized and diverse Genomic Information, with links to other databases such as NCBI;
KEGGCOMPOUND,KEGGGLYCAN,KEGGREACTION,KEGGRPAIR,KEGGRCLASS, and KEGG ENZYME compose the Chemical Information of KEGG, with information de-tailing each metabolite and enzyme present in the pathways of KEGG; KEGG DISEASE,
KEGG DRUG, KEGG DGROUP, KEGG ENVIRON, JAPIC and DailyMed provide Health Information, concerning diseases and drugs. KEGGpresents itself as database of informa-tion organized by, besides the normal formats, its pathways and orthologies that allow for a more visual and direct search (Kanehisa and Goto,2000;Kanehisa et al.,2016).
2.6.3 Conserved Domains Database
Starting as a mirror for Pfam (Bateman et al., 2004), a collection of protein families and domains, Simple Modular Architecture Research Tool (SMART) (Letunic et al.,2004), a tool