CRANFIELD UNIVERSITY
JOSÉ PEREIRA
ASSESSMENT OF USAGE OF PLANNING & SCHEDULING
PROCEDURES & ICT BY UK MANUFACTURING SME'S
SCHOOL OF AEROSPACE, TRANSPORT AND
MANUFACTURING
Engineering and Management of Manufacturing Systems
MSc
Academic Year: 2016 - 2017
Supervisor: Professor Harris Makatsoris
September 2017
CRANFIELD UNIVERSITY
SCHOOL OF AEROSPACE, TRANSPORT AND
MANUFACTURING
Engineering and Management of Manufacturing Systems
MSc
Academic Year 2016 - 2017
JOSÉ PEREIRA
Assessment of Usage of Planning & Scheduling Procedures & ICT
by UK Manufacturing SMEs
Supervisor: Professor Harris Makatsoris
September 2017
This thesis is submitted in partial fulfilment of the requirements for
the degree of Engineering and Management of Manufacturing
Systems
© Cranfield University 2017. All rights reserved. No part of this
publication may be reproduced without the written permission of the
ABSTRACT
This dissertation investigates the practices of scheduling and data management in small and medium manufacturing enterprises (SMEs). This work intends to identify and assess the stage of usage of tools and/or software used in companies across the UK, and their techniques. To make this assessment and compare the results within these practices, a combination of a web-questionnaire and interviews were carried out, where participants are asked for their insight and evaluation on issues that were found in literature.
To better analyse the impact of the tools and techniques, results were compared within these practices, the companies that show better results or lack of success are analysed by a series of performance indicators that may identify the result of such tools and techniques.
To perform this survey, a literature review was carried out to discover previous research that has been conducted on the topic and identify the gaps between theory and practices. Research presents positive and negative aspects of the more common and traditional scheduling tools, a classification for manufacturing scheduling tools, and the usage of ERP systems in SMEs.
Data was collected from the companies and is than analysed and discussed to identify trends and produce conclusions on the practices of UK manufacturing companies.
Keywords:
ACKNOWLEDGEMENTS
I would like to express my gratitude to my supervisor Prof Harris Makatsoris, for all his support and guidance throughout the project, as well for his team, Mr. Ioannis Alissandratos and Mr. Samet Isaev for all their assistance.
My appreciation also goes to my parents, and my cousins João and Milica, for all their support throughout the year.
I would also like to thank the IT team, Milena, Alison and Keith for all their help and patience.
Additionally, my gratitude goes to all the research participants that voluntarily participated in this research and provided me with their support, knowledge and insight.
TABLE OF CONTENTS
ABSTRACT ... i
ACKNOWLEDGEMENTS... iii
LIST OF FIGURES ... vii
LIST OF TABLES ... viii
LIST OF ABBREVIATIONS ... ix
1 INTRODUCTION ... 11
2 LITERATURE REVIEW ... 13
2.1 Scheduling and scheduling tools ... 13
2.1.1 MRP – Material Requirement Planning ... 16
2.1.2 MRP II - Manufacturing Resource Planning ... 17
2.1.3 APS – Advanced Planning and Scheduling ... 18
2.2 Data Management ... 19
2.2.1 ERP – Enterprise Resource Planning ... 19
2.3 Customer/Supplier Relationship ... 20
3 METHODOLOGY ... 23
3.1 Research Aims and Approach ... 23
3.2 Quantitative and qualitative research ... 23
3.3 Questionnaire – Strategy and research ... 24
3.3.1 Data collection tools and procedure ... 24
3.3.2 Content of the Questionnaire ... 25
3.3.3 Sampling criteria ... 25
3.3.4 Reliability and Validity ... 26
3.3.5 Ethical Considerations ... 26 3.3.6 Data Analysis ... 27 3.3.7 Limitations of web-questionnaires ... 27 3.4 Interviews ... 27 3.4.1 Process overview ... 27 3.4.2 Participants Selection ... 28 3.4.3 Interview Recording... 28
3.4.4 Validity and Reliability of interviews ... 29
3.4.5 Data analysis ... 29
4 DATA ANALYSIS ... 31
4.1 Companies ... 31
4.1.1 Questionnaire Companies results ... 31
4.1.2 Interviewed Companies ... 32 4.2 Data Management ... 33 4.2.1 Questionnaire results ... 33 4.2.2 Interview results ... 37 4.3 Scheduling System ... 39 4.3.1 Questionnaire results ... 39
4.3.2 Interview results ... 44
4.3.3 Results conclusion ... 45
4.4 Opinions following the UK referendum of 23 June 2016 ... 46
5 CONCLUSION AND DISCUSSION ... 49
5.1 Limitations ... 49
5.2 Conclusion ... 49
REFERENCES ... 51
LIST OF FIGURES
Figure 2-1 The functionalities of manufacturing scheduling tools (Source: Dios
and Framinan, 2016, p. 231) ... 14
Figure 3-1 Number of companies according to categories ... 26
Figure 4-1 Companies size... 31
Figure 4-2 Companies business strategy ... 32
Figure 4-3 Number of companies that use a data management system ... 34
Figure 4-4 Data management system type according to the companies size . 35 Figure 4-5 KPI performance and ERP performance ... 36
Figure 4-6 KPI performance, ERP performance KPI and ERP performance on customer/supplier relationship ... 37
Figure 4-7 Number of companies that use a scheduling system ... 39
Figure 4-8 Scheduling tools used by the companies ... 40
Figure 4-9 Number of the company’s business strategy ... 41
Figure 4-10 Scheduling tools according to the company’s business strategy . 41 Figure 4-11 Excel functionality as a manufacturing tool ... 43
Figure 4-12 MRP functionality as a manufacturing tool ... 43
Figure 4-13 Data management systems used according to company’s size ... 45
Figure 4-14 Number of scheduling tools used ... 46
LIST OF TABLES
LIST OF ABBREVIATIONS
ICT Information and Communications Technology SMEs Small and Medium Enterprises
MRP Materials Requirement Planning MRP II Manufacturing Resource Planning APS Advanced Planning and Scheduling ERP Enterprise Resource Planning KPI Key Performance Indicator BOM Bill of Materials
MTS Make To Stock
MTP Make To Plan
MTO Make To Order ATO Assemble To Order ETO Engineer To Order
1 INTRODUCTION
This project seeks to assess United Kingdom’s Manufacturing small and medium enterprises(SMEs). It sets to identify what type of tools and software are used to execute production planning and data management. It is intended to survey the stage of the technology used, what obstacles and benefits companies find when using these tools, what changes could be made to overcome such challenges and how the company performs in different key performance levels (KPIs).
There are many different types of scheduling and decision support software that companies use to plan or assist their production process, as well as data management software systems to store and manage information of the company’s business. The scope of the project is to analyse the ways that small enterprises implement and use their production scheduling systems, as well as data management systems.
The definition of SMEs is that they employ less than 250 people. According to the European Commission, SMEs represent 99% of the companies in Europe (Commission, 2017a), and are the “backbone” of the European Economy (Commission, 2017b). In every industrial sector are distributed SMEs, and they perform various different activities (Thakkar, Kanda and Deshmukh, 2009), and contrary to large organisations, SMEs usually focus and specialise in a particular business sector(Vakasi, 2015).
Firstly, the research began by a literature review on the topics of scheduling tools, data management systems and customer and supplier relationship. Knowledge and information was gathered from recent journals, theses and books on the issues. Scheduling software and tools are identified and their advantages and disadvantages are analysed. The same is done in data management systems, as well as practices in SMEs. Then, the benefits and reasons of a more open and connected relationship of companies with their customers and suppliers is presented.
The next step was to collect information in the actual practices in UK enterprises that manufacture tangible goods. To achieve this, a web questionnaire was created and distributed to more than ten thousand SMEs to gather quantitative data. The web questionnaire set to identify the type of tools and systems used by the companies, other information was gathered to understand how the processes were influencing the company, or how the company influences the tools and systems used. The results were collected and it was intended to extract insight from it to elaborate questions of the interviews that would follow.
The interviews were conducted with ten professionals in manufacturing areas. Nine of them working in SMEs, and one working in a large enterprise. The interviews were to gather qualitive data, giving more insight on the topics of the research, such as, identifying benefits, barriers, and trends between different type of business strategy.
The results were analysed and comparisons were made with the information from the different companies. Tools and software were identified, as well as trends according mostly to the company’s KPIs and views and opinions of the participants were considered.
An additional part of this project, is to survey the views of manufacturing professionals in the current political situation of “Brexit”. Following the result of the UK referendum on 23 June 2016, where the United Kingdom voted to leave the European Union. The intent is to understand positive and negative impacts that they believe that “Brexit” will have on their company.
2 LITERATURE REVIEW
This literature review presents research on scheduling methods and software to plan production orders and data management systems for information management. Information about SMEs practices in these topics was also presented. This research introduces some of the most common scheduling tools used in manufacturing and a classification for the many existing tools and software. It also presents research on the practices of data management practices. Furthermore, a research on collaboration in business is shown, presenting the role of relationship in decision making and information sharing.
2.1 Scheduling and scheduling tools
Metaxiotis, Psarras and Askounis (2002) defined scheduling as “the process of
allocating limited resources to tasks over time in order to produce the desired outputs at the desired times”. Manufacturing scheduling is one of the key
functions for companies to do efficient planning in order to keep being competitive in the marketplace (Metaxiotis, Psarras and Askounis, 2002), and although it has been done manually for years, there is the need to overcome the limitations of human memory when it is not capable of coping with large amount of information (McKay and Wiers, 2003). This problem increases when many constraints also have to be considered (Speranza and Woerlee, 1991). This necessity has led to the development of computer support software to help manufactures in decision making (Dios and Framinan, 2016). This group of systems are called manufacturing scheduling tools and present several different types of software, which purpose range from interactive systems that permit an automatic check of the feasibility of schedules, to sophisticated systems where optimal schedules are presented. In these types of systems there a variety of tools with specific functionalities, created for special type of business information systems (Framinan, Leisten and Ruiz García, 2014). The more common ones the Material Requirement Planning (MRP) that is driven by forecast, the Manufacturing Resource Planning (MRPII) which evolve from MRP, a result of the many problems that it caused, and Advanced Planning
Scheduling (APS), which were created to fill the gap of scheduling in Enterprise Resource Planning (ERP) systems.
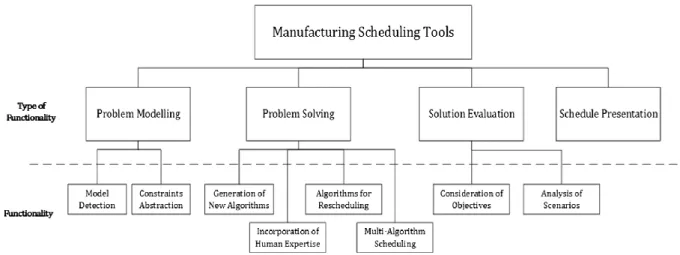
However, since there is a great number of other scheduling tools, a framework was developed to classify the different contributions of these tools, considering they are created for special type of business information systems (Framinan, Leisten and Ruiz García, 2014). These types of systems can be described according to the type of business function that the system is meant to support. These will be described from now on as “functionalities” and will be the criteria to categorize the different type of tools. The type of functionalities will be the ones presented by Dios and Framinan (2016), they are presented in Figure 2-1.
In this paper, the classification was based in the work of Framinan and Ruiz (2010), a work that sets to put forth a classification of generic functionalities of manufacturing scheduling tools.
Although, the main functions are devised into sub-functions by Dios and Framinan (2016), it will only be considered the main functions for this study.
Figure 2-1 The functionalities of manufacturing scheduling tools (Source: Dios
and Framinan, 2016, p. 231)
Problem Modelling:
“This type of functionality refers to the ability of the tool to capture in an autonomous or semi-autonomous manner different parameters of the corresponding shop floor.”
Problem Solving:
“The functionalities grouped under this type refer to how the system generates schedules (i.e. solutions to the problem). Based on the classification by Framinan and Ruiz (2010), a number of functionalities are identified.”
Solution Evaluation:
“This type of functionality refers to how the tool evaluates the schedules obtained. Two aspects were identified within this type of functionalities.”
Schedule Presentation:
“This type of functionalities refers to how the system presents the information to the Decision Maker and how it interacts with him/her. This type of functionality is adopted in the reviewed tools using different means.”
However, when it comes to scheduling practices, it is usually pointed out the gap of information between literature and scheduling in enterprises (Maccarthy and Liu, 1993; Dios and Framinan, 2016). One of the reasons are the constraints inherent to the type of business of that enterprise, and thus its manufacturing operations (Maccarthy and Liu, 1993), and, also the need to adapt to the demand of quick market change (Maccarthy and Liu, 1993).
Some scheduling tools were researched and categories were attributed to them according to information provided. This information was gathered from the GetApp (2017) website.
Acctivate – problem evaluation Zoho inventory – problem modelling Fishbowl – problem solving
Orderbot – problem solving CentralBOS – solution evaluation Rollbar – problem modelling
OfficeBooks – scheduling presentation VersAccounts – problem evaluation Boxstorm – problem modelling SpiraTeam – problem modelling
Fixed Asset Management – solution evaluation Conga Novatus – problem modelling
Promapp – scheduling presentation Naranga – problem solving
Q4 – solution evaluation
PDXpert PLM – problem solving Accelo – scheduling presentation Rivo EHS Software – problem solving Adaptive Suite – problem solving
2.1.1 MRP – Material Requirement Planning
The Material Requirement Planning (MRP) system schedules production orders that derive from sales forecast or orders (Lambrecht, 1988, cited in Al-Hakim and Jenney, 1991).This makes MRP a “Push” system, where “schedules cause
work to enter the production process to meet the due date” (Al-Hakim and
Jenney, 1991). It schedules the delivery of different raw materials and quantities needed for production, in other words, “what, when, and how much component
and material are required” (Šurka et al., 2016).
However, MRP has not proven to be an effective scheduling system, according to (Al-Hakim and Jenney, 1991), many companies did not successfully implement this system. MRP is limited in considering other factors of the production process, which leads to implementation problems. The main problems in the failure of implantation are mentioned in the paper by Al-Hakim and Jenney (Lambrecht, 1988 cited in Al-Hakim and Jenney, 1991) (cited verbatim for the reader’s understanding):
“MRP ignores capacity constraints to a large extent, which inevitably
results in unrealistic plans. The widespread use of roughout capacity planning is actually a good capacity check at the planning state, but in many cases, this is not enough.”
“MRP cannot cope with the dynamic of shop floor activities and this
results in uncoordinated actions. Furthermore, since planners have difficulties tolerating idle time they allow high inventories to avoid it even though such an action does not increase the throughout.”
“Predetermined parameters such as batch sizes, safety stock or fixed
lead time result in rigid implementation. The complex interplay between them is not always well understood and the existing MRP software does not motivate planners to do much about it.”
2.1.2 MRP II - Manufacturing Resource Planning
Because of the problems and limitations of the MRP implementation, a new scheduling system was created to prevent these issues. This system derived from the MRP to the Manufacturing Resource Planning (MRP II). The MRP II complements the previews MRP system with additional data, such as finance, engineering, purchasing, distribution and people (Šurka et al., 2016). This way, the MRP II seeks to deliver better results for the production process and better decision making, by decreasing stock levels and holding costs, calculate the most economical lot sizes, track material requirements, allocating production time for different products and determine safety stocks (Šurka et al., 2016). All this information can help companies reduce stocks and calculate accurate production loads and time lines.
The MRP II still presents some drawbacks for a proper implementation. It is a difficult to implement, costly and is time consuming (Šurka et al., 2016).Another major drawback is the integrity of the input data. The system requires accurate inventory records or updated Bill of Materials (BOM) in order to provide the correct outputs (Šurka et al., 2016).
Still, the MRP II provides more benefits to manufactures in relation to the MRP system when it comes to realistic production plans, batch sizes and lead times.
2.1.3 APS – Advanced Planning and Scheduling
The reason for developing Advanced Planning and Scheduling (APS) is the problems that arise from different aspects of the production process. Some of these are put forth by (Lee, Jeong and Moon, 2002). One of the problems is customer-specific orders that will be processed in a multi-project environment. This increases the makespan and makes the meeting of the due dates harder. “Capacity is generally scarce because, to be competitive, fixed costs have been
reduced by outsourcing in recent Years” (Kolisch, 2000, cited in Lee, Jeong and
Moon, 2002). Another need for APS is that ERP systems are not for planning purposes, which makes APS able to complete this gap. APS is found on the principles of hierarchical planning (Hax and Meal, 1973)and make great use of solution approaches that are mathematical programming and meta-heuristics (Stadtler, 2005). In summary, APS seeks to provide managers with information and decisions to manage the company’s Supply Chain, by supporting the material flow and other business areas as procurement, production, transport, distribution and sales (Stadtler, 2005). McKay and Wiers (2003) put forth the scope of APS solutions (cited verbatim for the reader’s understanding):
“Planning, taking forecasts from the sales department or customers and
determining how resources will be used to satisfy the demand; and”
“Scheduling, creating a sequence of jobs allocated to resources in a job
shop, or assembly areas and build rates for dedicated flow-lines;”
“Dispatching, from the work available to choose from, pick the next item
to work on.”
An example of an APS application project in SMEs, was conducted, which addresses the issue of managing cooperation in dynamic SMEs networks using cooperative planning and control (Ryba et al, 2001, cited in Azevedo
2.2 Data Management
One of the objectives of the Project is to understand, first, if data is managed, and how they store and share it within the Company’s functional areas of operation, and also if it is shared with customers and suppliers. This area is known as Information and Communication Technologies which is “the
infrastructure and components that enable modern computing” (TechTarget,
2017), in other words, how people and organizations use networking components and systems to change information in the digital world (TechTarget, 2017).
Data management can present problems with the increase of information, which presents a challenge for the practices of data management. This is something common in today’s companies (Breur, 2009). Another Challenge is the sharing of data, when it is fragmented across the different areas, and the same data is accessed from multiple sources. This data is then managed and stored in information silos (Vayghan et al., 2007) and creates inconsistent information. “Information silos also make it very difficult to optimize supply chains when
operations and manufacturing responsibilities are distributed among many locations and partners” (Vayghan et al., 2007).
2.2.1 ERP – Enterprise Resource Planning
Enterprise Resource Planning is a system program that enables information to be transmitted across the Company’s functional areas of operation, these are: Marketing and Sales (M/S), Production and Materials Management (P/MM), Accounting and Finance (A/F) and Human Resources (HR). “The term ERP can
be defined as an accounting-oriented information system for identifying and planning the enterprise wide resources needed to take, make, ship, and account for customer orders” (Cox and Blackstone, 2005, cited in Lenny Koh
it comes to planning and scheduling the company’s production, which means that ERP will not be analysed, as much as the other systems. When it comes to scheduling, Stadtler (2005) stated that “Enterprise Resource Planning Systems
is not in the area of planning”.
Research has shown that, although until recently the ERP systems were mostly implemented in LEs, the SMEs sector has gained more emphasis among ERP vendors (Jain et al., 2008). However, in the paper by Koh & Simpson (2005), a study was made that indicates how ERP can help SMEs plan scheduling. When wrong scheduling is planned due to changes in the customer orders, ERP can help managing these changes, before scheduling is done. Furthermore, it is indicated that most of SMEs use the ERP system for dimension changing in product design, only few use it to extend the customer order due date, and none seem to the ERP system to shorten supply lead times.
2.3 Customer/Supplier Relationship
The analysis of the scheduling process and data management system will also examine the influence and the part that Customers and Suppliers have in production orders and decision making in the Company. Arduin et al (2013) states that companies that share knowledge efficiently are improving their competitive advantage and collaboration with stakeholders. “Collaboration is
defined as the total of the various courses of actions two individual entities undertake in order to achieve a common goal. These actions cannot be accomplished independently and requires the combination of their different skills” (Kumar and Naberjee, 2014, cited in Vakasi, 2015). To achieve an
efficient collaboration, the main issue is the design of a process that coordinates the independent members of the Supply Chain to be capable of accomplishing common goals and increase profitability (Singh, 2011).
“Nowadays, companies have to cope with constant discontinuities in the marketplace and respond to fast changing market conditions” (Makatsoris and
and manufacturing is very important, this has been considerably recognized by academics and industry for decades (Makatsoris and Chang, 2004).
Since SMEs are usually component manufactures for large companies, there is a need to quickly respond to changes in requirements (Little and Lee, 1999, cited in Singh, 2011). “Competitiveness of SMEs also depends upon
competitiveness of their supplier and customers” (Singh, 2011). This means that
SMEs cannot compete if they do not have effective coordination in their supply chain.
3 METHODOLOGY
In this chapter, the select approach of the research is put forward. The structure and the process of the survey is presented and explained. The selected tools and participants are explained and analysed. Also, the selected methods of ensuring the ethic, reliability and validity of the process and the results, are presented.
3.1 Research Aims and Approach
This project sets to assess the current practices of UK manufacturing SMEs, regarding planning and scheduling procedures, as well as data management systems. The project aims to identify the stage of usage of tools and/or software in manufacturing companies and identify trends within the companies’ performances. To achieve this, a survey consisting of a web questionnaire and phone call interviews with professionals working in the industry were conducted. The total interviews mount to ten, with two of them being with professionals working in micro enterprises, seven with professionals in small and medium enterprises, and one with a professional in a large enterprise.
An additional part of the survey is to assess the views of manufacturing professionals in the current political situation of “Brexit”, following the result of the UK referendum on 23 June 2016. The survey intends to know the opinions of manufacturing professionals on the challenges and benefits that they believe that their companies will face from the outcome of “Brexit”.
3.2 Quantitative and qualitative research
In order to gather data from the web questionnaire, quantitative data is used to transform information into numbers for statistical analysis. This method enables the generalization of the data (Balnaves and Caputi, 2001, cited in Vakasi, 2015). Following the questionnaire, special terms that are used in the industry
were to be identified that could be used later to communicate more efficiently in the following interviews.
On the other hand, to gather descriptive data, qualitative research is conducted, when carrying on the interviews. The interviews allow the participants more freedom to give information and description on a subject, this way, providing an understanding of their views and interpretation of the topics found in literature. The result of this method is that it discovers themes and ways that represent how production scheduling and data management practices are done in practice (Mammersley, 2013, cited in Vakasi, 2015).
3.3 Questionnaire – Strategy and research
The survey process begun by a web-based questionnaire entitled “Scheduling Software and Data Management Analysis”, contained a combination of 19 open and close ended questions and the completion time was between 10 to 15 minutes. The full questionnaire is attached in Appendix A.
3.3.1 Data collection tools and procedure
To create the survey, the university online service “Qualtrics” was used. This service was selected since it provided data gathering tools and data analysis that are used in the report. Another reason to resort to this type of survey is that web questionnaires permit the gathering of large amounts of data with the need to few resources. Also, the results can be exported from the software and analysed in statistical form, that was mandatory for this project. Since this service is provided by Cranfield University, the access and use is for free. The questionnaire was then sent in an email with a link to the survey, which the participants were then able to access with minimal effort. All the responses were kept anonymous and private.
The link to the questionnaire was sent to the selected companies in an email that described the purpose of the survey and an overview of the needed
information. Also, that privacy and anonymity were ensured. The link would then re-direct the participant to the Qualtrics website where the questionnaire could be accessed and completed. The results were gathered and analysed by the program.
3.3.2 Content of the Questionnaire
The topics on which the questionnaire enquired was structured as follows: Data Management Systems, Scheduling Systems, Customer/Supplier Relationship and Brexit/Political Affairs. The last topic was an optional one, since it is related to political affairs and a complementary study of the project. The questionnaire consisted of three types of questions: multiple choice, matrix table, and open text entry. Results are attached in Appendix B.
3.3.3 Sampling criteria
To identify and select the participants, the FAME database was used. The database contains information on companies from the United Kingdom and Ireland. The criteria were selected and of the companies shown, the ones who made their email address available were exported. The companies selected were Micro, Small and Medium Enterprises, meaning that they should employ up to 249 employees. Also, the criteria were that the companies should manufacture tangible goods and be located in England, Scotland, Wales and Northern Ireland.
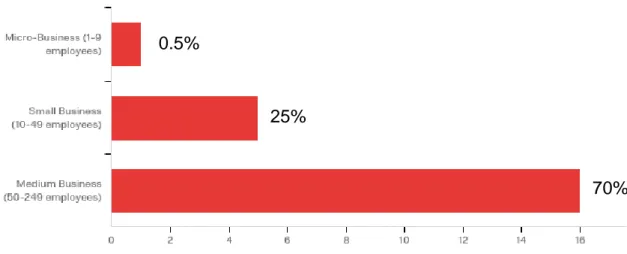
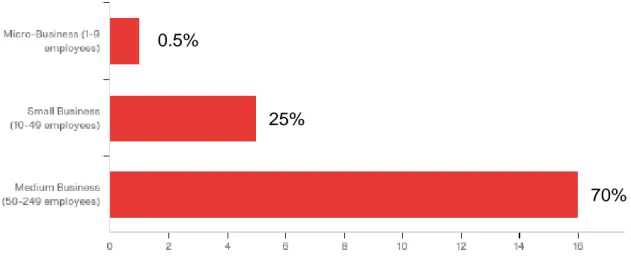
Dozens of thousands of emails were sent to companies, and the amount of responses was 22. Participants were asked to categorize their companies according to the number of employees. The European Union categorizes companies with less than 10 employees as Micro Enterprises, with employees between 10 and 49 as Small Enterprises, with employees between 50 and 249 as Medium Enterprises. Of the companies that answer the questionnaire, 0.5%
(n=1) were Micro Enterprises, 25% (n=5) were Small Enterprises, and 70% (n=14) were Medium Enterprises (Figure 3-1).
Figure 3-1 Number of companies according to categories
3.3.4 Reliability and Validity
To ensure that honest responses would be given, privacy and anonymity was ensured to the participants. The number of questions was kept to a minimum to retain the participant’s interest and avert uncompleted questionnaires. Of the participants who entered the questionnaire, 80% completed it fully. For content validation, the topics of the questionnaire were chosen in a way that covered all the main points of the survey. A series of questions were included to make sure that proper data would be gathered. To devise the questions put forth, they were based on literature about current practices in SMEs. This was validated by the fact that open-ended choices were rarely selected, and the researcher’s email address was provided for further assistance.
3.3.5 Ethical Considerations
To ensure that the research was ethical, anonymity, confidentiality and consent were ensured. By agreeing to complete the survey, permission was obtained from participants before starting the questionnaire. The participants had the
0.5%
25%
freedom to withdraw from participating at any time. The purpose of the research and the requested information were described in the email. Since confidentiality was ensured, any information the participants provided will not be used in a way to publicly recognise them.
3.3.6 Data Analysis
The data was gathered and analysed by the software. Mean values and frequency tables were created automatically. Also, open-ended questions were analysed. Some data was isolated to analyse manually and compared for conclusion making.
3.3.7 Limitations of web-questionnaires
There are limitations when conducting an online questionnaire. The participants can lose interest or respond influenced by the choices of the questionnaire. Additionally, research has shown that web-questionnaires have different response rates than traditional questionnaires (Couper, 2000, cited in Vakasi, 2015).Furthermore, the responses reflect the views of the participants and may vary from the company’s actual practices.
3.4 Interviews
3.4.1 Process overview
The process begun by collecting the companies’ phone number to conduct phone call interviews. To collect phone numbers, an internet search was conducted to select manufacturing companies. A university polyphone was then accessed to contact professionals in manufacturing areas. More than 200 phone calls were made. When contacted, it was requested to speak with a person in charge of the manufacturing department that would be willing to provide a phone call interview. Requests weren’t always accepted as the
person would have time, could only be reached through email or simply wasn’t available.
3.4.2 Participants Selection
The participants were selected based on the criteria that were chosen for the research purpose. The selection criteria when conducting the internet search were, areas of manufacturing such as electronic and plastic components, and UK manufactures by district. There are 5.4 million SMEs in the United Kingdom, constituting 99% of all business (Commission, 2017a), this meant that when contacting the companies, there would be a high probability that they employed a number of people within the SME category range. The participants needed to professionals in charge of the company’s manufacturing, such as managing directors or operation managers, among others. Although this research focus on SMEs, a large enterprise participant was interviewed and kept for analysis, since it can still provide insight for the survey.
As many interviews were done to achieve significant data results. At the end of the process, 10 interviews had been conducted. Although each person can always add more information and unique points of view to the research, the main focus is on gathering the sufficient needed data that can be analysed, rather than a large amount of data with little importance to the research (Silverman, 2013, cited in Vakasi, 2015). Literature suggests that a desired number of participants can go from 5 to 30 participants (Vakasi, 2015), it is however, for the researcher to establish the optimal sample for the survey.
3.4.3 Interview Recording
For better collection of information, all the interviews were recorded after asking for the participant’s approval. This way, there was less dependency on field notes, where important information can be easily missed. Nonetheless, when analysing the data, both recording and written data were used.
3.4.4 Validity and Reliability of interviews
The validation of the interviews sets to prove that the interviewing process was solid and reasonable.
Validation of the interview was ensured by the adequate length of the interviews that gave more detailed insight of each topic, with the help of recording and field notes to give further evaluation of possible missed data. This data was also compared with the data from the web questionnaire.
An issue that might make the collected information specific to a region is that, seven of the interviewed companies are located in Bedford and Buckinghamshire, although their business industry are distinct from one another.
3.4.5 Data analysis
Upon conducting all the interviews, a summary for each one was written and main points were identified. The time that each interview took varied from seven to eleven minutes, according to the information that each participant was able to provide.
Anonymity was ensured to the participants before conducting the interview, this made answers to be given more truthfully and reliable. To guarantee anonymity, the companies will be referred to as Company X, as they are represented in Table 4-1.
Upon contact with the participants, information about the survey was given, as well as the duration of the interview, the information being collected was explained and anonymity was ensured. When permission was given, the interview would begin. The interview began by asking the participants position and some company’s detail, after the topics asked would be the same as the web questionnaire: Data Management Systems, Scheduling Systems,
Customer/Supplier Relationship and Brexit/Political Affairs. The reason for the interviews was to allow the freedom to the participants to describe their thoughts and provide insight on the topics asked. In the topics of data management and scheduling, participants were asked how the software or tools work for their type of business, and were asked to give positive and negative remarks that they felt that it was reflected on the company’s performance. The questions that were asked are presented in Appendix C, and the information collected is presented in Appendix E. The audio files of the interviews were also submitted with the thesis.
4 DATA ANALYSIS
In this chapter, the results of the questionnaire and interviews are discussed and analysed. The companies are presented with a short description, and in Appendix D, their areas of business are further described. Since the participants requested to remain anonymous, the companies will be referred to by code name with which they are described in the chapter. The research results are then presented for each topic.
4.1 Companies
4.1.1 Questionnaire Companies results
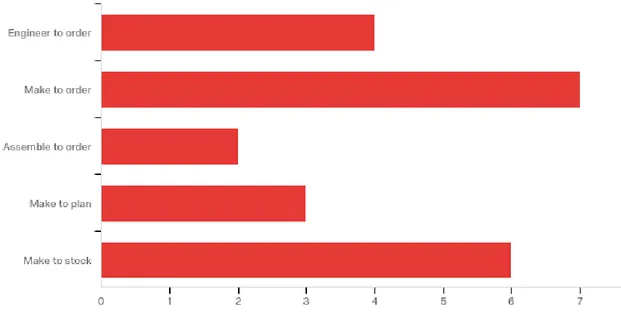
The results of the companies that answered the questionnaire regarding to size and business strategy are presented.
Figure 4-1 Companies size
0.5%
25%
Figure 4-2 Companies business strategy
4.1.2 Interviewed Companies
For each company, key elements are presented, such as company size, main sector and type of exchanged goods. The information was provided in the interviews and from information published online.
Table 4-1 The company industry title and the interviewee position
Code Name Company Industry Title Position of the interviewee in the Company
Company A High-tech Bonding Technology
Operations Manager
Company B Optical Applications Managing Director Company C Water Softening Production Supervisor Company D Slitting and Rewinding
Equipment
Operations Manager
Company E Plastic Fabrication and Machining
Company F High Quality Precision Engineering
Engineering Manager
Company G Signs Design Managing Director
Company H Polyurethane Moulding and Toolmaking
Technical Sales Manager
Company I Sound Amplifier and Musical Instruments
Production Manager
Company J Structural Steelwork Project Manager
4.2 Data Management
The data management procedures and software used by the companies are presented and analysed according to the companies’ size, the participants opinion and information sharing.
4.2.1 Questionnaire results
4.2.1.1 Software and tools
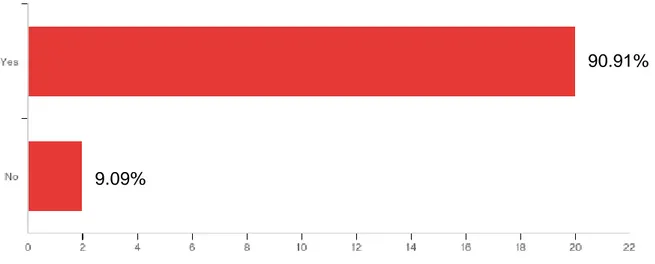
In the questionnaire results, 90.91% of the companies had a data management system (Figure 4-3), this include a micro enterprise.
Figure 4-3 Number of companies that use a data management system
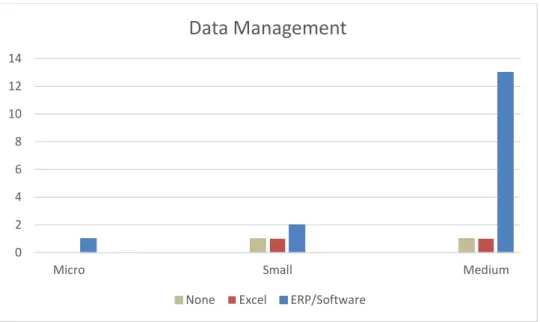
The only one micro enterprise that answered the questionnaire, had an ERP System. Out of the five small enterprises reported, one did not have a data management system, one used Excel for data management and two used an ERP system. The fifth company answered that it used a data management system, but did not identify which one. Out of the sixteen medium enterprises reported, one did not have a data management system, one used Excel for data management, and thirteen used ERP or a software to manage data.
90.91%
Figure 4-4 Data management system type according to the companies size
It is seen in Figure 4-4 the use of ERP or software, as sizable as the companies become.
The ERP and software systems identified were: Epicor Salesforce SAP Diomac IFS Sage Saleslogix SLX Syspro Juno Shuttleworth Progress Plus Dimensions Lake View IQMS
All of these programs had good reviews from the participants, except for Shuttleworth and Dimensions, especially regarding information exchange.
0 2 4 6 8 10 12 14
Micro Small Medium
Data Management
4.2.1.2 Data sharing
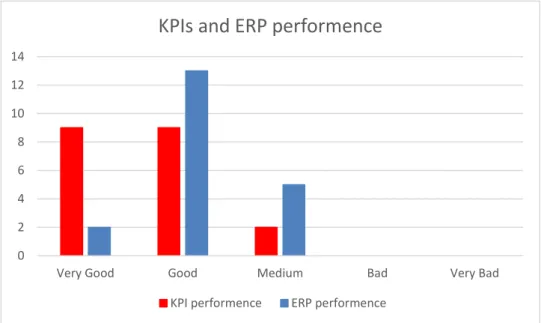
From these data management systems, only in four companies is the information shared automatically with the scheduling tools. This is shown to be in advantage for the company, has it is reflected in the KPIs (Figure 4-5).
Figure 4-5 KPI performance and ERP performance
This proves the information found in literature by (Arduin, Grundstein and Rosenthal-sabroux, 2013), were it is stated that companies that share knowledge efficiently are improving their competitive advantage. It is further proved that information is well managed and shared since participants attributed good performance to the ERP and software used to do so.
4.2.1.3 Customer/Supplier relationship
To assess how the companies improve their competitive advantage and have an effective supply chain coordination, it was asked if their data management system had a platform to communicate with customers and/or suppliers. Some of the companies achieved this through an ERP system. In the responses
0 2 4 6 8 10 12 14
Very Good Good Medium Bad Very Bad
KPIs and ERP performence
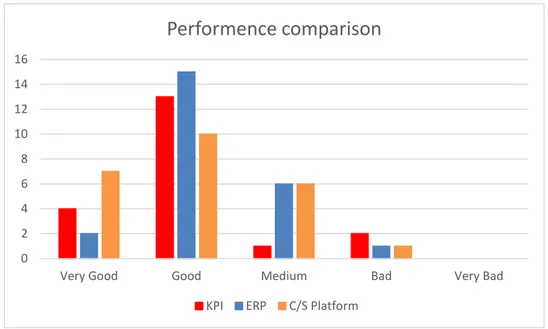
where communication is done, it is analysed and compared the participants opinion on the performance of the ERP itself, the ERP performance in handling communication with customer and/or supplier, and the companies’ KPI’s.
Figure 4-6 KPI performance, ERP performance KPI and ERP performance on customer/supplier relationship
It is seen that most companies that have good remarks for their ERP system also have good remarks for the ERP platform with customers and suppliers. Most of these companies are the ones that also share information with their scheduling tools. Again, this is reflected on the companies KPI’s, which, on average are good.
4.2.2 Interview results
4.2.2.1 Software and tools
From the companies interviewed, both micro enterprises, Company E and F, stated that they didn’t have a data management system, the reason being that the companies were so small that there was no need for such a system. The
0 2 4 6 8 10 12 14 16
Very Good Good Medium Bad Very Bad
Performence comparison
companies that use ERP were A, B, C, D and I. Companies G, H and J resourced to Excel.
Company A used a Sage system. It was acknowledged that this system is outdated, since the company grew from when it was initially acquired. For this reason, the system has some drawbacks and causes some problems, being realized by the interviewee that it needs to be updated. Company B had an ISO system that has been specifically design for the company’s requirements, and it was stated to run perfectly. Except for the micro enterprises, all companies had some data management system, whether it was an ERP system or Excel. All four companies that used ERP gave good performance remark to the system used. These were:
Sage ISO Filemaker IFS
The remaining three stated that benefits of using Excel is that is easy to use, allowing it to be accessed by different people, although admitting that it is outdated.
4.2.2.2 Data sharing
The companies that used Excel as their data management system, had to exchange information manually with the scheduling system, which was acknowledged to be time consuming and prone to mistakes. Company D stated that they intend to connect the ERP system to the scheduling system for data exchange. In companies A and B, the ERP system shares data with the scheduling system. Although company A had the problems that is explained above, it still had good KPI’s performance, as for company B, the interviewee stated that the company has great performance levels, proving the benefits that were found in literature of data sharing.
4.2.2.3 Customer/Supplier relationship
Except for Company D, all the interviewed companies did not have a platform to communicate with customers or suppliers. Only Company D used its ERP system to communicate with suppliers, and only with about 25%. All companies resourced to phone, email or fax.
4.3 Scheduling System
The scheduling system procedures and software used by the companies are presented and analysed according to the companies’ size, the participants opinion and business strategy.
4.3.1 Questionnaire results
4.3.1.1 Software and tools
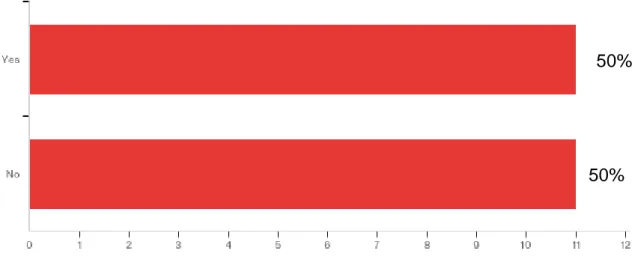
In the questionnaire results, 50% of the companies said to use a scheduling system for production planning (Figure 4-7).
Figure 4-7 Number of companies that use a scheduling system
50%
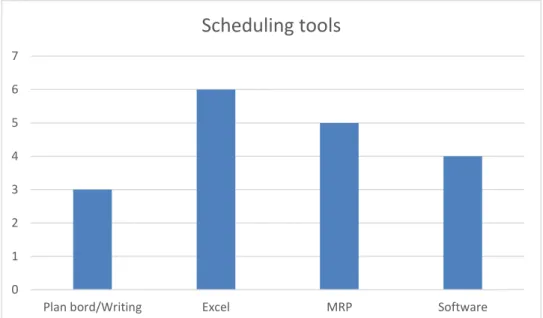
To perform scheduling, the companies, often used a combination of tools. Since the software mostly used were MRP and Excel, all other software will be presented in Figure 4-8 generically.
Figure 4-8 Scheduling tools used by the companies
The software systems used for scheduling identified were: Syspro Epicor MS Project Primavera 6 SAP IQMS
Trends to the type of tools used according to companies’ size were not found, for example, a medium enterprise reported that one of the ways to perform scheduling was writing.
The number of each business strategy reported is presented in Figure 4-9. 0 1 2 3 4 5 6 7
Plan bord/Writing Excel MRP Software
Figure 4-9 Number of the company’s business strategy
Comparison was made between the companies’ business strategy and the scheduling tools used (Figure 4-10). To narrow the results, they were allocated to similar business strategy.
Figure 4-10 Scheduling tools according to the company’s business strategy
0 0.5 1 1.5 2 2.5 3 3.5 4 4.5
Software MRP Excel Plan Board/Writing
Scheduling tools and business strategy
Regarding Excel, plan board and writing, they are used in fairly the same amount across the different business strategies, given that the number of strategies recorded are different. It is seen that MRP is used more frequently in make to stock (MTS) and make to plan (MTP) business, and the use of a type of software is more common in make to order (MTO) and assemble to order (ATO) business. This might be because of the amount of products manufactures that are usually related to the different business strategy.
MTO and ATO businesses usually do not manufacture great amount of products, these are companies that offer more customizable products (Investopedia, 2017a). This might be the reason to resource to software scheduling tools that can easily cope with changes in materials, operations time, and other factors, to respond to customers demand. Although ETO is a business where companies offer more customizable products than MTOs and ATOs, the number of products is usually low (Arena, 2017) this might be the reason that the companies do not often use a specific software tool.
MTS and MTP businesses tend to manufacture great amount of products and in low variety (Investopedia, 2017b).This means that there are not many changes in manufacturing and so, this might be the reason for the companies resourcing more to MRP. Since MRP provides the materials required for manufacturing the products, other specification might be done resourcing to other tools.
4.3.1.2 Software and tools functionality
One of the findings in literature that is presented, is the categorization of scheduling tools by their functionality. Participants were asked to classify the tools used according to their opinion. Unfortunately, there were few tools that were categorized, and the ones that were, were only reported once. Still, the classification of Excel and MRP are showed in Figure 4-11 and Figure 4-12.
Figure 4-11 Excel functionality as a manufacturing tool
Figure 4-12 MRP functionality as a manufacturing tool
According to participants, Excel is mostly good for Scheduling Presentation. The same classification is attributed to MRP, and of Problem Solving.
0 1 2 3 4 5 6
Very Bad Bad Medium Good Very Good
Excel Functionality
Problem Modeling Problem Solving Solition Evaluation Scheduling Presentation
0 0.5 1 1.5 2 2.5 3 3.5 4 4.5
Very Bad Bad Medium Good Very Good
MRP Functionality
4.3.2 Interview results
4.3.2.1 Software and tools
Company A stated that they used the software Preactor for a few months, however they discard it because it wasn’t fast enough to cope with changes. They now resourced to MRP to generate production orders, which are then sent to the shop floor, that are then sequenced by the operators. Company I also use MRP and stated that one of the benefits is that it allows manufacturing control from the raw materials to the final product.
Both Companies B and C use a Kanban system for production, the difference is that in Company B, the Kanban system accesses information from the ERP system to generate production orders, and then create the Kanban tickets. As for Company C, the Kanban tickets are set out manually, although was said to be good for inventory management and gives transparency in the company, it has the downside of being a slow process.
Companies D and H both resource to Excel for scheduling. As is explained above, Company D stated they intend to connect the ERP system to the scheduling system for data exchange. This can be seen as the company’s belief that data sharing is a benefit for the production process. As for Company H, it was stated that MRP would be too complicated for their type of business.
The micro enterprises companies, E and F do not use any software tools. Company E stated that there was no need for such, since it is a small business and they rely on their experience. As for Company F, it uses a plan board, since it is easy for everyone to access.
The only companies that use a different type of software from the ones above were Companies G and J. Company G operates with SignLab, a specific software for signs manufacturing, and also a Plan board. Company J uses Microsoft Project to generate Gantt charts. The tool is familiar and easy to use, as the interviewee stated. It was further said that the company is trying to implement a new software called Easyprojects.
4.3.3 Results conclusion
The results from the web questionnaire and interviews are presented. These are the ones regarding the data management used according to the companies’ size and the type of scheduling tools used.
Figure 4-13 Data management systems used according to company’s size
The use of an ERP system or software is seen as larger the companies are. 0 2 4 6 8 10 12 14 16
Micro Enterprise Small Enterprise Medium Enterprise
Data Management
None Excel ERP/Software
0 1 2 3 4 5 6 7 8 9
Software MRP Excel Plan Board/Writing
Figure 4-14 Number of scheduling tools used
It is seen that the most common scheduling tools are Excel and MRP. Also, that manually tools are still used, not usually on their own but in addition with other tools.
4.4 Opinions following the UK referendum of 23 June 2016
The analysis will be done on the opinions and views of manufacturing professionals following the leave of the UK from the European Union (EU), as a result of the UK referendum on 23 June 2016. Both results of the questionnaire and interview participants are summarized. Participants were asked at first to rate how they believe their company would react to the UK departure from the EU in these topics: readiness to risk, risk mitigation and responsiveness. Results are presented in Figure 4-15.
Figure 4-15 Participants opinion on the company reaction to the topics
0 2 4 6 8 10 12 14
Very Bad Bad Medium Good Very Good
Participants opinion
The graph shows that participants are in general optimistic on how their companies will react in the challenges that they could face.
Opinions on positive and negative outcomes to the company were further asked. The answers ranged from good and bad perspectives. Some participants had no comment to add on the issue. On the interviews, it was explained by few, not just because it is a political issue, but because of the uncertainty involving the process, they simple could not be sure of the outcomes. To some, this uncertainty itself was a negative aspect, for example, that it can undermine confidence to investments.
Some participants see the leave of the European market as an opportunity for other markets. To companies that only have business in the UK, this was said to have no effect, although for others, it is seen as an opening for new markets, which can have a reduction in bureaucracy for those markets. This was pointed out to be a negative impact for Europe, has the UK still has many manufacturing industry and cannot stop selling to other European companies. Negative impacts were concerning export rates, if the EU decides to inflict a duty on British products, exchange costs will go up. Many participants were concern with the leave of foreign labour, especially European skilled labour. However, some saw this has an increase of jobs for British labour.
5 CONCLUSION AND DISCUSSION
5.1 Limitations
The research covered the objectives that were put forward, however, there are limitations that could not be avoided. While there was adequately data gathered, the companies selected were from among different business industries. This means that selecting specific sectors, more in-depth analysis can be done. For example, how the scheduling practices of such companies can influence their performance relating to the type of machines and the level of technology of the processes, operations time and layouts. Moreover, a larger number of participants could provide more concrete analysis to the results. Finally, the outcome of the results can differ depending on the participants. This happens especially in questionnaire, as the participants response can be affected from the choices that they are presented with.
5.2 Conclusion
Although the use of software tools is more common as larger the companies are, the use of writing is still used by some companies as a support, regardless of their size. This use of software tools is especially seen in data management systems. In small enterprises, the use of Excel, software or ERP system are the same, at least on this research results. However, in medium enterprises, it is seen a higher use of a software or ERP systems. This is likely driven from the larger amount of information that arises, and the acknowledgement of the companies in the need of a high-performance system to enable their competitive advantage. Also, the benefits were shown in companies where their data management system shares information with their scheduling tools. This was reflected in a good level of their KPIs, showing that companies improve their performance with a more automatic and fast way of sharing information between their scheduling process and data management system.
The main way that companies come into contact and handle production orders with customers and suppliers is through telephone, email or fax. Only few had a platform where their customers and suppliers could directly communicate with
the data management system. Most of these companies are also the ones that their data management system shares information with their scheduling tools, and again, it was reflected in the KPIs as a positive factor.
The research shows that Excel and MRP are the most common scheduling tools used by companies. This was explained in the interviews that they are familiar to users and easy to work with, making them the preferred scheduling tools. Nonetheless, the downsides are pointed out as being time consuming and prone to mistakes, since most of the information exchange is done manually. The type of tools used by the companies were analysed according to their business strategy. When it comes to Excel and forms of written tools, there are no significant trends. Regarding MRP, it is a type of tool used more by MTS and MTP businesses. As for other and more specific types of software, these were shown to be used more in MTO and ATO businesses.
REFERENCES
Al-Hakim, L. A. and Jenney, B. W. (1991) ‘MRP: An Adaptive Approach’,
International Journal of Production Economics, 25(1–3), pp. 65–72. doi:
10.1016/0925-5273(91)90131-C.
Arduin, P., Grundstein, M. and Rosenthal-sabroux, C. (2013) ‘From Knowledge Sharing to Collaborative Decision Making’, International journal of information
and decision Sciences, 5(3), pp. 295–311.
Arena (2017) What makes engineer-to-order (ETO) products unique? Available at: http://www.arenasolutions.com/resources/articles/engineered-to-order/ (Accessed: 31 August 2017).
Azevedo, A. L., Toscano, C., Sousa, J. P., Soares, A. L., Azevedo, A. L.,
Toscano, C., Sousa, J. P. and Soares, A. L. (2004) ‘An Advanced Agent-based Order Planning System for Dynamic Networked Enterprises’, Production
Planning & Control, 15(2), pp. 133–144. doi: 10.1080/09537280410001662538.
Breur, T. (2009) ‘Data Quality is Everyone’s Business -- Designing Quality into your Data Warehouse -- Part 1’, Journal of Direct, Data and Digital Marketing
Practice, 11(1), pp. 20–29. doi: http://dx.doi.org/10.1057/dddmp.2009.14.
Commission, E. (2017a) Internal Market, Industry, Entrepreneurship and SMEs. Available at:
http://ec.europa.eu/growth/smes/business-friendly-environment/sme-definition_en (Accessed: 31 August 2017).
Commission, E. (2017b) Internal Market, Industry, Entrepreneurship and SMEs. Available at:
http://ec.europa.eu/eurostat/web/structural-business-statistics/structural-business-statistics/sme (Accessed: 31 August 2017). Dios, M. and Framinan, J. M. (2016) ‘A Review and Classification of Computer-based Manufacturing Scheduling Tools’, Computers and Industrial Engineering. Elsevier Ltd, 99, pp. 229–249. doi: 10.1016/j.cie.2016.07.020.
Framinan, J. M., Leisten, R. and Ruiz García, R. (2014) Manufacturing
Framinan, J. M. and Ruiz, R. (2010) ‘Architecture of Manufacturing Scheduling Systems : Literature Review and an Integrated Proposal’, European Journal of
Operational Research. Elsevier B.V., 205(2), pp. 237–246. doi:
10.1016/j.ejor.2009.09.026.
GetApp (2017) Discover, Compare, and Choose the Best Business Apps. Available at: www.getapp.com (Accessed: 31 August 2017).
Hax, A. C. and Meal, H. C. (1973) ‘Hierarchical Integration of Production Planning and Scheduling’, Production, 1, Logisti(May), pp. 53–69. doi: 10.1016/S1570-7946(09)70240-8.
Investopedia (2017a) Make To Order - MTO. Available at:
http://www.investopedia.com/terms/m/make-to-order.asp?ad=dirN&qo=investopediaSiteSearch&qsrc=0&o=40186%0A (Accessed: 31 August 2017).
Investopedia (2017b) Make To Stock - MTS. Available at:
http://www.investopedia.com/terms/m/make-to-stock.asp%0A (Accessed: 31 August 2017).
Jain, V., Benyoucef, L., Bennett, D., Deep, A., Dani, S., Burns, N. and
Guttridge, P. (2008) ‘Investigating Factors Affecting ERP Selection in Made-to-order SME Sector’, Manufacturing Technology Management, 19(4), pp. 430– 446. doi: 10.1108/17410380810869905.
Lee, Y. H., Jeong, C. S. and Moon, C. (2002) ‘Advanced Planning and Scheduling with Outsourcing in Manufacturing Supply Chain’, Computers &
Industrial Engineering, 43(1), pp. 351–374. doi:
10.1016/S0360-8352(02)00079-7.
Lenny Koh, S. C. and Simpson, M. (2005) ‘Change and Uncertainty in SME Manufacturing Environments using ERP’, Journal of Manufacturing Technology
Management, 16(6), pp. 629–653. doi: 10.1108/17410380510609483.
Maccarthy, B. and Liu, J. (1993) ‘Addressing the Gap in Scheduling Research : A Review of Optimization and Heuristic Models in Production Scheduling
International Journal of Production’, International Journal of Production
Research, 31(1), pp. 59–79. doi: 10.1080/00207549308956713.
Makatsoris, H. C. and Chang, Y. S. (2004) ‘Design of a Demand-driven Collaborative Supply-chain Planning and Fulfilment System for Distributed Enterprises’, Production Planning & Control, 15(3), pp. 292–302. doi: 10.1080/09532780410001655675.
McKay, K. N. and Wiers, V. C. S. (2003) ‘Integrated Decision Support for
Planning, Scheduling, and Dispatching Tasks in a Focused Factory’, Computers
in Industry, 50(1), pp. 5–14. doi: 10.1016/S0166-3615(02)00146-X.
Metaxiotis, K. S., Psarras, J. E. and Askounis, D. T. (2002) ‘GENESYS: An Expert System for Production Scheduling’, Industrial Management & Data
Systems, 102(6), pp. 309–317. doi: 10.1108/02635570210432000.
Singh, R. K. (2011) ‘Developing the Framework for Coordination in Supply Chain of SMEs’, Business Process Management Journal, 17(4), pp. 619–638. doi: 10.1108/14637151111149456.
Speranza, M. G. and Woerlee, A. P. (1991) ‘A Decision Support System for Operational Production Scheduling’, European Journal of Operational
Research, 55(3), pp. 329–343. doi: 10.1016/0377-2217(91)90203-8.
Stadtler, H. (2005) ‘Supply Chain Management and Advanced Planning - Basics, Overview and Challenges’, European Journal of Operational Research, 163(3), pp. 575–588. doi: 10.1016/j.ejor.2004.03.001.
Šurka, I. V., Križanová, I. G., Iringová, I. M. and Pavel, I. (2016) ‘Implementation of Manufacturing Resource Planning Issues in Practice’, 2016 IEEE 20th
Jubilee International Conference on Inteligent Engineering Systems (INES), pp.
151–156.
TechTarget (2017) Small-business Infrastructure and Operations. Available at: http://searchcio.techtarget.com/definition/ICT-information-and-communications-technology-or-technologies (Accessed: 31 August 2017).
Thakkar, J., Kanda, A. and Deshmukh, S. G. (2009) ‘Supply Chain
Management for SMEs : A Research Introduction’, Management Research
News, 32(10), pp. 970–993. doi: 10.1108/01409170910994178.
Vakasi, D. (2015) Collaboration in Supply Chain Management : A comparative
Analysis of the Collaborative Practices in Procurement Management at SMEs and LEs. MSc Thesis. Brunel University.
Vayghan, J. A., Garfinkle, S. M., Walenta, C., Healy, D. C. and Valentin, Z. (2007) ‘The Internal Information Transformation of IBM’, IBM Systems Journal, 46(4), pp. 669–683. doi: 10.1147/sj.464.0669.
Appendix A
Scheduling Software and Data Management Analyses
Company Profile
Position/Role in Company:
E-mail:
Location:
Please choose the category of your company depending on the employee number.
o
Micro-Business (1-9 employees)o
Small Business (10-49 employees)o
Medium Business (50-249 employees)Please indicate the type of production strategy of your company.
o
Engineer to ordero
Make to ordero
Assemble to ordero
Make to plano
Make to stockData Management
1. Does your company has a data management system?
o
Yeso
NoIf the answer is “No” please skip to question 5.
2. Please select which data management system your company uses.
▢
Excel▢
ERP▢
Software▢
Other: ________________________________________________4. Please rate the level of efficiency of the company's data management system on these issues.
Very Low Low Medium High Very High
Level of ease
o
o
o
o
o
Information exchangeo
o
o
o
o
Cost reductiono
o
o
o
o
Inventory managemento
o
o
o
o
Scheduling
5. Does your company has a manufacturing scheduling system/software or scheduling tools?
o
YesIf the answer is “No” please skip to question 13.
6. In which of these formats is the scheduling process done?
