Introduction
Landscapes with cork oak (Quercus suber L.) in southwestern Iberia (called montados in Portugal, dehesas in Spain) are cultural (wood-pastures) human-shaped landscapes, as defined by Manning et al. (2006). Despite strong disturbances caused by changes in hu-man activity, these open woodland ecosys-tems mimic natural ecosysecosys-tems (Joffre et al. 1999, Pereira & Fonseca 2003). Their high
biodiversity (Bugalho et al. 2011) contri-butes to the heterogeneity of the landscape mosaic, including (open) woodlands, shrub-lands, and open farmland (Vallejo et al. 2006), and to the existing nested, multifunc-tional spatial structure, as characterized by Santos & Thorne (2010).
In the last 50 years, imminent multiple changes, including agricultural conversion and new forest plantations (Martínez et al.
2010), have drastically affected the sustai-nability of Mediterranean woodland ecosys-tems, leading to their classification as at-risk native biodiversity hotspots (Myers et al. 2000). Assessment of the dynamics of these landscapes and the identification of the dri-ving factors responsible for the current change processes are thus strongly needed.
Recent changes reported for cork oak woodland landscapes were mainly related to stressful environmental conditions (e.g., soil type and hydrological regime - Costa et al. 2008, 2010), disturbance regimes (e.g., wild-fire occurrence - Moreira et al. 2001), vul-nerable agricultural economy (changing the incentive structure of successive Common Agricultural Policy reforms of the European Union), and labor force availability (Pinto- Correia 2000, Plieninger 2006, Costa et al. 2011). These changes usually result in: (i) a more intense land use (e.g., higher grazing pressure, modern permanent-crop farming systems, or eucalyptus plantations); and (ii) an extended land use (e.g., shrubland en-croachment in set-aside or burnt areas); and, therefore, (iii) a shift from the traditional multifunctional landscape to different single-function landscapes.
Information on oak woodland landscape dynamics has been reported in Spain for cork oak and holm oak (Quercus ilex) dehe-sas (Cano et al. 2003, Plieninger 2006), and for mixed forests of cork oak and Algerian oak (Quercus canariensis - Urbieta et al. 2008), which emphasized the effect of envi-ronmental factors (climate and physiogra-phical conditions) on oak woodland mosaic shifts. In California, for Quercus spp. wood-lands, Huntsinger & Bartolome (1992) and Santos & Thorne (2010) concluded that dif-ferent combinations of management intensi-ties decisively affected oak woodland resto-ration and conservation. For southern Por-tugal, shifting rates and patterns of cork oak woodlands have been reported by Acácio et al. (2009), Costa et al. (2009, 2011) and Costa & Madeira (2011). In these studies, changes in oak woodland landscapes always result in effective net losses of open farm-land and cork oak woodfarm-lands, and in an ex-pansion of forest plantations (pine and euca-lyptus) or shrubland. However, none of the aforementioned studies analyzed where and how oak woodland landscapes change spa-tially, i.e., the relationships between change rates (and the transition matrices occurring in the landscape) and the biophysical charac-teristics of the landscape, such as slope or soil type. Moreover, no study has reported so far the landscape changes driven by different disturbances (e.g., land-use changes or wild-fires) in Mediterranean regions.
Within this context, a study was carried out in the Ulme (UL) civil parish (Chamusca municipality, Portugal) where eucalyptus
(1) Center for Environmental and Sustainability Research (CENSE), Faculdade de Ciências e Tecnologia, Universidade Nova de Lisboa, Campus de Caparica, 2829-516 Caparica (Portugal); (2) Centro de Estudos Florestais (CEF), Instituto Superior de Agronomia, Universidade de Lisboa, Tapada da Ajuda, 1349-017 Lisboa (Portugal)
@
@
Augusta Costa (augusta.costa.sousa@gmail.com) Received: Apr 30, 2013 - Accepted: Oct 19, 2013Citation: Costa A, Madeira M, Lima Santos J, 2014. Is cork oak (Quercus suber L.) woodland
loss driven by eucalyptus plantation? A case-study in southwestern Portugal. iForest 7: 193-203 [online 2014-02-17] URL: http://www.sisef.it/iforest/contents/?id=ifor1031-007
Communicated by: Agostino Ferrara
Is cork oak (Quercus suber L.) woodland loss
driven by eucalyptus plantation? A
case-study in southwestern Portugal
Augusta Costa
(1), Manuel Madeira
(2), José Lima Santos
(2)Mediterranean landscapes with open cork oak (Quercus suber L.) woodlands have recently experienced drastic changes in southwestern Portugal. Changes in agricultural activities, the traditional driver of the economy in this region, led to new land uses, such as long-term set aside (shrublands) and eucalyptus plantations. A study was conducted on the oak woodland landscape dynamics over a 50-year period (from 1958 to 2007) in order to assess the effect of dif-ferent biophysical conditions on landscape spatial changes, and to identify the resilience of lanscape composition to different disturbances (e.g., socio-eco-nomic changes and wildfires). Land use changes over two consecutive periods (1958-1995 and 1995-2007) were inferred by spatial analysis of land cover data (aerial photographs) and related to landscape physical attributes (slope and soil type). A transition matrix of four vegetation land-cover classes was ob-tained, allowing the assessment of the landscape composition changes bewteen the two above periods. Results showed that lansdcape in 1958 was largely oc-cupied by open farmland, with large patches of open oak woodlands on steep slopes surrounding watercourses. Open farmland and shrubland drastically de-clined from 1958 to 1995, while eucalyptus plantation exhibited a dramatic expansion. Although large areas of cork oak forest turned into eucalyptus plantation, the net loss of oak forest was low and counterbalanced by its incre-ment on former open farmland. The occurrence of a wildfire in 2003 promoted a dramatic decrease in cork oak woodlands, which mostly turned into shrub-land. However, shrubland may be considered “safe sites” for ecological succes-sion, ensuring natural cork oak regeneration and the colonisation of neighbor-ing areas.
Keywords: Mediterranean Climate Region, Evergreen Oak Woodlands, Quercus
plantations currently cover about 30% of the total area, aiming to obtain a deeper under-standing of the long-term (50-year) dyna-mics of the oak woodland ecosystem land-scape. Our goals were to characterize at the local scale the changing pattern of land-scapes with cork oak woodlands across dif-ferent biophysical and socio-economic con-ditions, as well as to monitor land use shifts driven by wildfires, in order to assess the re-lationships between landscape pattern chan-ges and their driving forces, as well as to identify emerging trends in the land use. Firstly, it was hypothesized that under diffe-rent combinations of landscape attributes (e.g., slope or soil type), cork oak woodlands may be differently affected by disturbances, such as eucalyptus plantations expansion and wildfires. Slope, rather than soil type, should be decisive for cork oak woodland conserva-tion and, therefore, it should be considered the prominent feature of cultural (human- modified) oak landscapes. Furthermore, it was hypothesized that cork oak woodland landscapes would be differently resilient to distinct disturbances, such as the relatively slow response to eucalyptus plantations ex-pansion (driven by socio-economic condi-tions) and the abrupt response to wildfires. As cultural landscapes are inherently less re-silient to long-standing socio-economic drivers (Plieninger & Bieling 2012), the UL’s landscape should be less resilient to land use changes such as eucalyptus planta-tion expansion, driven by socio-economic changes, than to sudden disturbances such as wildfires.
Material and methods
Study area
The study area corresponds to the UL civil
parish, which occupies 12179 ha and is lo-cated in southern Portugal (39° 23’ N - 08° 30’ W and 39° 16’ N - 08° 15’ W), within the Tagus basin, about 100 km northeast of Lisbon (Fig. 1). The climate is of Mediter-ranean type, smoothed by the influence of the Atlantic Ocean (dry-sub-humid zone - IA 2010), with the highest temperatures during summer when rainfall is the lowest. The mean annual temperature is 16.5 °C; annual rainfall is between 700 and 800 mm; and air humidity is between 66 and 81%. Rainfall mostly occurs from late autumn to early spring, with great annual irregularities. In the last 50 years (1960-2010), the annual precipitation strongly varied between con-secutive years and prolonged periods with below-mean values have been observed since 1970 (Costa & Madeira 2011).
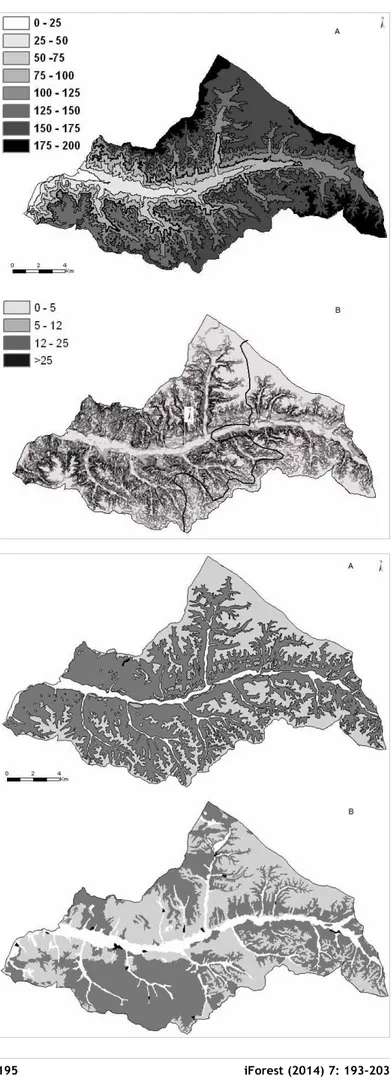
The study area is adjacent to the Tagus al-luvial area and approximately corresponds to the UL river basin (Fig. 2). Elevation ranges from 20 to 190 m a.s.l. (Fig. 2A) and pla-teaus are densely carved by watercourses, in some cases associated with active gullies; therefore, the landscape is flat or gently un-dulating in both valleys bottom and elevated top areas, but steep along the slopes of wa-tercourses (Fig. 2A). The geology is mostly related to the characteristic sedimentary formations of the Tagus basin (Gonçalves et al. 1979). Pliocene formations occupy flat or gently undulating areas (with slopes < 5%) of elevated top areas (Fig. 2B and Fig. 3A). In contrast, Miocene formations occur in steeper areas, mostly along watercourses, and are dominant close to the Tagus alluvial area. Pleistocene alluvial terraces underlie Miocene formations at different altitudes, along the UL river. In the bottoms of valleys, recent Holocene alluvial areas often occur (Fig. 3A).
The predominant soils in the valley bottom (alluvial areas) are Fluvisols (sensu WRB 2006 - Fig. 3B). Soils occurring on flat top areas (Pliocene terraces) are mostly Stagnic Luvisols, sometimes associated with Re-gosols and Cambisols, and their main use is limited by low drainage (SROA 1972a, 1972b). Soils occurring in steep areas (mostly Miocene formations and Pleistocene alluvial terraces) are predominantly Rego-sols and CambiRego-sols, associated with Stagnic Luvisols (Fig. 2 and Fig. 3), and erosion risk is their main limitation (SROA 1972a, 1972b). Therefore, Stagnic Luvisols are not only confined to flat or gently undulating areas with Pliocene formations, but also oc-cur in undulating areas associated with Mio-cene formations, which are possibly related to the complex lithological composition of these formations.
The study area is within the natural poten-tial vegetation area of the Asparago Aphylli-Querco suberis S. vegetation series corres-ponding to the thermomediterranean to low mesomediterranean thermotypes and to the subhumid to humid ombrotypes (Capelo et al. 2007). A large area in UL was recently affected by wildfires. According to the Burnt Area Map of Portugal (AFN 2010), an area of 8 108 ha was burnt in the period 2001-2005, with a large wildfire affecting 8 079 ha occurred in 2003 (Fig. 2B). This allowed us to consider two areas (burnt and unburnt - Fig. 2B) for which the landscape composi-tion dynamics were analyzed independently between 1995 and 2007.
Methodology
Woodland landscape analysis was carried out for three dates: (i) 1958, when the first aerial photographs were produced for the area under investigation; (ii) 2007, when the
Fig. 1 - Location of the study area
(Ulme civil parish, in light grey) in the Chamusca municipality (Por-tugal).
Fig. 2 - Biophysical characteristics of the study area. (A):
Ele-vation classes (m a.s.l.); (B): Slope classes (in %). The black line separates the burnt (left) and unburnt (right) areas after the 2003 wildfire.
Fig. 3 - (A) Geologic formations in the study area: Alluvial
(white), Pliocene (light grey), Miocene (dark grey), Pleistocene al-luvial terraces (black and white strikes). (B) Dominant soil types:
Fluvisols (white); Stagnic Luvisols (light grey), Regosols and Cambisols (dark grey); Urban areas (black).
last aerial photographs of the same area were available; and (iii) an intervening year (1995) was also considered to obtain data on landscape changes in two consecutive peri-ods (1958 to 1995, 1995 to 2007). The 1990s are considered a turning point for the emergence of new oak afforestation areas (Mendes & Dias 2001), given the increasing financial support for oak forest in the large private forest estates of southern Portugal. Indeed, the full entry of Portugal to the Eu-ropean Union (in 1986) allowed eligibility for financial support from structural funds and agri-environmental schemes for multi-ple-use forestry which promoted new large-scale oak afforestation activities (Mendes et al. 2004).
In 1995 and in 2007, the national aerial photography plans (at the Portuguese Geo-graphic Institute) captured color near infra-red, ortho-rectified, digital aerial photogra-phs, with a spatial resolution of 1.0 and 0.5 m, respectively. The aerial photographs of 1958 (panchromatic, 23 x 23 cm, 1:26 000 scale, commissioned by the Portuguese Geo-graphic Army Institute) were scanned at me-dium resolution (800 dpi), ortho-rectified using ERDAS IMAGINE® on a single-image
basis (accessed through the software’s Image Geometric Correction suite), with a positio-nal accuracy of < 5 m. Each 1958 aerial pho-tograph was orthorectified using the digital ortho-images from 2007 as reference images and a minimum of six control points: it was difficult to find more than eight control points on the 1958 aerial photographs, where only few static elements could be found in sparsely settled areas. Ortho-rectified pic-tures were then re-sampled using a first-de-gree polynomial transformation and the nea-rest-neighbor interpolation algorithm. All images were projected onto the SHG73 Sys-tem based on Gauss Transverse Mercator projection, ellipsoid of Hayford and Local Datum73.
A comparative analysis of UL’s cork oak woodland landscape composition changes was carried out for areas markedly different as for the biophysical features (e.g., soil and slope). To this purpose, four vegetation land-cover classes were considered based on the definitions of the National Forest Inventory (DGRF 2007): (i) open farmland (arable and
permanent pastures, i.e., rain-fed areas with herbaceous vegetation, orchards, or olive groves, where tree density was lower or equal to five trees per ha); (ii) shrubland (areas dominated by shrub species, i.e., with a high woody plant cover, where tree density was lower or equal to five trees per ha); (iii) cork oak forest (tree density over five trees per ha); and (iv) eucalyptus forest. In this study, cork oak woodland landscape com-position comprised a mosaic of open farm-lands, cork oak forests and shrublands. Other vegetation types (coniferous forests and dif-ferent broad-leaved forests) and non-vegeta-tion areas (such as water bodies and urban areas) were grouped into the cover class “others”. The minimum mapping unit area was 1.0 ha per patch for all classes.
The categorical map of the study areas in 2007 was first digitized to create a polygon layer derived from the photo interpretation. Patches were delineated to a minimum size of 1 ha, based on within-patch uniformity of structure and composition attributes. Next, according to an adapted regressive photo in-terpretation method (Skalos & Engstova 2010. Andrieu et al. 2011, Plieninger et al. 2012), a duplicate of the 2007 layer was used for the photo interpretation of the pre-ceding (1995) photographs using the same attributes, standards, equipment and photo interpreters for consistency. Basically, poly-gons in the 2007 map showing changes in classification or shape were modified to ob-tain the categorical map of 1995. Similarly, a duplicate of the digitized 1995 photo pretation layer was used for the photo inter-pretation of the 1958 aerial photographs.
Accuracy of the photo interpretation was assessed by ground verification in September 2008. A randomly selected sample of a mini-mum of 15 points, each one representative of one digitized patch classified in forest clas-ses, nearest to each afforestation area, was visited and classified on the ground. Com-parison of patch compositions based on ground-based and air-survey data gave an overall accuracy of 89%. Mismatching clas-sification was likely the result of tree morta-lity (dead trees were excluded) and small-sized patches.
The cork oak woodland landscape changes and landscape composition dynamics were
assessed for two consecutive periods, 1958 to 1995 and 1995 to 2007, based on discrete time transition matrices, where each element represented the proportion of land cover class that changed from one class in time t to another class in time t+1 (Baker 1989) for the overall land cover classes. The persi-stence of each land cover class was calcu-lated as the percentage of the total area maintaining that classification over the who-le period (the correspondent to the transition matrix’s diagonal element for cork oak woodland landscape).
The evaluation of the impact of wildfires on the landscape composition dynamics was possible only between 1995 and 2007. The burnt area at UL was based on the intersec-tion of the landscape composiintersec-tion map in the year 2007 and the burnt area polygon cove-rage, commissioned by National Forest Ser-vices (AFN 2010 - Fig. 2B), using ArcGIS®
accessed through the software’s Image Geo-processing tools suite. The transition matrix between 1995 and 2007 therefore allowed the comparison of landscape composition in the burnt and unburnt areas (Fig. 2B).
Categorical maps of landscape composition for the three dates were crossed with: (i) the digitized Soil Map of UL (SROA 1972a) at 1:25 000 scale using the Portuguese soil classification (Cardoso 1965) and adapted to Reference Soil Groups (WRB 2006 - Fig. 3B); (ii) the Geologic Map of UL, scanned and digitized from the Geologic Map of Por-tugal (Gonçalves et al. 1979) at 1:50 000 scale (Instituto Geográfico e Cadastral in 1977 - Fig. 3A); and (iii) the Elevation and Slope maps (with 10-m spatial resolution, based on the Digital Terrain Model (DTM) derived from the 1:25 000 topographic maps (CM 342 and 343 from 1991, and 354 and 355 from 1999) from the Portuguese Army Institute (Fig. 2A and Fig. 2B). The area of each vegetation cover class, quantified in hectares and in percentage of total area occu-pied, was discriminated by soil type or slope class, and was obtained based on the attri-bute tables of “union” coverage of landscape composition map, in each study year, and the landscape attribute layers (soil type and slope), using ArcGIS®, accessed through the
software’s Image Geoprocessing tools suite.
Results
Landscape composition changes
The landscape mosaic composition at UL strongly changed from 1958 to 2007 (Tab. 1). In 1958, the landscape was dominated by open farmland (5695 ha, 46.7%), while in 2007 this cover class occupied only 1544 ha (12.7%). This loss mostly occurred during the first study period (1958-1995), as the corresponding area in 1995 was already re-duced to 1641 ha (13.5%).
The oak forest area declined from 4819 ha
Tab. 1 - Landscape composition at Ulme by land cover classes in the three studied years
(1958, 1995 and 2007).
Land cover classes 1958 Area in ha (% of total area)1995 2007
Cork oak woodlands 11850 (97.3) 6858 (56.3) 6833 (56.1)
Cork oak forest 4819 (39.6) 4489 (36.9) 3121 (25.6)
Open farmland 5695 (46.7) 1641 (13.5) 1544 (12.7)
Shrubland 1336 (11.0) 728 (5.9) 2168 (17.8)
Eucalyptus plantation 266 (2.2) 4746 (39.0) 4918 (40.4)
Others 63 (0.5) 575 (4.7) 428 (3.5)
(39.6 %) in 1958 to 3121 ha (25.6%) in 2007 (Tab. 1). The annual loss of oak forest was much higher in the 1995-2007 period (a total loss of 1368 ha, corresponding to a loss rate of 2.5% year-1) than in the 1958-1995
period (a total loss of 330 ha - loss rate: 0.2% year-1). Despite the small changes,
in-tensive transitions related to oak forest oc-curred in the 1958-1995 period (Tab. 2), as large areas of oak forest were transformed to eucalyptus plantation (1261 ha), whereas a similar extension of open farmland became oak forest (1159 ha). Moreover, the area of oak forest that turned into shrubland (257 ha) was almost counterbalanced by the shrubland area that evolved into oak forest (310 ha).
Eucalyptus plantation occupied only 2.2% (266 ha) of the landscape in 1958, whereas it was the dominant vegetation cover class in 2007 (40.4% of the overall land). This land cover class already occupied 39.0% of the total area in 1995 (Tab. 1), corresponding to an annual area gain of 1% year-1 (i.e., about
121 ha per year).
Shrubland followed an opposite trend over the study period (Tab. 1). Indeed, shrubland area decreased by 608 ha from 1958 to 1995, while it dramatically increased by 1440 ha over the period 1995-2007. The transition matrix for the 1995-2007 period (Tab. 2) showed that a large percentage of oak forest turned into shrubland (1320 ha, about 29%). Meanwhile, the percentage of shrubland that turned into eucalyptus plantation and oak forest (12% and 7%, respectively) was much lower than in the previous period.
Changes in open farmland and eucalyptus plantation from 1995 to 2007 were negli-gible. Open farmland was quite persistent (86% of the initial open farmland was main-tained), following the trend exhibited by eu-calyptus plantation (98% of the 1995 area was maintained in 2007).
Wildfires and landscape composition
trends
In the period 1958-1995, transitions bet-ween oak forest and shrubland were com-pensating, whereas in the 1995-2007 period, a much larger proportion of oak forest area evolved towards shrubland. This net expan-sion of shrubland mostly occurred in areas affected by wildfires (Fig. 4); given the spa-tial overlap with the burnt area, shrubland expansion can be interpreted (at least in part) as fire-driven (Tab. 3).
The persistence of cork oak forest in the burnt area was negatively affected by wild-fires (Fig. 4), given their higher persistence in the unburnt area (85%) compared with that observed in the burnt area (57% - Tab. 3). This decreasing trend in cork oak forest persistence was accompanied by a higher conversion of the burnt cork oak forest to shrubland (1232 ha - about 37%), while in
the unburnt area, the correponding conver-sion rate was only 8% (89 ha).
Landscape mosaic vs. biophysical
conditions
The share of open farmland in 1958 was largely dominant in the bottom of valleys (72.9%), areas corresponding to Fluvisols (Tab. 4, Fig. 5). In areas where Stagnic Lu-visols are predominant, the proportion of open farmland decreased to 47.7%, while that of cork oak forest reached 40.2%. In areas where Regosols/Cambisols are domi-nant, open farmland and cork oak forest
oc-cupied 38.9% and 43.8% of the area, re-spectively (Tab. 4).
In the top flat areas where Stagnic Luvisols are largely dominant, open farmland was dominant in 1958 (62.3% - Tab. 5), but the percentage decreased to 49.9%, 30.4% and 19.4% in areas corresponding to the 5-12, 12-25 and > 25% slope classes, respectively. In contrast, the share of cork oak forest and shrubland in flat areas reached only 22.7% (in the valley floors - Tab. 4) and 27.2% (in top flat areas - Tab. 5), while it increased to 36.2, 52.1, and 60.9% in areas with a slope of 5-12, 12-25 and > 25%, respectively (Tab.
Tab. 2 - Transition matrix in Ulme landscape composition for the 1958-1995 (top) and
1995-2007 (bottom) periods. Values are the percentage of the initial area in each land cover class (in brackets the area in hectares).
↓1958 / 1995 → Cork oakforest farmlandOpen Shrubland plantationEucalypt Others Cork oak forest 62 (2965) 3 (141) 5 (257) 26 (1261) 4 (195)
Open farmland 21 (1159) 26 (1467) 4 (250) 45 (2580) 4 (239)
Shrubland 23 (310) 1 (17) 15 (193) 55 (734) 6 (82)
Eucalypt plantation 21 (50) 5 (15) 8 (25) 61 (163) 5 (13)
Others 8 (5) 3 (2) 5 (3) 15 (10) 69 (43)
↓ 1995 / 2007 → Cork oakforest farmlandOpen Shrubland plantationEucalypt Others Cork oak forest 65 (2892) 2 (100) 29 (1.320) 3 (123) 1 (54)
Open farmland 5 (73) 86 (1410) 2 (41) 3 (47) 4 (70)
Shrubland 7 (48) 2 (17) 77 (560) 12 (88) 2 (15)
Eucalypt plantation 1 (40) 0 (14) 1 (51) 98 (4632) 0 (9)
Others 21 (121) 1 (6) 36 (207) 6 (34) 36 (207)
Tab. 3 - Ulme transition matrices for main land cover classes in percentage (%) of land use
area (in brackets: area in hectares) in burnt and unburnt areas. Vegetation cover classes: (OF): Open farmland; (COF): Cork oak forest; (SH): Shrubland; (EP): Eucalyptus planta-tion.
2007→ Burnt area Unburnt area
↓1995 OF COF SH EP OF COF SH EP
OF 87 (664) 5 (39) 3 (19) 3 (23) 85 (746) 4 (34) 2 (21) 3 (24)
COF 2 (69) 57 (1916) 37 (1232) 3 (98) 3 (31) 85 (980) 8 (89) 2 (25)
SH 3 (14) 8 (43) 86 (463) 2 (13) 2 (3) 3 (5) 51 (97) 40 (75)
EP 1 (14) 1 (27) 2 (51) 96 (2973) 0 (0) 1 (13) 0 (0) 99 (1664)
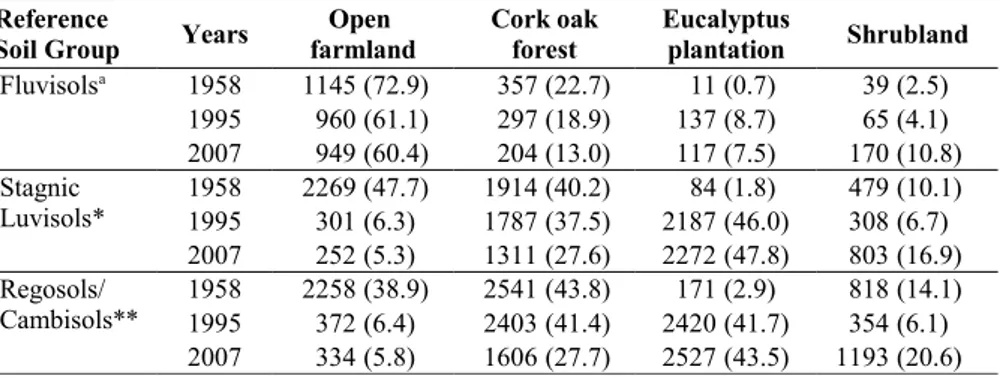
Tab. 4 - Areas (ha) of vegetation cover classes by soil type. Values in brackets are the
per-centage relative to the total (urban areas omitted) soil type area. (a): assumed to occur in areas with slope < 5%; (*): associated to low extent with Regosols and Cambisols; (**): as -sociated to low extent with Stagnic Luvisols and Leptosols.
Reference
Soil Group Years farmlandOpen Cork oakforest Eucalyptusplantation Shrubland
Fluvisolsa 1958 1145 (72.9) 357 (22.7) 11 (0.7) 39 (2.5) 1995 960 (61.1) 297 (18.9) 137 (8.7) 65 (4.1) 2007 949 (60.4) 204 (13.0) 117 (7.5) 170 (10.8) Stagnic Luvisols* 1958 2269 (47.7) 1914 (40.2) 84 (1.8) 479 (10.1) 1995 301 (6.3) 1787 (37.5) 2187 (46.0) 308 (6.7) 2007 252 (5.3) 1311 (27.6) 2272 (47.8) 803 (16.9) Regosols/ Cambisols** 19581995 2258 (38.9)372 (6.4) 2541 (43.8)2403 (41.4) 2420 (41.7)171 (2.9) 818 (14.1)354 (6.1) 2007 334 (5.8) 1606 (27.7) 2527 (43.5) 1193 (20.6)
5). A similar trend was observed for the share of shrubland, which varied from 2.5 (bottom of valleys) to 18.3% (in areas with a slope > 25%).
The landscape mosaic pattern was strongly changed in 1995, following the impressive expansion of eucalyptus plantations. This ex-pansion was relatively small only in the bot-tom of valleys (8.0% - Tab. 4), as in the flat tops of gently undulating areas (slope < 5%), the share of eucalyptus plantation in 1995 reached 54.9% (Tab. 5). A strong increment in the share of eucalyptus plantation also oc-curred in areas corresponding to the 5-12, 12-25, and >25% slope classes (44.8, 39.2, and 34.1%, respectively - Tab. 5). Only in
the 12-25 and >25% slope classes, where open farmland showed a negligible presence, the share of eucalyptus plantation was not dominant in comparison to cork oak forest, which occupied a share of 44.8 and 52.7%, respectively (Tab. 5).
In the 1958-1995 period, the cork oak forest area dropped by 16.8% in the areas corresponding to Fluvisols (Tab. 4). In con-trast, the area of cork oak forest in the same period increased by 17.3% in areas with a slope of < 5%, but corresponding to flat top areas (Tab. 5). In other slope classes, the cork oak forest area decreased by 3.4, 13.9, and 13.6% for the 5-12, 12-25, and >25% slope classes, respectively. Variations in the
share of open farmland and eucalyptus plan-tation from 1958 to 1995 were small in areas corresponding to Fluvisols (Tab. 4), com-pared with those of Stagnic Luvisols and Re-gosols/Cambisols. Differences with respect to these soil types were negligible.
The persistence of shrubland in the 1958-1995 period (15% - Tab. 2) was lower than that exhibited by open farmland (26%), and especially by cork oak forest (62%). The strong reduction in the share of shrubland was observed in all slope classes, but it was much greater in the steeper classes (Tab. 5), where the relative reduction was the highest. As some of these areas turned into eucalyp-tus plantation (Fig. 5), it is clear that the
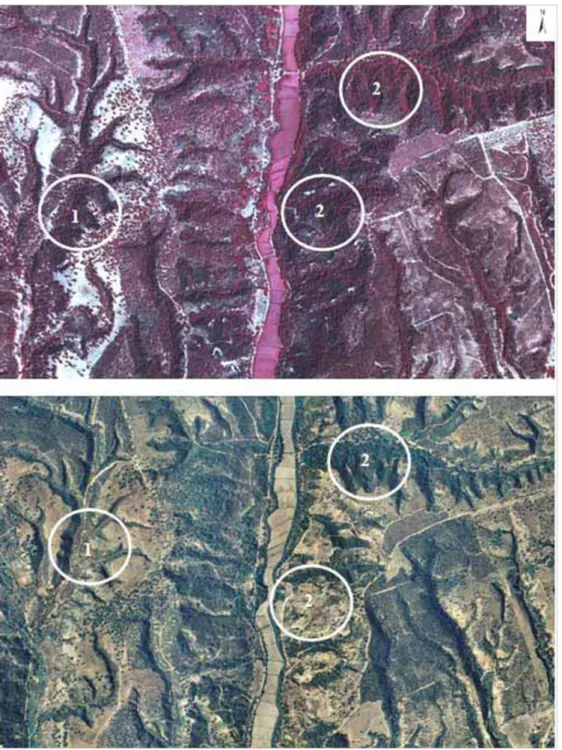
ex-Fig. 4 - Aerial photographs of
Ulme area in 1995 (colour near in-frared - top) and 2007 (true RGB colour - bottom) showing land use changes in the area burnt in 2003 (approximate scale 1:10.000): (1) In 1995, the steeper slopes and gul-lies were covered with cork oaks (in dark red tones), and in 2007 covered with shrubland (dark green tones); (2) Cork oak wood-land areas in 1995 turned into shrubland in 2007.
pansion of eucalyptus was responsible for the reduction in oak forest and shrubland ve-getation cover classes. The highest reduction in the share of shrubland occurred in areas corresponding to Regosols/Cambisols (Tab. 4).
Landscape changes from 1995 to 2007 were small regarding open farmland and eu-calyptus plantation (Tab. 1), and fire did not seem to affect the persistence of these vege-tation classes (Tab. 3). Landscape mosaic changes, as aforementioned, were mostly as-sociated with cork oak decrease (and shrub-land increase), driven by wildfire, which promoted faster changes in oak forest cover in the 1995-2007 period than those pro-moted by the eucalyptus plantation in the previous period (1958-1995).
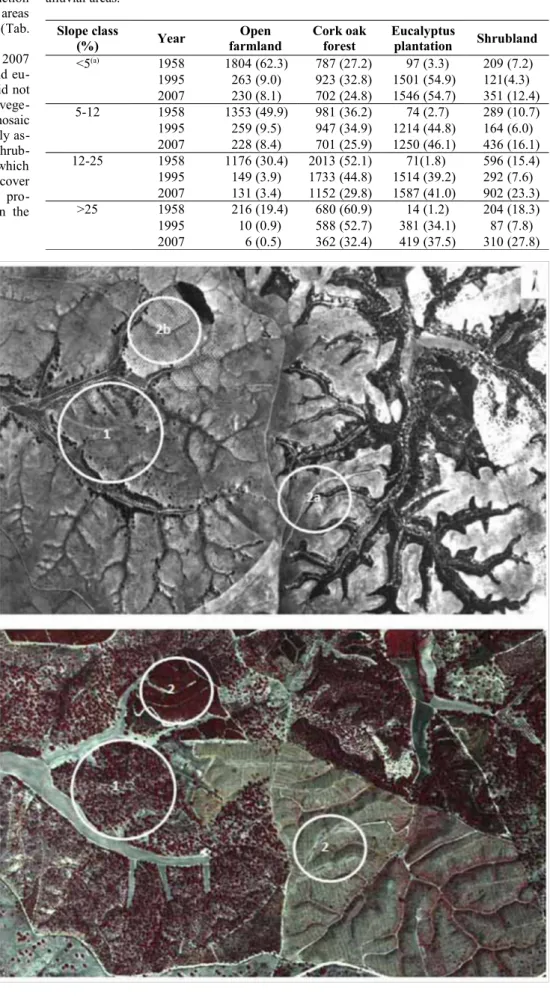
Fig. 5 - Aerial photographs of Ulme
in 1958 (black and white - top) and 1995 (near infrared colour - bottom) showing landscape features and land use changes (approximate scale 1:10.000). (1): new afforestation area with cork oak in former open farm-land (in 1958) that turned into a ma-ture cork oak forest in 1995; (2) eu-calyptus forest in 1995 established in
former open farmland (in 1958), without (2a) and with olive groves (2b).
Tab. 5 - Areas (ha) of vegetation cover classes by slope classes. Values in brackets are the
percentage relative to the total area corresponding to each slope class. (a): areas other than alluvial areas.
Slope class
(%) Year farmlandOpen Cork oak forest Eucalyptus plantation Shrubland
<5(a) 1958 1804 (62.3) 787 (27.2) 97 (3.3) 209 (7.2) 1995 263 (9.0) 923 (32.8) 1501 (54.9) 121(4.3) 2007 230 (8.1) 702 (24.8) 1546 (54.7) 351 (12.4) 5-12 1958 1353 (49.9) 981 (36.2) 74 (2.7) 289 (10.7) 1995 259 (9.5) 947 (34.9) 1214 (44.8) 164 (6.0) 2007 228 (8.4) 701 (25.9) 1250 (46.1) 436 (16.1) 12-25 1958 1176 (30.4) 2013 (52.1) 71(1.8) 596 (15.4) 1995 149 (3.9) 1733 (44.8) 1514 (39.2) 292 (7.6) 2007 131 (3.4) 1152 (29.8) 1587 (41.0) 902 (23.3) >25 1958 216 (19.4) 680 (60.9) 14 (1.2) 204 (18.3) 1995 10 (0.9) 588 (52.7) 381 (34.1) 87 (7.8) 2007 6 (0.5) 362 (32.4) 419 (37.5) 310 (27.8)
Discussion
Change in landscape composition
The strong decline in open farmland, most-ly occurring in the first study period (1958-1995), is associated with a long-standing so-cio-economic driver in the Chamusca muni-cipality, such as the declining availability of labor force in agriculture. In fact, employ-ment in this municipality in the farming sec-tor (in standard working units, SWU) de-clined by 75%, about 3579 SWU (from 4798 SWU in 1960 to 1219 SWU in 1999/2000 - GPPAA 2003).
The transition matrix obtained in this study was mostly dominated by the transition rates underlying the decline of open farmland and the increment of eucalyptus plantations (Tab. 2). This is in accordance to Salinas & Mar-ques (1985) who reported that, since 1970, in association with the abandonment of agri-cultural activities in southern Portugal, open farmland and open (oak) forest formations were largely replaced by eucalyptus planta-tions. Similar occurrences were reported for southern Extremadura and western Andalu-cia (Spain - Regato-Pajares et al. 2004, Schröder 2011). Moreover, such transitions are also in agreement with those reported by Moreira et al. (2001) for wetter areas in northern Portugal, by Pinto-Correia & Vos (2004) and Costa et al. (2011) for dryer in-land areas in southern Portugal, and by Tei-xido et al. (2010) for the Galician region (northwestern Spain), where forest expan-sion through afforestation and vegetation succession was associated with agricultural abandonment.
According to the transition matrix for the 1958-1995 period, open farmland only per-sisted in 26% of its initial area, being partly transformed into eucalyptus plantation (and to a lesser extent to cork oak forest - Tab. 2). On the other hand, eucalyptus plantations were established on open farmland and also on shrubland and oak forests, showing a conversion percentage of initial area trans-ition of 45%, 55%, and 26%, respectively. This large expansion of eucalyptus planta-tions is similar to the dynamics of rural areas in northwestern Spain (Atlantic-temperate climate), where the eucalyptus plantations were introduced in the second half of the 20th
century, along with farming abandonment (Teixido et al. 2010).
Despite large areas of oak forest being turned into eucalyptus plantation, a low overall annual loss in oak forest area oc-curred during the 1958-1995 period. This small loss was the result of intensive transi-tions related to oak forest occurred in this period (Tab. 2), with large areas of open farmland becoming oak forest, and with counterbalancing transformation of shrub-land to oak forest and vice versa.
Shrubland was reduced by half (loss rate:
0.2% year-1) within the 1958-1995 period, as
it was a source for other land cover classes, specially eucalyptus plantation (55%) and oak forest (23% - see Tab. 2). This trend, during the 1958-1995 period is in contrast to the results reported by Costa et al. (unpub-lished) for the same period for other areas in southern Portugal (Alcoutim and S. Barto-lomeu da Serra), where shrubland increased by 17.7% year-1 (corresponding to an
in-crease of 128 ha year-1) and 4.6% year-1 (3 ha
year-1), respectively. These trends were
mainly driven by adverse ecological condi-tions to new afforescondi-tions with eucalyptus, the abandonment of agriculture in marginal lands (in Alcoutim), and forest management abandonment and abnormal tree mortality (in S. Bartolomeu da Serra).
Landscape mosaic vs. biophysical
conditions
The large share of open farmland (annual cereal crops and olive groves, 46.7% - Tab. 1) in 1958 was associated with the Wheat Campaign in Portugal (1929-1937), an agri-cultural policy that provided direct support to the enhancement of crop cultivation and conversion of forest and shrubland to arable uses, despite soil and land constraints (Bap-tista 2010). However, the UL landscape mo-saic in 1958 was also strongly associated with biophysical conditions, namely the slo-pe (see Fig. 5 and Tab. 5). The share of oslo-pen farmland was largely dominant in valley floors and top flat areas. Conversely, the share of cork oak forest and shrubland was much greater in steep undulated areas sur-rounding watercourses (see Tab. 5). This pattern may be associated with less human activities in the latter areas. A similar scena-rio was reported by Acácio et al. (2009) for southern Portugal (Serra do Caldeirão), where this trend was associated with limita-tions to agriculture imposed by steep slopes and thin soils (SROA 1972b - Fig. 5).
Land cover classes were also dependent on soil type (Tab. 4). The largest share of open farmland was observed on Fluvisols in the bottom of valleys, where soil depth and moisture regime are suitable for intensive ag-riculture (SROA 1972a, 1972b). In areas where Stagnic Luvisols are predominant, the difference between the proportion of open farmland (reduced to 47.7%) and cork oak forest (reaching 40.2%) is explained by the fact that these soils occur on different slope conditions (Fig. 3B), showing limitations re-garding drainage and water availability. In areas where Regosols/Cambisols are domi-nant, the decrease in the share of open farm-land (only 38.9%) may be explained by the steeper slopes where these soils occur, which are also associated with soil depth limita-tions and erosion risks (SROA 1972a, 1972b).
Our results suggest that differences in the
share of vegetation cover classes among soil types may be mostly due to slope, confir-ming our preliminary hypothesis. Indeed, terrain slope was apparently more discri-minating for vegetation cover than soil type. In short, cork oak woodlands in 1958 sho-wed a spatial arrangement strongly framed by biophysical characteristics closely asso-ciated with the spatial arrangement of the network of watercourses (Fig. 5). However, such areas might constitute safe places for the maintenance of oak woodlands, assuring cork oak regeneration and the potential for later expansion through ecological succes-sion and the colonization of neighboring areas (Pausas et al. 2006, Pons & Pausas 2006, Plieninger 2007). According to the landscape composition, the cork oak forest in 1958 was already restricted to areas with the strongest limitations for farming (Tab. 5).
The large expansion of eucalyptus planta-tion from 1958 to 1995 at UL showed a strong association with landscape biophysi-cal conditions, with its share reduced with the increase in slope. For instance, the incre-ment in the bottom of valleys was small, as these areas are suitable for agriculture. In contrast, in the flat top areas (slope < 5%), the share of eucalyptus plantation reached 54.9% (in 1995). A strong increment in the share of eucalyptus plantation also occurred in the undulated areas (Tab. 5). However, the increase in cork oak forest also took place in the areas where the share of euca-lyptus plantation was the highest (Tab. 5). Therefore, at UL in the post-Wheat Cam-paign period (from the early 1960s forward), both eucalyptus plantations (on a larger sca-le) and cork oak forests (on a smaller scasca-le) displaced open farmland in top flat areas, where Stagnic Luvisols were dominant and the conditions were more suitable for profi-table fast-growing eucalyptus plantations.
Variations in the share of open farmland and eucalyptus plantations from 1958 to 1995 were small in areas corresponding to Fluvisols (Tab. 4), compared with those of Stagnic Luvisols and Regosols/Cambisols. Differences with respect to these soil types were negligible. Therefore, the change in the pattern of these vegetation classes seems to be mainly associated with terrain slope rather than soil type, confirming our first hy-pothesis.
The persistence of shrubland in the 1958-1995 period was lower than that exhibited by open farmland and especially that exhibited by cork oak forest. The strong reduction in the share of shrubland was observed in all slope classes, but was much greater in the steeper classes (Tab. 5). Shrubland, as well as oak forest, are more common on steepest slopes closely associated with the network of watercourses (Fig. 5). As some of these areas turned into eucalyptus plantation (Fig. 5), it
may be inferred that the expansion of euca-lyptus was responsible for the reduction in oak forest and shrubland vegetation cover classes. The highest reduction in the share of shrubland in areas corresponding to Re-gosols/Cambisols (Tab. 4) may be associated with the higher slope in the parts of the land-scape where these soils occur.
Eucalyptus was already present in the study area in 1958 by the farmers’ initiative (Men-des et al. 2004). The large availability of open farmland areas, combined with suitable ecological conditions, species’ high produc-tivity (Goes 1991), and the use of proper sil-vicultural techniques overcoming soil and terrain constraints (Magalhães 2000) turned the eucalyptus into an extremely attractive option (Fig. 5). However, eucalyptus planta-tion was also widely established in areas with steeper slopes (Tab. 5). Such marginal areas are free from grazing, and may consti-tute cork oak regeneration hotspots, which are crucial to ensure the sustainability of this ecosystem (Pons & Pausas 2006). However, such landscape spatial arrangement and functions were partially eliminated by euca-lyptus plantations, reducing also the land-scape diversity.
The massive establishment of eucalyptus plantations, however, mostly occurred until the end of the 1980s, when constraining rules for afforestation with fast-growing spe-cies such as eucalyptus were issued. In fact, the Ministerial Order no. 175/88 (May 17th,
1988) established that afforestation with the-se species is conditioned to previous autho-rization by the Forest Services. Furthermore, the Ministerial Order no. 528/89 (Nov 11th,
1989) defined specific norms and constraints for plantations of fast-growing species, na-mely the obligation of oak woodland preser-vation, in order to keep former vegetation in burnt areas and preserve natural vegetation and functions in main watercourses.
Wildfires and landscape composition
trends
Landscape composition in 2007 was sha-ped by changes mainly occurring in the pe-riod 1958-1995 and by fire occurrence (in 2003). Wildfire did not seem to affect the persistence of open farmland and eucalyptus plantation in the period 1995-2007 (Tab. 3). Landscape mosaic changes were mostly as-sociated with cork oak decrease (and shrub-land increase) driven by wildfire (Fig. 2B, Tab. 3), which determined in the period 1995-2007 faster changes in oak forest cover than those caused by eucalyptus plantations in the previous period (1958-1995).
The transitions between oak forest and shrubland were balanced in 1958-1995, whereas in 1995-2007, a much larger share of oak forest area evolved towards shrub-land. The persistence of cork oak forest was negatively affected by wildfires (Fig. 4),
gi-ven the higher persistence in the unburnt area compared with that observed in the burnt area (Tab. 3). This decrease in cork oak forest persistence was accompanied by a conversion of (burnt) cork oak forest to shrubland (Fig. 4). Therefore, in the 1995-2007 period fire accelerated the change from oak forest to shrubland areas, following the typical land cover change pattern in burnt areas of the Mediterranean region, with a fire-driven decrease in the persistence of forests (San-Miguel-Ayans et al. 2012). Also, this trend agrees with that reported by Acácio et al. (2009) for open oak forest areas in southern Portugal subjected to recurrent fire events.
Changes caused by fire, however, seem to be also dependent on landscape features, as the effect of fire devastation was much less remarkable in the steeper slopes along water-courses than in other areas (Fig. 4). Slopes might act as a buffer regarding wildfire ef-fects, contributing to the recovery of oak forest in these Mediterranean landscapes. Such considerations comply with our second hypothesis on higher resilience of cork oak vegetation to wildfires than to eucalyptus ex-pansion. Furthermore, the effects of fire on the balance between shrubland and oak fo-rests were strongly diminished on slopes (Fig. 4), where a faster ecological succession may be ensured. This is apparently in agree-ment with the findings of Acácio et al. (2009), who reported lower losses of cork oak forests on steeper slopes in southern Portugal. Although these authors empha-sized the effect of a reduced human interven-tion on steeper slopes, we hypothesized that such evidence may also be related to the bio-physical features of the studied areas affec-ting fire regimes and fire events (Catry et al. 2012).
It should be emphasized, however, that shrubland increment can occur in the ab-sence of fires, as reported by Costa et al. (2011). Local socio-economic conditions, different management systems (e.g., grazing intensities) and other causes of oak decline may explain the conversion of oak forest to shrubland. In another region (Alcoutim) lo-cated in a drier area, shrubland significantly decreased in the period 1995-2007 as com-pared to 1958-1995, since it was replaced by new pine plantations (Costa et al., unpub-lished).
Our results suggest that landscape changes in the study area were mostly driven by eco-nomic factors occurred from 1958 to 1995; later changes were mostly associated with the effects of wildfires.
Conclusions
In the studied cork oak woodland land-scape, open farmland and shrubland drasti-cally declined from 1958 to 1995, while eu-calyptus plantation exhibited a dramatic
ex-pansion. Although large areas of cork oak forest turned into eucalyptus plantation, the net loss of oak forest was low and counter-balanced by its increment on former open farmland. These changes were mainly driven by the large availability of open farmland and the high profitability of eucalyptus plantation when compared, from a short-term perspective, with both rain-fed agricul-ture and cork oak afforestation. The expan-sion of eucalyptus plantation from 1958 to 1995 led to shrinkage of shrubland and oak forest areas. Landscape changes in the pe-riod 1995-2007 were strongly affected by wildfires and mostly restricted to the shift from oak forest to shrubland. Trends of land-scape composition changes after the fire events may be related to landowners’ deci-sions, due to legal constraints ruling the plantation of fast-growing species in burnt areas. Landscape composition changes were also driven by biophysical conditions, due to limitations imposed by soils and steep slopes surrounding watercourses. Slope may play a major role in the landscape change process compared with soil type, as it constitutes a strong limitation for human intervention.
Our study demonstrates that monitoring the landscape dynamics in a Mediterranean re-gion allows the assessment of the impact of long-term socio-economic strategies on oak woodlands. However, extreme events such as wildfires, existing laws and regulations aimed to the conservation of oak woodlands, and the biophysical features of the landscape also play a crucial role in the dynamics of cork oak forests.
Acknowledgements
We thank Filipa Vidas for its contribution in the geo-referencing of the Geological Map. We acknowledge two anonymous re-viewers for their comments on an earlier ver-sion of the manuscript.
References
Acácio V, Holmgren M, Rego F, Moreira F, Mohren GMJ (2009). Are drought and wildfires turning Mediterranean cork oak forests into per-sistent shrublands? Agroforestry Systems 76: 389-400. - doi: 10.1007/s10457-008-9165-y
AFN (2010). Mapa de áreas ardidas [Burned Area Map]. Autoridade Florestal Nacional, Lisbon, Portugal. [online] URL: http://www.afn.min-ag- ricultura.pt/portal/dudf/cartografia/ma-pas-de-areas-ardidas
Andrieu E, Ladet S, Heintz W, Deconchat M (2011). History and spatial complexity of defore-station and logging in small private forests. Landscape and Urban Planning 103: 109-117. - doi: 10.1016/j.landurbplan.2011.06.005
Baptista FO (2010). Alentejo: a questão da terra [Alentejo, the question of land]. 100 Luz, Lis-bon, Portugal. [in Portuguese]
Baker WL (1989). A review of models of land-scape change. Landland-scape Ecology 2 (2):111-133.
- doi: 10.1007/BF00137155
Bugalho MN, Caldeira MC, Pereira JS, Aronson J, Pausas JG (2011). Mediterranean cork oak sa-vannas require human use to sustain biodiversity and ecosystem services. Frontiers in Ecology and the Environment 9: 278-286. - doi: 10.1890/100 084
Cano F, Navarro RM, Ferrer AG (2003). Evolu-ción de la cubierta de alcornoque en un monte afectado por la seca (La Alcaidesa-Cádiz) me-diante una secuencia de fotografías aéreas [Ca-nopy cover change in endangered oak forests (Cádiz) based on an aerial photo sequence]. Eco-logia 17:131-144. [in Spanish]
Capelo J, Mesquita S, Costa JC, Ribeiro S, Arsénio P, Neto C, Monteiro-Henriques T, Aguiar C, Honrado J, Espírito-Santo D, Lousã M (2007). A methodological approach to potential vegetation modeling using GIS techniques and phytosociological expert-knowledge: application to mainland Portugal. Phytocoenologia 37 (3/4): 399-415. - doi: 10.1127/0340-269X/2007/0037-0399
Cardoso JVC (1965). Os solos de Portugal. Sua classificação, caracterização e génese. 1 - A Sul do rio Tejo [The soils of Portugal. Classification, characterization and genesis. 1 - South of the Tagus river]. DGSA, Lisboa, Portugal. [in Portu-guese]
Catry FX, Moreira F, Cardillo E, Pausas JG (2012). Post-fire management of cork oak forests. In: “Post-fire management and restora-tion of Southern European forests” (Moreira F, Arianoutsou M, Corona P, De las Heras J eds). Series Managing Forest Ecosystems, vol. 24, Springer, London, UK, pp. 195-222.
Costa A, Madeira M, Oliveira AC (2008). The re-lationship between cork oak growth patterns and soil, slope and drainage in a cork oak woodland in southern Portugal. Forest Ecology and Mana-gement 255: 1525-1535. - doi: 10.1016/j.foreco. 2007.11.008
Costa A, Pereira H, Madeira M (2009). Landscape dynamics in endangered cork oak woodlands in southwestern Portugal (1958-2005). Agroforestry Systems 77: 83-96. - doi: 10.1007/s10457-009-9212-3
Costa A, Pereira H, Madeira M (2010). Analysis of spatial patterns of oak decline in cork oak woodlands in Mediterranean conditions. Annals of Forest Sciences 67: 2 - doi: 10.1051/forest/ 2009097
Costa A, Madeira M (2011). Assessment of Medi-terranean evergreen oak (Quercus suber L.) woodlands loss. Consequences of climate change effects: a case study at south-western Portugal. In: Proceedings of the “Global Conference on Global Warming”. Lisbon (Portugal) 11-14 July 2011. [online] URL: http://www.cge.uevora.pt/ GCGW/presentations/97-127-1-RV.pdf
Costa A, Madeira M, Santos JL, Oliveira A (2011). Change and dynamics in Mediterranean evergreen oak woodlands landscapes of south-western Iberian peninsula. Landscape and Urban Planning 102 (3): 164-176. - doi: 10.1016/j. landurbplan.2011.04.002
DGRF (2007). Resultados do Inventário Florestal Nacional 2005/06 [Results from the National Forest Inventory 2005/06]. Inventário Florestal Nacional, Direcção-Geral dos Recursos Flores-tais, Lisboa, Portugal. [in Portuguese]
Goes E (1991). A floresta portuguesa - sua im-port’ncia e descrição das espécies de maior in-teresse [Portuguese forest - its importance and description of major species]. Portucel, Lisbon, Portugal, pp. 159. [in Portuguese]
Gonçalves F, Zbyszevski G, Carvalhosa A, Coelho AP (1979). Carta Geológica de Portugal na Es-cala 1/50.000. Notícia Explicativa da Folha 27-D (Abrantes) [Geological Map of Portugal, Scale 1/50.000. Explanatory News Sheet 27-D (Abrantes)]. Serviços Geológicos de Portugal, Lisboa, Portugal. [in Portuguese]
GPPAA (2003). Portugal rural: territórios e di-n’micas [Rural Portugal: territory and dinamics]. Gabinete de Planeamento e Políticas Agro-ali-mentares, ISA, Portugal. [CD-ROM, in Por-tuguese]
Huntsinger L, Bartolome JW (1992). Ecological dynamics of Quercus dominated woodlands in California and southern Spain: a state-transition model. Vegetatio 99-100 (1): 299-305. - doi:
10.1007/BF00118237
IA (2010). Atlas do Ambiente [Digital Atlas of the Environment]. Agência Portuguesa do Ambiente. [online] URL: http://sniamb.apambiente.pt/web atlas/
Joffre R, Rambal S, Ratte JP (1999). The dehesa system of southern Spain and Portugal as a natu-ral ecosystem mimic. Agroforestry Systems 45 (3): 57-79. - doi: 10.1023/A:1006259402496
Magalhães MCS (2000). Efeitos de técnicas de preparação do solo e gestão dos resíduos org’ni-cos em características físico-químicas do solo de plantações florestais [Effects of preparation tech-niques of soil and management of organic waste on physico-chemical characteristics of the soil of forest plantations]. PhD thesis, Universidade Técnica de Lisboa, Instituto Superior de Agro-nomia, Lisbon, Portugal, pp. 170. [in Por-tuguese]
Manning AD, Fischer J, Lindenmayer DB (2006). Scattered trees are keystones - Implications for conservation. Biological Conservation 132: 311-321. - doi: 10.1016/j.biocon.2006.04.023
Martínez S, Ramil P, Chuvieco E (2010). Moni-toring loss of biodiversity in cultural landscapes. New methodology based on satellite data. Land-scape and Urban Planning 94: 127-140. - doi:
10.1016/j.landurbplan.2009.08.006
Mendes AMSC, Dias RARS (2001). Financial in-struments of forest policy in Portugal in the ’80s and ’90s. Faculty of Economics and Manage-ment, Portuguese Catholic University, Porto, Portugal. [online] URL: http://www.metla.fi/ eu/cost/e19/
Mendes AMSC, Feliciano D, Tavares M, Dias R (2004). The Portuguese forests: country level re-port delivered to the EFFEProject - Evaluating financing of forestry in Europe. Faculty of Eco-nomics and Management, Portuguese Catholic University, Porto, Portugal.
Myers N, Mittermeier RA, Mittermeier CG (2000). Biodiversity hotspots for conservation priorities. Nature 403: 853-858. - doi: 10.1038/ 35002501
Moreira F, Rego FC, Ferreira PG (2001). Tempo-ral (1958-1995) pattern of change in a cultuTempo-ral landscape of northwestern Portugal: implications for fire occurrence. Landscape Ecology 16: 557-567. - doi: 10.1023/A:1013130528470
Pereira PM, Fonseca MP (2003). Nature vs. nur-ture: the making of the montado ecosystem. Con-servation Ecology 7 (3): 7. [online] URL: http:// www.ecologyandsociety.org/vol7/iss3/art7/
Pinto-Correia T (2000). Future development in Portuguese rural areas: how to manage agricul-tural support for landscape conservation? Land-scape and Urban Planning 50: 95-106. - doi:
10.1016/S0169-2046(00)00082-7
Pinto-Correia T, Vos W (2004). Multifunctional-ity in Mediterranean landscapes - past and fu-ture. In: “The New Dimensions of the European Landscape” (Jongman R ed). EU Frontis Series, Springer, Wageningen, The Netherlands, pp. 135-164.
Plieninger T (2006). Habitat loss, fragmentation and alteration - quantifying the impact of land use changes on a Spanish dehesa landscape by the use of aerial photographs and GIS. Land-scape Ecology 21: 91-105. - doi: 10.1007/s109 80-005-8294-1
Plieninger T (2007). Compatibility of livestock grazing with stand regeneration in Mediterranean holm oak parklands. Journal for Nature Conser-vation 15(1): 1-9. - doi: 10.1016/j.jnc.2005.09.0 02
Plieninger T, Bieling C (2012). Connecting cul-tural landscapes to resilience. In: “Resilience and the cultural landscape. Understanding and man-aging in human-shaped environments” (Plien-inger T, Boieling C eds). Cambridge University Press, Cambridge, UK, pp. 3-26.
Plieninger T, Schleyer C, Mantel M, Hostert P (2012). Is there a forest transition outside fo-rests? Trajectories of farm trees and effects on ecosystem services in an agricultural landscape in eastern Germany. Land Use Policy 29: 233-234. - doi: 10.1016/j.landusepol.2011.06.011
Pausas JG, Ribeiro E, Dias SG, Pons J, Beseler C (2006). Regeneration of a marginal Quercus
suber forest in the eastern Iberian peninsula.
Journal of Vegetation Science 17: 729-738. - doi: 10.1111/j.1654-1103.2006.tb02496.x
Pons J, Pausas JG (2006). Oak regeneration in heterogeneous landscapes: the case of fragmen-ted Quercus suber forests in the eastern Iberian peninsula. Forest Ecology and Management 231: 196-204. - doi: 10.1016/j.foreco.2006.05.049
Regato-Pajares P, Jiménez-Caballero S, Castejón M, Elena-Rosselló R (2004). Recent landscape evolution in dehesa woodlands of western Spain. In: “Recent dynamics of the Mediterranean ve-getation and landscape” (Mazzoleni S, Di Pas-quale G, Mulligan M, Di Martino P, Rego F eds). John Wiley and Sons, Chichester, UK, pp. 57-72.
eu-calipto em Portugal: seu enquadramento legal [The expansion of eucalyptus plantations in Por-tugal: legal framework]. In: Proceedings of the “I Congresso sobre o Alentejo: semeando novos rumos”. Évora (Portugal) October 1985. Asso-ciação dos Municípios do Distrito de Beja, Beja, Portugal, vol. 2, pp. 590-594. [in Portuguese] San-Miguel-Ayans J, Rodrigues M, Oliveira SS,
Pacheco CK, Moreira F, Duguy B, Camia A (2012). Land cover change and fire regime in the European Mediterranean region. In: “Post-fire management and restoration of Southern European forests” (Moreira F, Arianoutsou M, Corona P, De las Heras J eds). Series Managing Forest Ecosystems, vol. 24, Springer, London, UK, pp.21-43.
Santos MJ, Thorne J (2010). Comparing culture and ecology: conservation planning of oak wood-lands in Mediterranean wood-landscapes of Portugal and California. Environmental Conservation 37 (2): 155-168. - doi: 10.1017/S0376892910000 238
Schröder C (2011). Land use dynamics in the de-hesas in the Sierra Morena (Spain): the role of
diverse management strategies to cope with the drivers of change. European Countryside 2: 93-110.
Skalos J, Engstova B (2010). Methodology for mapping non-forest wood elements using histo-ric cadastral maps and aerial photographs as a basis for management. Journal of Environmental Management 91: 831-843. - doi: 10.1016/j.jenv-man.2009.10.013
SROA (1972a). Serviço de Reconhecimento e de Ordenamento Agrário - Carta de Solos de Por-tugal na Escala 1/50 000, folha 27-D [Agricul-tural Recognition and Planning Service - Soil Map of Portugal in Scale 1/50 000, sheet 27-D]. Serviço de Reconhecimento e de Ordenamento Agrário, Secretaria de Estado da Agricultura, Lisboa, Portugal. [in Portuguese]
SROA (1972b). Serviço de Reconhecimento e de Ordenamento Agrário - Carta de Capacidade de Uso do Solo na Escala 1/50 000, folha 27-D [Agricultural Recognition and Planning Service - Map of Land use Capability of Portugal in Scale 1/50 000, sheet 27-D]. Serviço de Reconheci-mento e de OrdenaReconheci-mento Agrário, Secretaria de
Estado da Agricultura, Lisboa, Portugal. [in Por-tuguese]
Teixido AL, Quintanilla LG, Carreño F, Gutiérrez D (2010). Impacts of changes in land use and fragmentation patterns on Atlantic coastal forests in northern Spain. Journal of Environmental Management 91: 879-886. - doi: 10.1016/j.jenv-man.2009.11.004
Urbieta IR, Zavala MA, Marañón T (2008). Hu-man and non-huHu-man determinants of forest com-position in southern Spain: evidence of shifts to-wards cork oak dominance as a result of manage-ment over the past century. Journal of Biogeo-graphy 35: 688-1700. - doi: 10.1111/j.1365-26 99.2008.01914.x
Vallejo R, Aronson J, Pausas JG, Cortina J (2006). Restoration of Mediterranean wood-lands. In: “Restoration ecology: The new fron-tier” (Van Andel J, Aronson J eds), Blackwell Science, Oxford, UK, pp. 193-207.
WRB (2006). World reference base for soil re-sources. A framework for international classifi-cation, correlation and communication. World Soil Reports no. 103, FAO, Rome, Italy.