Isotopic abundance of
13C and contribution of
eucalyptus biomass to soil organic matter conversion
Abundância isotópica do 13C e contribuição da biomassa de eucalipto na conversão da matéria orgânica do solo
Fabiane Figueiredo Severo1 Natália Tobin Aita1 Laila Garcia Marques1 Leandro Souza da Silva2 ISSNe 1678-4596
INTRODUCTION
In recent decades, Eucalyptus (Eucalyptus
grandis) began to be planted in many native
grassland areas in the south of Rio Grande do Sul State. Eucalyptus plantation in these areas has been criticized for several different reasons, but dryness and nutritional soil impoverishment are the most often mentioned. Nutritional soil impoverishment is the decline in soil organic matter (SOM) content in soil over years of planting and the excessive removal of nutrients with little contribution to them from Eucalyptus cultivation (VIANA, 2004). Many studies have been conducted regarding carbon behavior in areas where Eucalyptus trees are planted and which
once were native forests and native grasslands. Reports indicated an organic carbon decline in the initial years after the introduction of Eucalyptus forests. Carbon content decline in forest soils occurred mainly in the
first years of cultivation and it is related to land use change. This behavior was observed in the first 0.40m
depth (CASTRO FILHO et al., 1991; NILSSON & SCHOPFHAUSER, 1995). After 20-40 years of cultivation, the SOM content may return almost to the starting point, depending on site management (SPECHT & WEST, 2003). In some places, after several Eucalyptus cycles, SOM levels recovered, but to intermediate levels between degraded pastures and native forest soils (LEITE et al., 2010). It is critical to know SOM conversion in those areas for proper 1Universidade Federal de Santa Maria (UFSM), Santa Maria, RS, Brasil.
2Departamento de Solos, Universidade Federal de Santa Maria (UFSM), 97105-900, Santa Maria, RS, Brasil. E-mail: [email protected].
Corresponding author.
ABSTRACT: It has become possible to evaluate the conversion of soil organic matter (SOM) in pastures and arboreal crops due to the difference between the photosynthetic cycles of Eucalyptus (C3) and most grasses (C4). The auto analyzer method coupled to the IRMS (Isotope Ratio Mass Spectrometer) in the present study evaluated the 13C content in soil profiles of Eucalyptus plantations of different ages (2,
10 and 21 years), in natural regeneration areas and natural grazing fields, and estimated the SOM conversion of each crop type of. The initial management of all sampled areas was natural pasture. The following profile layers were evaluated:0-5, 5-10, 10-20, 20-30, 30-40, 40-50, 50-70 and 70-90cm, and the contribution of Eucalyptus biomass over the years of farming was estimated in the SOM conversion process. After 2 years of planting Eucalyptus, the beginning of pasture carbon conversion process occurred in the surface layer (0-5cm). Ten years after planting, the process of converting organic matter by arboreal crops reached the layers up to 20cm. After 21 years of planting and in natural regeneration areas, the entire profile has already been changed by planting Eucalyptus and native tree species.
Key words: cycle C3, cycle C4, Eucalyptus grandis.
RESUMO: A avaliação da conversão da matéria orgânica do solo (MOS) entre pastagens e cultivos arbóreos, tornou-se possível graças a
diferença entre os ciclos fotossintéticos do eucalipto (C3) e da maioria das gramíneas (C4). Com o autoanalisador acoplado ao IRMS (isotope ratio mass spectrometer) e a avaliação da abundância isotópica de 13C, o presente estudo estimou a conversão da MOS em perfis do solo sob
plantio de eucaliptos de diferentes idades (2, 10 e 21 anos), em área de regeneração natural e em campo de pastagem natural. O manejo inicial de todas as áreas amostradas era de pastagem natural. Foram avaliadas as seguintes camadas do perfil: 0-5, 5-10, 10-20, 20-30, 30-40, 40-50, 50-70 e 70-90cm. Assim como estimada a contribuição proveniente da biomassa de eucaliptos ao longo dos anos de cultivo no processo de conversão da MOS. Após 10 anos de plantio, o processo de conversão da matéria orgânica nos cultivos arbóreos atingiu as camadas até 20cm. Após 21 anos de plantio e na área de regeneração natural, todo o perfil já sofreu alteração pelo plantio de eucaliptos e espécies arbóreas nativas.
Palavras-chave: ciclo C3, ciclo C4, Eucalyptus grandis.
planning of management practices and environmental impacts of crops in different environments where the Eucalyptus is grown.
Understanding the SOM dynamics in areas converted from pasture to arboreal crops, such as Eucalyptus for example, is easier if the management of the types of vegetation in the area is known, and with the later determination of the natural isotopic abundance of carbon in the area. The variation in the natural abundance of 13C has been used to assess the
impact of different land uses and managements in SOM fractions in various parts of Brazil (SA et al., 2001; SISTI et al., 2004). In nature, approximately 98.89% of all carbon are 12C and 1.11% is 13C and
the value of these two isotopes may vary as a result of fractionation during physical, chemical and biological natural processes (BOUTTON, 1991a). The natural abundance of C allows characterizing SOM and is related to the photosynthetic pathway
of C isotope fixation of the predominant vegetation.
Type C3 plants (e.g. eucalyptus) discriminate part of 13C compared to 12C, resulting in lower soil levels
of 13C; and plants of the C4 type (most grasses)
fix 13C in higher proportions than type C3, which
creates differences in the natural abundance of
13C (GOLCHIN et al, 1995; MARTINELLI et al.,
2009). To estimate the relative SOM contribution of each vegetation type, it is possible to apply the isotope mixture model (MARTINELLI et al., 2009), according to equation (1):
Where: C4%: percentage of SOM
stemming from the C4 vegetation in the soil; δ13C:
delta value provided by the IRMS equipment for the evaluated soil, C3 plant tissue (eucalyptus) and C4 plant tissue (pasture grass).
This model is used when there are two distinct sources of isotopes and their relative contributions can be estimated by this equation, which is simply a mass balance combined with an isotopic balance expression (MARTINELLI et al., 2009). It can be used in studies where there is an exchange of C3 species for C4 or vice versa, as it allows verifying the impact of these different area managements (MARTINELLI et al, 2009; COSTA et al, 2009; PEGORARO et al 2011). This study aimed to quantify the natural abundance of 13C in
Eucalyptus plantations of different ages, in a natural regeneration area, and in an adjacent pasture under the same conditions for planting and, from that, to estimate the SOM conversion between native pasture and areas planted with Eucalyptus and native species.
MATERIALS AND METHODS
The study area is located in the municipality of São João do Polesine, in the central region of Rio Grande do Sul, at the transition between the Plateau and the Central Depression regions. The climate presents
Cfa, according to the Köppen classification. The annual
average minimum temperature is from about 14°C and average annual maximum of 25°C. The annual rainfall average is 1700mm (BURIOL et al., 1979).
The study was conducted in Eucalyptus forests aged in 2(E1), 10(E2) and 21 (E3) year-old forests, native pasture (NP) and natural regeneration area (NR). The approximate area location for sampling in E1 is 29°39’23 (latitude) and 53°25’28 (longitude) in E2 is 29°39’16 (latitude) and 53°26’07 (longitude), E3 is 29°39’20 (latitude) and 53°26’10 (longitude), NP is 29°39’25 (latitude) and 53°26’06 (longitude) and NR is 29°39’28 (latitude) and 53°26’10 (longitude). Sites had no prior preparation or subsequent application of chemical lime and/or fertilizer, only controlling for ants. The E3 area was
in its second planting cycle and E2 and E1 in the first
cycle. Species planted in the area was Eucalyptus
grandis. The tree which was cut was about 10 years
old usually used to make fence posts. The natural regeneration area has contained the expected species for this region, such as Luehea grandiflora(açoita cavalo) and Cinnamomum zeylanicum (caneleira), since for 21 years no kind of management was performed in the area. Native pasture (CN) was dominated by typical grasses of the Pampa biome region, Paspalum notatum (capim forquilha) and Axonopus jesuiticus (missionary grass), and the area did not undergo any mechanical interferences and/or fertilizations of any kind, and was used for extensive cattle pastures.
The native pasture (NP) was dominated by typical grasses of the Pampa biome region such
as Paspalum notatum and Axonopus jesuiticus and
the area did not suffer mechanical treatment and/or fertilization, and has been used for extensive grazing of cattle. This area was not managed in the last 21 years.
sub-samples were collected to compose a sample and then were placed in plastic bags. According to the
FAO soil classification (WRB, 2006), the soil from
NP belongs to the Haplic Cambisols class, the soils
from NR, E2 and E1 are classified as Regosols and the
soil from E3 area as Arenosols. In total, 15 trenches with eight depths of each trench were excavated for 120 soil samples.
In NR, leaves of various species present in the area were collected. In NP, three sampling points measuring 50cm x 50cm were delimited for the subsequent cutting of the aerial part of grasses. . Once they had been sampled, roots and macroscopic residues of soil samples were removed manually after being dried at 60°C to constant weight, ground and sieved to 1mm.
Aliquots used for analysis were previously macerated in an agate stone mortar and pestle ensuring that they were uniformly ground. Plant tissue samples were stored in paper bags, dried at constant weight at a temperature below 55°C and ground in a Wiley mill. In an auto analyzer (Flash 1112 Advantage model) coupled to the IRMS (isotope ratio mass spectrometer) (Delta V Advantage IRMS model), both from Thermo
Scientific, between 1 and 2mg of sample (soil and plant tissue) were used for δ13C and C content determination.
The values of isotopic abundance of carbon (δ13C) in
soil and plant tissue samples were determined and the SOM conversion based on vegetation estimated according to equation 1.
Results were obtained from the analysis and characterization via auto analyzer. Sets whose values were greater or equal to 95% (P<0.05) for each sample done in triplicate were considered accurate. The comparison between the soil layers,
within the same profile and same depth for each site,
was performed by a T-test (Student) with P<0.05, or
95% confidence. The input factors were δ13C value and carbon content representing true triplicates (n=3). The Excel software was generally used.
RESULTS AND DISCUSSION
Eucalyptus leaves collected at the site presented a value of -30.3‰ abundance of 13C, while
the plant tissue of the grasses in this area presented a value of -14.98‰ and the mean of the values of 13C of the leaves in the NR area were -32.2‰. Values experimentally found were consistent with what is reported in the literature wherein photosynthetic cycle C3 plant tissues exhibit lower isotopic values
(δ13C),ranging from -20.0 to -32.0‰, with an average
-27.0‰, while the δ13C values of C4 species are larger,
ranging from -9.0‰ to -17.0‰, averaging -13.0‰. (BOUTTON, 1991b; SILVA et al., 2013). In soil, the
greater δ13C values reported in this study were found
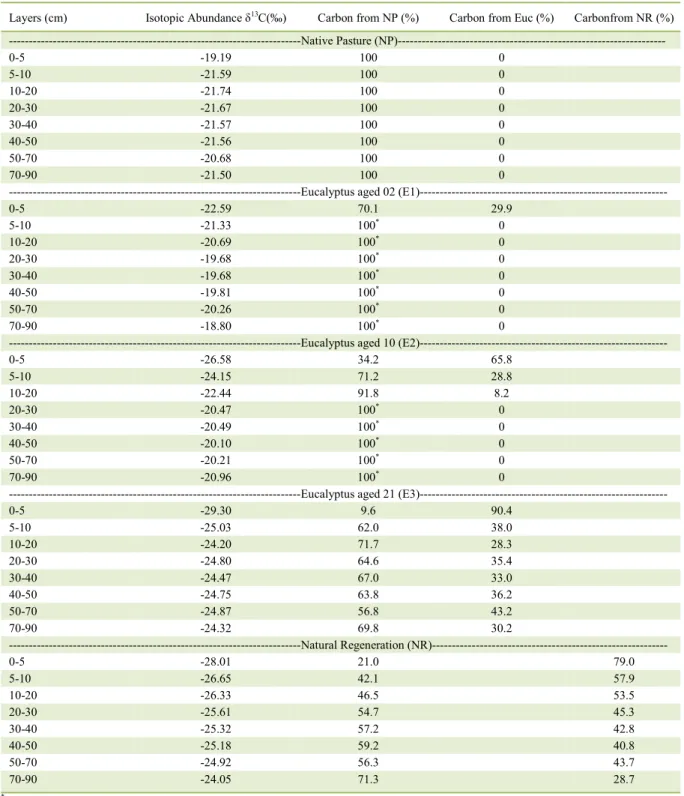
in the surface layer (0-5cm) NP (-19.19‰) (Table 1), which indicated the largest contribution coming from C-C4 plants (in this case predominantly grasses) in SOM (SMITH & EPSTEIN, 1971) and the remaining layers showed values close to each other, or similar
isotopic values along the profile.
From the isotopic dilution calculation, it was possible to follow the SOM carbon conversion process among the types of management studies (Table 1). Values obtained with the isotopic dilution calculation were limited to 100% considering a margin of error that may overstate conversion values and undermine the interpretations. During the plant material decomposition process enrichment of 1 to 2‰ 13C occurred in SOM due to loss
of 12C atoms of the vegetation and soil (MARTINELLI et
al., 2009). It is also necessary to evaluate the effects of the
13C and 14C concentration decline which occurred mainly
in the atmosphere in the last century. This took place at the start of the industrial era, since the emission rate of CO2 increased at 4% per year, which caused a dilution effect of these isotopes, the so-called Suess’s effect (SUESS, 1955; EKDAL & KEELING, 1973). Isotopic decrease in the 13C over the soil profile can reach up to 3‰ due to this
phenomenon (MARTINELLI et al., 2009).
In the 2 - year old Eucalyptus (E1) only the
surface layer (0-5cm) showed a significant decrease in
13C values regarding the subsurface layer (Table 2). Thus
it showed an amount of carbon already derived from planting Eucalyptus (29.9%), while the other layers continued to have 100% of the carbon from pasture. Ten
years after planting (E2) there was significant decrease in the amount of 13C in the profile between layers 5-10cm, 10-20cm and 20-30cm, and this was reflected
in the carbon values derived from eucalyptus. In this
profile up to 20cm deep there was interference from the
Eucalyptus management in carbon content and at greater depths it was observed that the isotopes were maintained similarly to the natural pasture site (NP). Comparing the results in E1 and E2, it is possible to see the evolution of
the carbon cycling process covering the profile, as in E2
there is differentiation in 13C values between the layers
0-5 and 5-10cm (Table 2). A 10-20cm layer already has 8.2% carbon from Eucalyptus possibly through their roots, which denoted the beginning of pasture carbon conversion process in this layer.
of carbon derived from eucalyptus in the 0-20cm layer after 20 years of cultivation (PULRLNIK et at 2009) and an annual mean rate of substitution in the d0-5cm layer of 0.43% in a 32-year planting (LIMA et
al.; 2006), both in clayey feral sols. This low carbon exchange rate is attributed to lack of soil preparation in the study area, mild weather conditions (dry winter and altitude), very clayey soil texture and plenty of iron
Table 1 - Isotopic Abundance 13C and % carbon from different management areas.
Layers (cm) Isotopic Abundance δ13C(‰) Carbon from NP (%) Carbon from Euc (%) Carbonfrom NR (%)
---Native Pasture (NP)---
0-5 -19.19 100 0
5-10 -21.59 100 0
10-20 -21.74 100 0
20-30 -21.67 100 0
30-40 -21.57 100 0
40-50 -21.56 100 0
50-70 -20.68 100 0
70-90 -21.50 100 0
---Eucalyptus aged 02 (E1)---
0-5 -22.59 70.1 29.9
5-10 -21.33 100* 0
10-20 -20.69 100* 0
20-30 -19.68 100* 0
30-40 -19.68 100* 0
40-50 -19.81 100* 0
50-70 -20.26 100* 0
70-90 -18.80 100* 0
---Eucalyptus aged 10 (E2)---
0-5 -26.58 34.2 65.8
5-10 -24.15 71.2 28.8
10-20 -22.44 91.8 8.2
20-30 -20.47 100* 0
30-40 -20.49 100* 0
40-50 -20.10 100* 0
50-70 -20.21 100* 0
70-90 -20.96 100* 0
---Eucalyptus aged 21 (E3)---
0-5 -29.30 9.6 90.4
5-10 -25.03 62.0 38.0
10-20 -24.20 71.7 28.3
20-30 -24.80 64.6 35.4
30-40 -24.47 67.0 33.0
40-50 -24.75 63.8 36.2
50-70 -24.87 56.8 43.2
70-90 -24.32 69.8 30.2
---Natural Regeneration (NR)---
0-5 -28.01 21.0 79.0
5-10 -26.65 42.1 57.9
10-20 -26.33 46.5 53.5
20-30 -25.61 54.7 45.3
30-40 -25.32 57.2 42.8
40-50 -25.18 59.2 40.8
50-70 -24.92 56.3 43.7
70-90 -24.05 71.3 28.7
and aluminum oxides (PULROLNIK et al., 2009), and compounds which can form coordination complexes with the SOM in order to stabilize it (ZINN et al., 2005). In this study, it can be inferred that the carbon conversion rate between grass land and Eucalyptus may be higher due to different soil and edaphoclimatic conditions as described earlier, as higher average rainfall, low aluminum content, sandy soil types and less protection from SOM. The difference between the thicknesses of the evaluated layers (0-5 and 0-10cm) can also facilitate the overestimation of grassland carbon that was converted.
However, it is necessary to take into account the variability of 13C values, a fact that
should lead to a cautious interpretation of these data. The differences between the absolute values
13C in the surface layers E1 and NP are small and not
significant. Thus, the calculation of isotopic dilution
may give us overestimated carbon conversion values in the area. In this way the value of carbon reported in the surface layer from planting eucalyptus as E1 (29.9%) may not be considered an absolute quantitative evaluation, although it can be used to indicate the advance of the cycling process of this element in the surface layer.
After 21 years of cultivation (E3), area E3
presented a differentiation of δ13C values between the
layers up to 20cm, which qualifies a sharp reduction
of natural isotoposes of carbon, and at deeper layers these values were stabilized (-24‰). According to the isotope dilution model it can be inferred that all the
organic matter in the profile has already undergone
interference from Eucalyptus planting, probably through carbon cycling coming from the plant root system. The 21-year plantation areas (E3) and pasture area (NP) showed constant values of 13C from 10cm
and 5cm depth, about -24‰ and -21‰ respectively. The 13C content in the NP area possibly had been
stable for 21 years and then eucalyptus was planted and the isotopic composition of soil again attained a situation of equilibrium. As the evaluated areas are of different soil classes, it is important to note that
this may end up influencing the dynamics of the
distribution and occurrence of isotopes between the
layers of the assessed profile.
In NR, 13C values reported in the evaluated
profile layers ranged from -28‰ to -24‰. There was no significant variation in these values between the
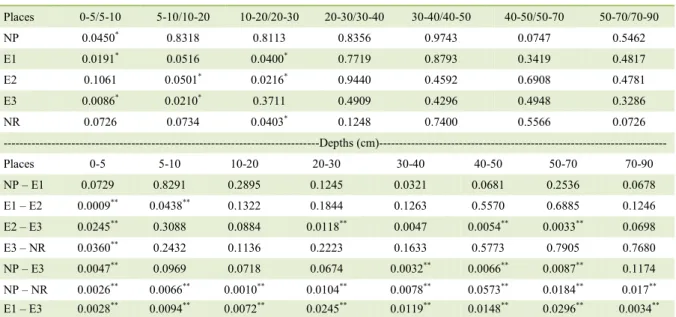
layers and it shows that there is possibly a tendency for the stabilization of the abundance of isotopes Table 2 - Probability values (p) t test (Student) obtained in the comparisons of δ13C values between pairs of adjacent layers of the soil
profile at a same location and between pairs from different locations in the same layer of the soil profile.
---Layers (cm)---
Places 0-5/5-10 5-10/10-20 10-20/20-30 20-30/30-40 30-40/40-50 40-50/50-70 50-70/70-90
NP 0.0450* 0.8318 0.8113 0.8356 0.9743 0.0747 0.5462
E1 0.0191* 0.0516 0.0400* 0.7719 0.8793 0.3419 0.4817
E2 0.1061 0.0501* 0.0216* 0.9440 0.4592 0.6908 0.4781
E3 0.0086* 0.0210* 0.3711 0.4909 0.4296 0.4948 0.3286
NR 0.0726 0.0734 0.0403* 0.1248 0.7400 0.5566 0.0726
---Depths (cm)---
Places 0-5 5-10 10-20 20-30 30-40 40-50 50-70 70-90
NP – E1 0.0729 0.8291 0.2895 0.1245 0.0321 0.0681 0.2536 0.0678
E1 – E2 0.0009** 0.0438** 0.1322 0.1844 0.1263 0.5570 0.6885 0.1246
E2 – E3 0.0245** 0.3088 0.0884 0.0118** 0.0047 0.0054** 0.0033** 0.0698
E3 – NR 0.0360** 0.2432 0.1136 0.2223 0.1633 0.5773 0.7905 0.7680
NP – E3 0.0047** 0.0969 0.0718 0.0674 0.0032** 0.0066** 0.0087** 0.1174
NP – NR 0.0026** 0.0066** 0.0010** 0.0104** 0.0078** 0.0573** 0.0184** 0.017**
E1 – E3 0.0028** 0.0094** 0.0072** 0.0245** 0.0119** 0.0148** 0.0296** 0.0034**
*P values less than 0.05 indicate significant differences in the respective pair of layers. **P values less than 0.05 indicate significant
in the area. All the profile layers in the E3 and NR already have been influenced by management and
carbon content derived from these plants can cause
a significant increase in SOM in these areas in a few decades. This behavior was confirmed in a Brazilian
Atlantic Forest area that, after 35 years of natural regeneration, presented almost 100% of C from tree species and a typical C3 cycle. This change occurred
in the entire profile and can be attributed to the C
input derived from the roots of woody plants, even at depths greater than 40cm, where it is expected that the dynamics of C from the surface was slower not
contributing significantly to the increase of SOM
(COUTINHO et al., 2010).
It is also important to note that the total carbon exchange cannot occur completely and take years due to the presence of organic carbon material belonging to stabilized and protected pasture. In
general, most of the humified carbon in SOM is in
most recalcitrant forms and in greater interaction with the soil mineral colloidal matrix (STEVENSON, 1994), a mechanism that hinders the access of microorganisms and their enzymes to the organic substrate (BALESDENT et al., 2000).
The difference in isotopic abundance in the surface layer between the E1, E2 and E3 was
significant (Table 2). After 2 years of Eucalyptus (E1) it has not been possible to see significant
differences in the natural values of 13C abundance between the NP sampled in any of the layers. This
behavior is confirmed by BALIEIRO et al. (2008),
wherein replacement of the Panicum maximum
pasture (capim mombaça) by Eucalyptus grandis did not significantly alter the isotopic composition of
SOM relative to pasture in the surface layers and also
COUTINHO et al. (2010) who reported no significant
differences in carbon isotope composition after 4 years of planting Eucalyptus. This fact is evidenced in
this study by δ13C values that, in the surface layer of
E1, tended to decrease (-22.59‰) and the consequent start of carbon conversion in the area and the rest of
the profile remained at values that do not differ from
those f reported in pasture area.
The value of natural isotopic abundance between E3 and NR showed no difference, except
for the surface layer, which confirms that the profile
of both has already suffered interference from the planting of tree crops with an entire C3 cycle.These areas compared showed that management differences are likely to interfere with the conversion of C between pasture and arboreal crops, contributing to carbon maintenance. The areas evaluated in this study had some characteristics that may limit the implementation
of other agricultural crops that required better physical and chemical soil properties, such as low fertility, wide variation in slope and high sand content in some
profiles. However, assessing the SOM conversion data
we can infer that this type of tree farming can bring
benefits to the soil such as the maintenance of carbon
content and soil protection of steeper slopes, reducing erosions occurrence of erosions.
CONCLUSION
The 13C isotopic abundance indicates that eucalyptus
stands contributed to higher SOM-up values in the first 20cm layer,
after 10 years of cultivation, and it also has an effect throughout
the total soil profile after 21 years of cultivation, similarly to what
happened in natural regeneration areas with tree species.
ACKNOWLEDGMENTS
The authors acknowledge Prof Galileo Buriol for the transfer and help in collecting the samples, and Fundação de Amparo á Pesquisa do Estado do Rio Grande do Sul (FAPERGS) and
Conselho Nacional de Desenvolvimento Científico e Tecnológico
(CNPq) for scholarships and research fellowship.
REFERENCES
BALESDENT, J et al. Relationship of soil organic matter dynamics to physical protection and tillage. Soil and Tillage Research, v.53, p.230, 2000. Available from: <http://www.sciencedirect.com/ science/article/pii/S0167198799001075>. Accessed: jun. 10, 2015. doi: 10.1016/S0167-1987(99)00107-5.
BALIEIRO, F. C. et al. Soil carbon and nitrogen in pasture soil reforested with eucalyptus and guachape. Revista Brasileira de Ciência do Solo, v.32, 1260p, 2008. Available from: <http://www. scielo.br/pdf/rbcs/v32n3/a33v32n3.pdf>. Accessed: jun. 05, 2015. doi: 10.1590/S0100-06832008000300033.
BOUTTON, T. W. 13C/12C fractionation and its utility in terrestrial plant studies. In: COLEMAN, D. C.; FRY, B. Carbon isotope techniques. San Diego: Academic, p.200, 1991.
BOUTTON, T. W. Stable carbon isotopes ratios of natural materials. In: COLEMAN, D.C.; FRY, B. (Eds.). Carbon isotopes techniques. New York: Academic, p.200, 1991.
BURIOL, G. A. et al. Monthly and yearly charts of average temperatures, the maximum average temperatures and average minimum temperature of the Rio Grande do Sul state. Revista do Centro de Ciências Rurais, v.9, supl, p.1-53, 1979.
CASTRO FILHO, C. et al. Tillage methods and soil and water conservation in southern Brazil. Soil Tillage, v.20, p.283, 1991. Available from: <http://www.sciencedirect.com/science/ article/pii/016719879190043W>. Accessed: jun. 03, 2015. doi: 10.1016/0167-1987(91)90043-W.
abstract&tlng=pt>.Accessed: jun. 03, 2015. doi: 10.1590/S0100-06832009000500007.
COUTINHO, R. P. et al. Estoque de carbono e nitrogênio e emissão de N2O em diferentes usos do solo na Mata Atlântica. Pesquisa Agropecuá-ria Brasileira, v.45, n.2, p.203, 2010.Available from: <http://www.scie-lo.br/scielo.php?script=sci_arttext&pid=S0100-204X2010000200011>. Accessed: jun. 03, 2015. doi: 10.1590/S0100-204X2010000200011.
EKDAL, C. A.; KEELING, C. D. Atmospheric carbon dioxide and radiocarbon in the natural carbon cycle I: Quantitative deductions from records at Mauna Loa Observatory and at the South Pole. In: WOODWELL, G.M; PECAN, E.V. (Eds.). CO2 production from fossil fuel combustion and kilning of limestone. New York: Brookhaven National Lab. Carbon and the biosphere. Carbon and the Biosphere conference Upton, p.85, 1973.
GOLCHIN, A. et al. Structural and dynamic properties of soil
organic matter as reflected by13C natural abundance, pyrolysis mass
spectrometry and solid-state 13C NMR spectroscopy in density
fractions of Oxisol under forest and pasture. Journal Soil Research, v.33, 76p, 1995. Available from: <http://www.publish.csiro.au/sr/ SR9950059>. Accessed: jun. 03, 2015. doi: 10.1071/SR9950059.
LEITE, F. P. et al. Alterations of soil chemical properties by
eucalyptus cultivation in five regions in the Rio Doce Valley.
Revista Brasileira de Ciência do Solo, v.34, p.831, 2010. Available from: <www.scielo.br/scielo.php?script=sci_arttext& pid=S0100-06832010000300024>. Accessed: jun. 03, 2015. doi: 10.1590/S0100-06832010000300024.
LIMA, A. M. N. et al. Soil organic carbon dynamics following afforestation of degraded pastures with eucalyptus in Southeastern Brazil. Forest Ecology and Management, v.235, p.231, 2006. Available from: <http://www.sciencedirect.com/science/article/pii/ S0378112706008449>. Accessed: jun. 03, 2015. doi: 10.1016/j. foreco.2006.08.331.
MARTINELLI, L. A. et al. Desvendando questões ambientais com isótopos estáveis. São Paulo: Oficina de Textos, 2009. p.144.
NILSSON, S.; SCHOPFHAUSER, W. The carbon-sequestration potential of a global afforestation program. Climate Change, v.30, n.3, p.293, 1995. Available from: <http://link.springer.com/ article/10.1007/BF01091928>. Accessed: mai. 06, 2015. doi: 10.1007/ BF01091928.
PEGORARO, R. F. et al. Estoques de carbono e nitrogênio nas frações da matéria orgânica em Argissolo sob eucalipto e pastagem.
Ciência Florestal, v.21, n.2, p.354, 2011. Available from: <https://
periodicos.ufsm.br/cienciaflorestal/article/view/3230>. Accessed: mai. 06, 2015. doi: 10.5902/198050983230.
PULROLNIK, K. et al. Estoques de carbono e N em frações lábeis e estáveis da matéria orgânica de solos sob eucalipto, pastagem e cer-rado no Vale do Jequitinhonha - MG. Revista Brasileira de Ciência do Solo, v.33, p.1136, 2009. Available from: <http://www.scielo.br/
scielo.php?script=sci_arttext&pid=S0100-06832009000500006>. Accessed: mai. 06, 2015. doi: 10.1590/S0100-06832009000500006.
SÁ, J. C. M. et al. Organic matter dynamics and carbon sequestration rates for a tillage chronosequence in a Brazilian Oxisol. Soil Science Society of America Journal, v.65, p.1499, 2001. Available from: <https://dl.sciencesocieties.org/publications/ sssaj/abstracts/65/5/1486?access=0&view=pdf>. Accessed: mai. 06, 2015. doi: 10.2136/sssaj2001.6551486x.
SILVA, V. E. et al. Composição lignocelulósica e isótopica da vegetação e da matéria orgânica do solo de uma turfeira tropical:
I - composição florística, fitomassa e acúmulo de carbono.
Revista Brasileira Ciência Solo, v.37, n.1, 133p, 2013. Available from: <http://www.scielo.br/scielo.php?script=sci_arttext&pid =S0100-06832013000100013>. Accessed: mai. 06, 2015. doi: 10.1590/S0100-06832013000100013.
SISTI, C. P. J. et al. Change in carbon and nitrogen stocks in soil under 13 years of conventional or zero tillage in southern Brazil. Soil Tillage Research, v.76, p.58, 2004. Available from: <http://www. sciencedirect.com/science/article/pii/S016719870300196X>. Accessed: mai. 06, 2015. doi: 10.1016/j.still.2003.08.007.
SMITH, B. N.; EPSTEIN, S. Two categories of 13C/12C ratios for
higher plants. Plant Physiology, v.47, 384p, 1971. Available from: <http://www.plantphysiol.org/content/47/3/380>. Accessed: mai. 06, 2015. doi: 10.1104/pp.47.3.380.
SPECHT, A.; WEST, P. W. Estimation of biomass and sequestered carbon on farm forest plantations in northern New South Wales, Australia. Biomass & Bioenergy, v.25, n.4, 379p, 2003. Available from: <http://www.sciencedirect.com/science/article/ pii/S0961953403000503>. Accessed: mai. 07, 2015. doi: 10.1016/ S0961-9534(03)00050-3.
STEVENSON, F. J.; COLE, M. Cycles of soil: carbon, nitrogen, phosphorus, sulfur, micronutrients. New York: JohnWiley, 1999. p.427.
SUESS, H. E. Radiation concentration in modern wood. Science, v.122, n.3166, p.417, 1955.
VIANA, M. B. O eucalipto e os efeitos ambientais do seu plantio em escala. Brasília: Biblioteca Digital da Câmara dos Deputados, p.29, 2004.
WORLD REFERENCE BASE FOR SOIL RESOURCES. (WRB).
A framework for international classification, correlation and
communication. Food and Agriculture Organization of the United Nations. Rome: IUSS/ISRIC/FAO, 2006. p.145. (World Soil Resources Reports, 103).