Correspondence:
Pamela J Surkan
Dept. of International Health Johns Hopkins Bloomberg School of Public Health
615 North Wolfe St., Room E5523 Baltimore, MD 21205-2179 E-mail: psurkan@jhu.edu
Received: Jul 26, 2016
Approved: May 8, 2017
How to cite: Surkan PJ, Sakyi KS, Hu A,Olinto MT, Gonçalves H, Horta BL, et al. Impact of stressful life events on central adiposity in the Pelotas Birth Cohort. Rev Saude Publica. 2018;52:61.
Copyright: Este é um artigo de acesso aberto distribuído sob os termos da Licença de Atribuição Creative Commons, que permite uso irrestrito, distribuição e reprodução em qualquer meio, desde que o autor e a fonte originais sejam creditados.
http://www.rsp.fsp.usp.br/
Impact of stressful life events on central
adiposity in the Pelotas Birth Cohort
Pamela J SurkanI, Kwame S SakyiI,II, Alice HuI,Maria T OlintoIII,IV, Helen GonçalvesV, Bernardo L HortaV, Denise P GiganteV
I Johns Hopkins School of Public Health. Department of International Health. Social and Behavioral Interventions Program. Baltimore, Maryland, USA
II Oakland University. School of Health Sciences. Department of Public and Environmental Wellness. Rochester, Michigan, USA
III Universidade do Vale do Rio dos Sinos. Programa de Pós-Graduação em Saúde Coletiva. São Leopoldo, RS, Brasil IV Federal University of Health Science of Porto Alegre. Department of Nutrition. Porto Alegre, RS, Brasil V Universidade Federal de Pelotas. Programa de Pós-Graduação em Epidemiologia. Pelotas, RS, Brasil
ABSTRACT
OBJECTIVE: To investigate how stressful life events and social support relate to central adiposity in Southern Brazil.
METHODS: Data included information from 802 participants in the 1982 Pelotas Birth Cohort that was collect in 2004–2005 and 2006. Stratifying by sex, we studied self-reported stressful life events during the year before 2004–2005 in relation to change in waist circumference between 2004–2005 and 2006 and waist-to-hip ratio in 2006, using both bivariate and multivariate linear regression models.
RESULTS: In adjusted models, the experience of stressful life events during the year before 2004–2005 predicted a change in waist circumference in 2006 in men and a change in both waist-to-hip ratio in 2006 and waist circumference between 2004–2005 and 2006 in women. Men who experienced two or more stressful events had on average a one centimeter increase in their waist circumference between 2004–2005 and 2006 (β = 0.97, 95%CI 0.02–1.92), compared to those reporting no stressful events. For women, those who had one and those who had two or more stressful life events had over a 1 cm increase in their waist circumference from 2004–2005 to 2006 (β = 1.37, 95%CI 0.17–2.54; β = 1.26, 95%CI 0.11–2.40, respectively), compared to those who did not experience any stressful event. For both sexes, social support level was not significantly related to either waist-to-hip ratio or change in waist circumference, and it did not modify the association between stress and central adiposity.
CONCLUSIONS: The experience of more than one stressful life event was associated with distinct indicators of central adiposity for men versus women.
INTRODUCTION
Central adiposity, otherwise known as abdominal obesity, is a risk factor for coronary heart disease, stroke, and diabetes, and is characterized by the distribution of visceral fat in the abdominal area1,2. A variety of complex mechanisms and hypotheses have been postulated (e.g., the portal hypothesis) regarding pathways through which visceral fat can lead to insulin resistance3. Body mass index (BMI) is a poor predictor of cardiovascular disease compared to measures of central adiposity, such as waist-to-hip ratio (WHR) and waist circumference (WC)4. Interestingly, however, a very high correlation has been observed between WC and BMI among Brazilians5.
Epidemiological studies have shown a relation between social class and central adiposity6, with work-related or other stressors implicated in its development6–8; specifically, stress activates the hypothalamic-pituitary-adrenal axis and sympathetic nervous system, which leads to hormonal abnormalities including increased cortisol secretion and development of visceral fat9. Chronic stress may play a role in the development of fat from another pathway,
from its influence on dietary intake, including the consumption of energy-dense foods8,10,11. Psychosocial stress derived from the social environment, e.g., loss of a family member or
financial difficulties, is thought to have a cumulative effect on physical and mental health12. Although a relationship between stress and central adiposity has been observed, the types of psychosocial stressors that may be important and the role of social support systems across
different cultures have not been elucidated. According to the stress-buffering hypothesis, social support may be protective against the adverse effects of stress13. We hypothesized that stressful events would be positively associated with central adiposity, while social support would be inversely associated with it. Additionally, we hypothesized that high levels of
social support may serve as a buffer for the relationship between stressful events and central adiposity. The main aims of our study were to investigate how stressful life events and how social support relate to central adiposity, using a cohort study from Southern Brazil. The secondary aim was to assess whether social support buffered the impact of stress on central adiposity by examining the effect modification by social support.
METHODS
This study was based on the follow-up data from the Pelotas Birth Cohort carried out in Southern Brazil from October 2004 to August 2005 and from January to April 2006. The study
population consisted of 802 adults (416 men and 386 women) for whom follow-up data on WC was available. All pregnant women were excluded from this study.
Study Procedures
The study began in 1982 and has continued to follow 5,914 live births in the three maternities
from Pelotas, representing 99.2% of all births whose families lived in the urban area of the city14,15. A range of information including demographic, socioeconomic, and anthropometric data were collected, as well as data on health-related variables15. In the 2004–2005 visit,
trained field workers interviewed 4,297 participants, representing a follow-up rate of 77.4%
when added to the 282 individuals known to have died. Weight circumference was assessed in a subsample of 856 participants16, corresponding to a random sample of census tracks in the city. Our 2006 follow-up consisted of 802 adults, a subset of the 856 individuals with information on WC. Details about data quality control with scale calibration, standardization sessions, and double data entry have been reported previously15.
Measures
central adiposity, was measured in centimeters at the narrowest part of the trunk, right above the navel at both time points17,18. Quality control was checked by a supervisor repeating 10% of the measurements, showing over 95% repeatability.
Our main independent variable included six questions to assess exposure to stressful life events within the last year before the interview in 2004–2005 asking whether the respondent: 1) had some type of health problem that did not allow for normal activities, 2) experienced the death of a close family member, 3) had a serious relationship end (with a partner or
divorce), 4) faced financial difficulties that were more serious than usual, 5) had to move out
of the house against his/her will, 6) had nervous and emotional problems. Items representing stressful events were selected by a team led by a Brazilian anthropologist (co-author HG) adapted from other existing scales19–22 and were deemed culturally relevant stressors in the local setting of Southern Brazil. Each event was given one point. Stress score was categorized as none (score = 0), low (1-2), or high (> 2).
Social support (high versus low or none) was measured by two questions assessing the
presence of material (i.e., monetary) and emotional support from family and friends, respectively. We considered the lack of either or both types of support as low or no social
support. Other variables considered were: education (≤ 8, > 8 years), parity (no children, ≥ 1 child), race (white, non-white), household income tertile (low, medium, high), alcohol intake (≤ 2, > 2 drinks per week), smoking status (never, former, current), and BMI in 2004,
calculated with standard units of kg/m2 and categorized using the WHO cut-off value for overweight: < 25 versus ≥ 2523.
Statistical Analysis
All statistical analyses were stratified by sex, as abdominal fat patterns differ between men and
women9. One-way ANOVA was used to test sex differences for continuous variables (WC and
WHR), chi-square tests were used to assess sex differences in categorical variables, and t-tests of proportions were used to evaluate sex differences by stress score. Quantile-quantile plots and Shapiro-Wilk test were used to check for a normal distribution of the difference in WC.
Leverage-versus-residual squared plots and box plots were fit to identify points with higher
than average leverage or residuals. Observations with high leverage or residuals were dropped. A total of 16 observations (14 for men and 2 for women) were excluded from the analysis.
In the bivariate analyses, beta coefficients and 95% confidence intervals were calculated for each of the predictors in relation to WHR in 2006, change in WC between 2004–2005 and 2006, and covariates measured in 2004–2005. Multiple regression analyses were also performed using WHR and change in WC as outcomes and the social support (high versus
low or none) and stressful life events categories (none, one, or two or more) as independent variables, while stratified by sex. Covariate selection was based on factors important for central adiposity based on the current literature (household income, education, alcohol intake, smoking status, race, and parity) or on factors that had p-value < 0.20 in the bivariate analyses. We also controlled for 2004 BMI in all analyses with change in WC as outcome. For linear regression models, the normality assumption (of residuals) was checked using quantile-quantile plots. We created an interaction term between stressful life events and social support and performed the Wald test to determine if the relation between stressful life events and central adiposity was modified by social support for either sex (p < 0.05).
Data were analyzed using Stata statistical software version 11.0(StataCorp, 2009, Version 11, College Station, Texas, USA).
Ethics
RESULTS
Descriptive Characteristics of Study Population and Stressful Events in Men and Women
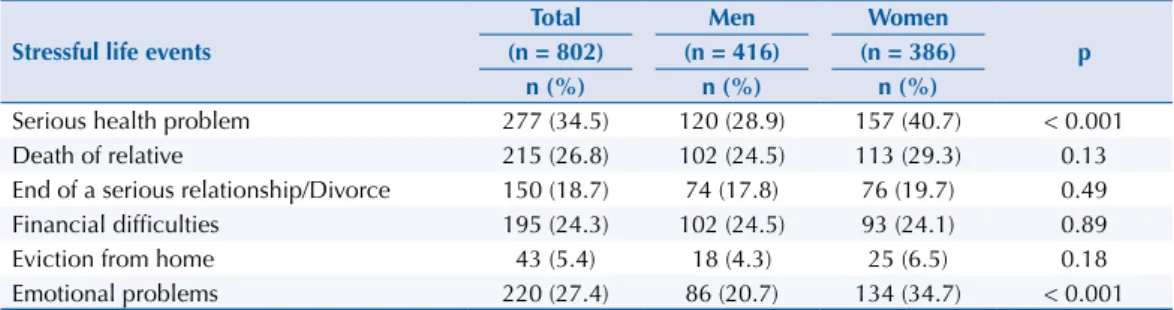
In terms of stressful life events, women reported both more serious health problems (41% women; 29% men) and more emotional problems (35% women; 21% men) within the last year.
Other individual stressful life event items were not significantly different when comparing sexes (Table 1). This is consistent with the fact that, when the scale was used as a whole,
women were also more likely to report having experienced two or more stressful life events in the last year (47%) compared to men (36%) (Table 2).
Table 2. Descriptive characteristics of adults born in 1982, stratified by sex.
Categorical variables
Total Males Females
p (n = 802) (n = 416) (n = 386)
n (%) n (%) n (%)
Stressful life events 0.002
None (0) 216 (26.9) 129 (31.0) 87 (22.5)
One (1) 257 (32.0) 139 (33.4) 118 (30.6)
Two or more (≥ 2) 329 (41.0) 148 (35.6) 181 (46.9)
Social support 0.20
High 625 (78.0) 317 (76.2) 308 (80.0)
Low or none 176 (22.0) 99 (23.8) 77 (20.0)
Education (years) < 0.001
≤ 8 230 (28.7) 143 (34.4) 87 (22.5)
> 8 572 (71.3) 273 (65.6) 299 (77.5)
Parity < 0.001
No children 561 (70.0) 241 (62.4) 320 (76.9)
≥ 1 241 (30.1) 145 (37.6) 96 (23.1)
Race 0.16
White 626 (78.3) 322 (77.8) 314 (79.0)
Non-white* 173 (21.6) 92(22.2) 81 (21.0)
Household income (tertiles) 0.34
Low 254 (33.5) 124 (31.2) 130 (35.9)
Medium 257 (33.9) 142 (35.8) 115 (31.8)
High 248 (32.7) 117 (32.3) 131 (33.0)
Alcohol intake (per week) < 0.001
≤ 2 drinks 538 (67.1) 238 (57.2) 300 (77.7)
> 2 drinks 264 (32.9) 178 (42.8) 86 (22.3)
Smoking status 0.47
Never 556 (69.3) 281 (67.5) 275 (71.2)
Former 63 (7.9) 33 (7.9) 30 (7.8)
Current 183 (22.8) 102 (24.5) 81 (21.0)
BMI in 2004 0.13
< 25 570 (71.1) 286 (73.6) 284(68.7)
≥ 25 232 (28.9) 102 (31.2) 130 (26.4)
Continuous variables Mean (SD) Mean (SD) Mean (SD) p
Waist–hip ratio 0.80 (0.07) 0.84 (0.05) 0.75 (0.05) < 0.001
Change in waist circumference
between 2004 and 2006 (cm) 0.44 (0.18) 1.29 (0.25) -0.48 (0.25) < 0.001 BMI: body mass index
* Almost all individuals in this category were black or mixed race, with the exception of four who identified as Asian and two who identified as indigenous.
Table 1. Stressful life events assessed in 2004–2005, stratified by sex.
Stressful life events
Total Men Women
p (n = 802) (n = 416) (n = 386)
n (%) n (%) n (%)
Serious health problem 277 (34.5) 120 (28.9) 157 (40.7) < 0.001
Death of relative 215 (26.8) 102 (24.5) 113 (29.3) 0.13
End of a serious relationship/Divorce 150 (18.7) 74 (17.8) 76 (19.7) 0.49
Financial difficulties 195 (24.3) 102 (24.5) 93 (24.1) 0.89
Eviction from home 43 (5.4) 18 (4.3) 25 (6.5) 0.18
Most other variables included in the model also differed between sexes, with more women
having higher educational attainment but being less likely to have at least one child and to have > 2 drinks per week (Table 2). Males on average had an increase in WC (1.29 cm), while females had overall decrease (-0.48 cm) in WC between 2004 and 2006. As expected, males
had on average a higher mean WHR (0.84 cm) compared to women (0.75 cm) (Table 2). There was no difference between men and women in social support, race, household income,
smoking status, or BMI in 2004 (Table 2).
Stressful Events and Measures of Central Adiposity in Men
Crude analyses in males showed only two statistically significant associations with indicators of central adiposity; men who had BMI ≥ 25 in 2004–2005 were more likely to have a higher
WHR in 2006 (β = 0.05, 95%CI 0.04–0.06). Similarly, higher WC in men in 2004–2005 was also associated with a higher WHR in 2006 (β = 0.003, 95%CI 0.002–0.003). Men with more than eight years of education were more likely to have an increase in their WC from 2004–2005 to 2006 (β = 0.98, 95%CI 0.17–1.79) (Table 3).
Table 3. Crude analyses of the demographic information, stressful life events, and social support in relation to measures of central adiposity in adults born in 1982, stratified by sex.
Variables
Men Women
Waist-to-hip ratio in 2006 Change in waist circumference
between 2004–2005 and 2006 Waist-to-hip ratio in 2006
Change in waist circumference between 2004–2005 and 2006
β (95%CI) p β (95%CI) p β (95%CI) p β (95%CI) p
Stressful life events
None Ref Ref Ref Ref
One 0.0008 (-0.01–0.01) 0.88 0.27 (-0.69–1.24) 0.57 0.02 (0.008–0.04) 0.002 0.72 (-0.58–2.03) 0.27
Two or more 0.004 (-0.01–0.01) 0.51 0.93(-0.02–1.88) 0.06 0.01 (0.009–0.03) 0.04 0.75 (-0.44–1.96) 0.21 Social support
High Ref Ref Ref Ref
Low or none 0.002 (-0.009–0.01) 0.74 -0.80 (-1.71–0.10) 0.08 0.01 (0.001–0.03) 0.04 -0.16 (-1.33–1.01) 0.78 Education
≤ 8 years Ref Ref Ref Ref
> 8 years -0.0002 (-0.01–0.01) 0.97 0.98 (0.17–1.79) 0.02 -0.03 (-0.04–-0.02) < 0.001 0.99 (-0.13–2.11) 0.08 Parity
No children Ref Ref Ref Ref
≥ 1 child NA NA NA NA 0.03 (0.02–0.04) < 0.001 -1.15 (-2.11–-0.18) 0.02
Race
White Ref Ref Ref Ref
Non-white -0.002 (-0.01–0.01) 0.71 -0.02 (-1.03-1.00) 0.97 0.02 (0.003–0.029) 0.02 0.32 (-0.87–1.52) 0.60 Household income (tertiles)
Low Ref Ref Ref Ref
Medium 0.003(-0.008–0.01) 0.65 0.31 (-0.64–1.27) 0.52 -0.02 (-0.03–-0.005) 0.005 0.60 (-0.54–1.74) 0.30 High 0.01(-0.001–0.02) 0.08 0.50 (-0.47–1.46) 0.31 -0.04 (-0.05–-0.02) < 0.001 0.89 (-0.25–2.02) 0.13 Alcohol intake (per week)
≤ 2 drinks Ref Ref Ref Ref
> 2 drinks 0.001 (-0.01–0.003) 0.34 0.08 (-0.11–0.28) 0.37 0.006 (-0.007–0.02) 0.35 -0.01 (-1.15–1.11) 0.98 Smoking status
Never Ref Ref Ref Ref
Former -0.005 (-0.02–0.01) 0.57 -0.09 (-1.53–1.41) 0.90 -0.00003 (-0.02–0.02) 0.99 -0.93 (-2.70–0.83) 0.31 Current 0.003 (-0.01–0.01) 0.50 0.11 (-0.66–1.21) 0.81 0.03 (0.01–0.04) < 0.001 -0.46 (-1.70–0.75) 0.44 BMI in 2004
< 25 Ref Ref Ref Ref
≥ 25 0.05 (0.04–0.06) < 0.001 0.42 (-0.42,1.25) 0.33 0.05 (0.04–0.06) < 0.001 -1.06 (-2.12–0.13) 0.08 Waist circumference
in 2004 (cm) 0.003 (0.003–0.004) < 0.001 - - 0.003 (0.002–0.003) < 0.001 -
-Ref: reference; BMI: body mass index; NA: Not applicable
For females, the sample size is 384 for all variables, except for race and social support, which had one missing value each. For men, sample size is 406 for all variables, except for race (n = 388), which had 18 missing values.
For men, in the multivariable models adjusted for education, household income, alcohol intake, smoking status, BMI in 2004, and WC in 2004, we found a positive relation between having at least two stressful life events and increased WC between 2004–2005 and 2006 (β = 0.97, 95%CI 0.02–1.92). This association between stressful life events and change in WC in men was not modified by social support for men (Wald test, p = 0.77).
Stressful Events and Measures of Central Adiposity in Women
For women, almost all factors were associated with WHR in 2006 in our crude analysis. Compared to women reporting no stressful life events in the last year, those reporting one (β = 0.02, 95%CI 0.008–0.04) or more than one (β = 0.01, 95%CI 0.009–0.03) had a significantly
higher WHR in 2006. Low or no social support was associated with 0.01 cm increase in WC between 2004–2005 and 2006 (β = 0.01, 95%CI 0.001–0.03). In addition, having one or more children (β = 0.03, 95%CI 0.02–0.04), being a current smoker (β = 0.03, 95%CI 0.01–0.04), being non-white (β = 0.02, 95%CI 0.02–0.04), being overweight or obese in 2004 (β = 0.05, 95%CI 0.04–0.06), and having a higher WC in 2004–2005 (β = 0.003, 95%CI 0.002–0.003) were positively associated with WHR in 2006. On the other hand, compared to women with eight years of education or less, women with > 8 years of education in 2004–2005 had lower WHR in 2006 (β = -0.03, 95%CI -0.04– -0.02). Similarly, compared to those with the lowest income level, women from medium and high income level households had lower WHR in 2006 (β = -0.02, 95%CI -0.03– -0.005; β = -0.04, 95%CI -0.05– -0.02, respectively). Among the exposures and covariates assessed, only parity, i.e., having ever had at least one child, was associated with reduced WC (β = -1.15, 95%CI -2.11– -0.18) (Table 3).
In the multivariable models adjusted for the same covariates (education, race, household income, alcohol intake, smoking status, BMI in 2004–2005) in addition to parity in the
analysis for women, we found a statistically significant positive association between having
one stressful life event and WHR in 2006 (β = 0.02, 95%CI 0.003–0.03) (Table 4). Moreover, compared to women who reported no stressful life events in the past year, women who had one or more than one stressful life events had an increase in WC between 2004 and 2006 that were, on average, 1.37 cm or 1.26 cm greater, respectively, after holding the other covariates constant (one stressful life event: β = 1.37, 95%CI 0.17–2.54; two or more stressful life events:
β = 1.26, 95%CI 0.11–2.40). No adjusted models assessing the association between social
support and our indicators of central adiposity were significant for men or women (Table 4).
Social support did not modify the relation between stressful life events and change in WC (2004–2006) (Wald test, p = 0.28) or WHR (Wald test, p = 0.63) in women.
Table 4. Adjusted analyses of stressful life events and social support variables in relation to measures of central adiposity in adults born in 1982, stratified by sex.
Variable
Men (n = 406) Women (n = 377)
Waist-to-hip ratio in 2006 Change in waist circumference
between 2004–2005 and 2006 Waist-to-hip ratio in 2006
Change in waist circumference between 2004–2005 and 2006
β (95%CI) p β (95%CI) p β (95%CI) p β (95%CI) p
Adjusted models with stress Stressful life events
None Ref Ref Ref Ref
One -0.001 (-0.01–0.008) 0.81 0.21 (-0.75–1.17) 0.66 0.02 (0.003–0.03) 0.01 1.37 (0.17–2.54) 0.02
Two or more 0.003 (-0.006–0.013) 0.48 0.97 (0.02–1.92) 0.045 0.01 (-0.002–0.02) 0.10 1.26 (0.11–2.40) 0.03
Adjusted models with social support Social support
High Ref Ref Ref Ref
Low or none -0.0004 (-0.01–0.01) 0.92 -0.64 (-1.55–0.28) 0.17 0.002 (-0.01–0.01) 0.29 0.36 (-0.76–1.49) 0.64 Models for waist-to-hip ratio are adjusted for education (> 8 versus≤ 8 years), household income (tertiles), number of alcoholic drinks per week (> 2 versus≤ 2), smoking status (never, former, current), and BMI in 2004 (< 25 versus≥ 25). Models for change in waist circumference are adjusted for these variables, as well as waist circumference in 2004. Analyses for women were also adjusted for parity (no children versus≥ 1 child) and race (white versus non-white).
Note: The models with stressful life events were not adjusted for the social support variable and the models with social support were not adjusted for stressful life events.
DISCUSSION
We found that women reported a higher proportion of stressful life events than men, which appeared to be primarily due to the relative likelihood of more serious health and emotional problems. We also found that stressful life events were more related to measures of central adiposity in women than in men. Women who reported one stressful life event in 2004–2005
were significantly more likely to have higher WHR in 2006 and also experience an increase in
change in WC over a one- to two-year period, compared to women reporting no stressful life events. Compared to the same group, those who reported two or more stressful life events
had a statistically significant increase in WC from 2005 to 2006. In men, the experience of
stressful life events resulted in an increase in WC but not in WHR, with those experiencing two or more stressful life events before 2004–2005 having approximately one centimeter increase in WC between 2004–2005 and 2006. While social support was associated with WHR in women, after adjustment for covariates, there was no clear relation between social support and WHR. In adjusted models, social support was not associated with either indicator of central adiposity in men or women.
Our study showed modest positive associations between increased stressful life events and change in WC in both men and women. Another study has found central fat distribution to
mediate the association between stress eating in non-diabetics (defined as eating more or
one’s favorite foods because of stress) and measures of glucoregulation (e.g., glucose, insulin, insulin resistance)24. A British study that examined life events as predictors of WC has found illness (referring to disability in oneself or a child) to be related to increased WC25. Another stressor, interpersonal discrimination, has also been associated with increases in WC over a period of nine years in a US population, which was more pronounced in men than women26. A recent study from Britain has found the negative aspects of a close relationship to be related to increases in WC over a similar time period27. Nonetheless, other research found
no evidence of significant associations between self-perceived stress, perceived life stress,
and cortisol with WC28,29.
In terms of WHR, we found a positive significant association only in women and not men. Similar to our findings, higher perceived stress among a US sample of diabetic adults was
found to be associated with WHR in women, but not men30. Two studies have shown null associations. In Finnish men, no relation was found between negative life changes (e.g., loss of
job or increased conflicts with a spouse) and WHR31. Similarly, there were no significant changes in the association between life events and WHR among Dutch young adults of either sex32.
We found no relation between social support and WC or WHR in either women or men.
Regarding the literature on social support and central adiposity, findings are mixed with
some studies showing associations33–35, others reporting null findings28,36, or only associations among males30,37. In a small sample of women (n = 41), unadjusted comparisons suggested that women with normal WC had higher levels of social support than women with high WC33. These findings have been reinforced by larger studies indicating that the lower levels of perceived support in women were associated with WC and WHR after adjustment for BMI34,38. A study with adolescents has shown that those with less supportive relationships had increased WHR over a three-year period, adjusting for baseline WHR35. One of the few
other studies in Latin America, with Bolivian women, has reported non-significant relations
between instrumental social support and central adiposity, measured by the subscapular to triceps skinfold ratio36.
The strengths of our study include longitudinal follow-up of a relatively large cohort of
adapted from standard items of other validated instruments19–22, our scale had not been validated in Brazil. Given the Brazilian cultural context, it is possible that other types of life events not available in our data set may be more relevant to central adiposity.
Our study showed varied, modest associations between increased stressful life events and WC and WHR. Mechanisms that have been proposed include alterations caused by changes in the functioning of the hypothalamic-pituitary-adrenal axis9 and higher dietary intake of foods high in fat and sugar as a response to stress10. Given the inconsistencies in the literature to date28,30,33–37, further research is needed to confirm these findings and to examine how stressful events relate to change in WHR. We could not address this issue of change over time in this study because data were not available on WHR in 2004. Moreover, in future studies, it would be interesting to explore changes in WC adjusted for changes in BMI, i.e., to evaluate change in the degree of centrality. We could not assess this because we did not have measures on BMI in 2006. Furthermore, as a more precise measure than BMI in 2004, we would have liked to have been able to adjust for change in BMI between 2004 and 2006, given that variation in WC could have occurred because of a change in BMI
that is not necessarily attributable to central adiposity. Future studies would benefit from
including a wider range and a more extensive list of stressful events, which could be studied both individually and cumulatively.
REFERENCES
1. Després JP. Health consequences of visceral obesity. Ann Med. 2001;33(8):534-41. https://doi.org/10.3109/07853890108995963
2. Suk SH, Sacco RL, Boden-Albala B, Cheun JF, Pittman JG, Elkind MS, et al. Abdominal obesity and risk of ischemic stroke: the Northern Manhattan Stroke Study. Stroke. 2003;34(7):1586-92. https://doi.org/10.1161/01.STR.0000075294.98582.2F
3. Lee DE, Kehlenbrink S, Lee H, Hawkins M, Yudkin JS. Getting the message across: mechanisms of physiological cross talk by adipose tissue. Am J Physiol Endocrinol Metab. 2009;296(6):E1210-29. https://doi.org/10.1152/ajpendo.00015.2009
4. Schneider HJ, Friedrich N, Klotsche J, Pieper L, Nauck M, John U, et al. The predictive value of different measures of obesity for incident cardiovascular events and mortality. J Clin Endocrinol Metab. 2010;95(4):1777-85. https://doi.org/10.1210/jc.2009-1584
5. Faria ER, Franceschini SCC, Peluzio MCG, Sant’Ana LFR, Priore SE. Correlation between metabolic and body composition variables in female adolescents. Arq Bras Cardiol. 2009;93(2):119-27. https://doi.org/10.1590/S0066-782X2009000800009
6. McLaren L. Socioeconomic status and obesity. Epidemiol Rev. 2007;29(1):29-48. https://doi.org/10.1093/epirev/mxm001
7. Björntorp P. Endocrine abnormalities of obesity. Metabolism. 1995;44 Suppl 3:21-3. https://doi.org/10.1016/0026-0495(95)90315-1
8. De Vriendt T, Moreno LA, De Henauw S. Chronic stress and obesity in adolescents: scientific evidence and methodological issues for epidemiological research. Nutr Metab Cardiovasc Dis. 2009;19(7):511-9. https://doi.org/10.1016/j.numecd.2009.02.009
9. Charmandari E, Tsigos C, Chrousos G. Endocrinology of the stress response. Annu Rev Physiol. 2005;67:259-84. https://doi.org/10.1146/annurev.physiol.67.040403.120816
10. Torres SJ, Nowson CA. Relationship between stress, eating behavior, and obesity. Nutrition. 2007;23(11-12):887-94. https://doi.org/10.1016/j.nut.2007.08.008
11. Björntorp P. Do stress reactions cause abdominal obesity and comorbidities? Obes Rev. 2001;2(2):73-86. https://doi.org/10.1046/j.1467-789x.2001.00027.x
12. McEwen BS. Stressed or stressed out: what is the difference? J Psychiatry Neurosci. 2005 [cited 2016 Apr 13];30(5):315-8. Available from: https://jpn.ca/wp-content/uploads/2014/04/30-5-315.pdf
13. Cohen S, Wills TA. Stress, social support, and the buffering hypothesis. Psychol Bull. 1985;98(2):310-57. https://doi.org/10.1037/0033-2909.98.2.310
15. Barros FC, Victora CG, Horta BL, Gigante DP. Methodology of the Pelotas birth cohort study from 1982 to 2004-5, Southern Brazil. Rev Saude Publica. 2008;42 Suppl 2:7-15. https://doi.org/10.1590/S0034-89102008000900003
16. González DA, Nazmi A, Yudkin JS, Victora CG. Life-course socio-economic factors, skin colour and abdominal obesity in adulthood in a Brazilian birth cohort. Public Health Nutr. 2009;12(11):2225-35. https://doi.org/10.1017/S1368980009990607
17. Ross R, Berentzen T, Bradshaw AJ, Janssen I, Kahn HS, Katzmarzyk PT, et al. Does the relationship between waist circumference, morbidity and mortality depend on measurement protocol for waist circumference? Obes Rev. 2008;9(4):312-25. https://doi.org/10.1111/j.1467-789X.2007.00411.x
18. World Health Organization. Waist circumference and waist-hip ratio: report of a WHO Expert Consultation. Geneva: WHO; 2008 [cited 2016 Apr 13]. Available from: http://apps.who.int/iris/ bitstream/10665/44583/1/9789241501491_eng.pdf
19. Cristofaro SL, Cleary SD, Wan CR, Broussard B, Chapman C, Haggard PJ, et al. Measuring trauma and stressful events in childhood and adolescence among patients with first-episode psychosis: initial factor structure, reliability, and validity of the Trauma Experiences Checklist. Psychiatry Res. 2013;210(2):618-25. https://doi.org/10.1016/j.psychres.2013.06.015
20. Fliege H, Rose M, Arck P, Walter OB, Kocalevent RD, Weber C, et al. The Perceived Stress Questionnaire (PSQ) reconsidered: validation and reference values from different clinical and healthy adult samples. Psychosom Med. 2005;67(1):78-88. https://doi.org/10.1097/01.psy.0000151491.80178.78
21. Holmes TH, Rahe RH. The social readjustment rating scale. J Psychosom Res. 1967;11(2):213-8. https://doi.org/10.1016/0022-3999(67)90010-4
22. Paykel ES, Prusoff BA, Uhlenhuth EH. Scaling of life events. Arch Gen Psychiatry. 1971;25(4):340-7. https://doi.org/10.1001/archpsyc.1971.01750160052010
23. Onis M, Onyango AW, Borghi E, Siyam A, Nishida C, Siekmann J. Development of a WHO growth reference for school-aged children and adolescents. Bull World Health Organ. 2007;85(9):660-7. https://doi.org/10.2471/BLT.07.043497
24. Tsenkova V, Boylan JM, Ryff C. Stress eating and health. Findings from MIDUS, a national study of US adults. Appetite. 2013;69:151-5. https://doi.org/10.1016/j.appet.2013.05.020
25. Stewart-Knox B, Duffy ME, Bunting B, Parr H, Almeida MDV, Gibney M. Associations between obesity (BMI and waist circumference) and socio-demographic factors, physical activity, dietary habits, life events, resilience, mood, perceived stress and hopelessness in healthy older Europeans. BMC Public Health. 2012;12:424. https://doi.org/10.1186/1471-2458-12-424
26. Hunte HE. Association between perceived interpersonal everyday discrimination and waist circumference over a 9-year period in the Midlife Development in the United States cohort study. Am J Epidemiol. 2011;173(11):1232-9. https://doi.org/10.1093/aje/kwq463
27. Kouvonen A, Stafford M, De Vogli R, Shipley MJ, Marmot MG, Cox T, et al. Negative aspects of close relationships as a predictor of increased body mass index and waist circumference: the Whitehall II study. Am J Public Health. 2011;101(8):1474-80. https://doi.org/10.2105/AJPH.2010.300115
28. Baltrus PT, Shim RS, Ye J, Watson L, Davis SK. Socioeconomic position, stress, and cortisol in relation to waist circumference in African American and white women. Ethn Dis. 2010;20(4):376-82.
29. Bove M, Carnevali L, Cicero AF, Grandi E, Gaddoni M, Noera G, et al. Psychosocial factors and metabolic parameters: is there any association in elderly people? The Massa Lombarda Project. Aging Ment Health. 2010;14(7):801-6. https://doi.org/10.1080/13607861003713299
30. Lloyd CE, Wing RR, Orchard TJ. Waist to hip ratio and psychosocial factors in adults with insulin-dependent diabetes mellitus: the Pittsburgh Epidemiology of Diabetes Complications study. Metabolism. 1996;45(2):268-72. https://doi.org/10.1016/S0026-0495(96)90065-7
31. Helminen A, Rankinen T, Halonen P, Vaisanen S, Rauramaa R. Positive and negative life changes and LDL cholesterol. J Biosoc Sci. 1999;31(2):269-77.
33. Robins JL, McCain NL, Elswick RK. Exploring the complexity of cardiometabolic risk in women. Biol Res Nurs. 2012;14(2):160-70. https://doi.org/10.1177/1099800411398652
34. Wing RR, Matthews KA, Kuller LH, Meilahn EN, Plantinga P. Waist to hip ratio in middle-aged women. Associations with behavioral and psychosocial factors and with changes in cardiovascular risk factors. Arterioscler Thromb. 1991;11(5):1250-7. https://doi.org/10.1161/01.ATV.11.5.1250
35. Midei AJ, Matthews KA. Social relationships and negative emotional traits are associated with central adiposity and arterial stiffness in healthy adolescents. Health Psychol. 2009;28(3):347-53. https://doi.org/10.1037/a0014214
36. Hicks K. Instrumental social support and women’s body composition in El Alto, Bolivia. Am J Phys Anthropol. 2013;152(1):51-7. https://doi.org/10.1002/ajpa.22327
37. Ravaja N, Keltikangas-Järvinen L, Viikari J. Perceived social support and abdominal fat
distribution in adolescents and young adults: a structural equation analysis of prospective data. Appetite. 1998;31(1):21-35. https://doi.org/10.1006/appe.1997.0149
38. Raikkonen K, Matthews KA, Kuller LH. Anthropometric and psychosocial determinants of visceral obesity in healthy postmenopausal women. Int J Obes Relat Metab Disord. 1999;23(8):775-82. https://doi.org/10.1038/sj.ijo.0800917
39. Center for Substance Abuse Treatment (US). Trauma-informed care in behavioral health services. Rockville (MD): Substance Abuse and Mental Health Services Administration (US); 2014 [cited 2016 Apr 13]. Chapter 3, Understanding the impact of trauma; p.59-90. (Treatment Improvement Protocol (TIP) Series, 57). Available from: https://www.ncbi.nlm.nih.gov/books/ NBK207201/
Funding: This article is based on data from the “1982 Pelotas Birth Cohort” conducted by the Graduate Program in Epidemiology at Universidade Federal de Pelotas with the collaboration of the Brazilian Public Health Association
(ABRASCO). From 2004 to 2013, the Wellcome Trust supported the 1982 birth cohort study. The International Development Research Center, the World Health Organization, the Overseas Development Administration, the European Union, the National Program of Support for Centers of Excellence (PRONEX), the Brazilian National Research Council (CNPq), and the Brazilian Ministry of Health supported previous phases of the study. MTAO, HG, BH and DPG received research productivity grants from CNPq.
Authors’ Contribution: PJS was instrumental in the conceptualization and design of the study, drafted the article, conducted some of the initial data analysis, and was involved in the interpretation of the results. KS and AH conducted most of the data analysis and participated in the writing of the paper. MTO and DPG were involved in the conceptualization and design of the study, interpretation of the results, and editing of the manuscript. BLH and HG participated in the data collection. All authors approved the final version of the article and are responsible for its final content.