Vol. 4, No. 4, 1983
Life Expectancy at Birth in the Americas
In adopting the Plan of Action for the implementa-tion of the regional strategies,' the Member Govern-ments of PAHO defined six minimum goals for achiev-ing health for all by the year 2000. Three of these are aimed at reducing mortality in the countries of the Region, and two refer to mortality in specific age groups: the infant mortality rate and the death rate in children from 1 to 4 years of age. The third, which refers to overall mortality, stipulates that by the year 2000 no country of the Region should have a life expectancy at birth of less than 70 years.
Life expectancy at birth is the average number of years that a newborn can hope to live if age-specific death rates remain constant. It is an indicator of the level of mortality, and at the same time, one of the most widely used indicators for characterizing the level of
See PAHO Official Documents 173 (1981) and 179 (1982).
well-being and, therefore, a country's degree of social development.
There is a large number of indicators of overall mor-tality. The simplest to obtain is the crude death rate, which relates the total deaths occurring in a year with the existing population at the mid-point of that same year. Since the risk of dying is higher at the extreme stages of life, the value of this rate depends heavily on the age distribution of the population and not solely on mortality itself, which detracts from its usefulness for comparative purposes. This drawback is resolved by directly comparing the specific death rates for each one of the different age groups; but the laboriousness of this procedure has motivated the search for methods that make it possible to summarize this information in a single figure. Such is the purpose of age-adjusted rates which, calculated by direct or indirect methods, attempt to eliminate the effect of age distribution by using a standard reference population. However, the death rates adjusted by these methods produce different
IN THIS ISSUE...
* Life Expectancy at Birth in the Americas * Diseases Subject to the International Health
Regulations
· Epidemiological Surveillance of Foodborne Disease in the Caribbean
· Infectious and Chronic Disease Epidemiology: Separate and Unequal?
· National Registry of Tumor Pathology in Brazil * Reports on Meetings and Seminars
results, depending on the age distribution of the
stand-ard population utilized, thus leading to sometimes
dif-ferent and even contradictory conclusions.
One adjustment procedure that does not require a
standard population is based on a statistical model
called the life table, designed for making analyses of
mortality and survival but also used for other
demogra-phic studies on population growth and structure,
fertil-ity, migrations, etc., as well as for making projections
on the size and characteristics of a population. One of
the most common applications of the life table is life
expectancy at birth, which represents the reciprocal of
the "crude" mortality rate of the life table and which
results from summarizing in a single figure the
mortal-ity experience of all the age groups of the population.
The development of the life table and the estimation
of life expectancy do not require the definition of a
standard population, but, like most other adjustment
procedures, they are both based on age-specific death
rates computed with data from vital statistics registries
and population censuses. These data tend to suffer
shortcomings: omission of certain population groups,
especially children under one year of age; errors in the
specification of age, affecting mostly extreme ages;
omissions or delays in the registration of deaths and
births, and others. These deficiencies in the mortality
and population data affect the validity of the life table
and of all the indicators based on it, including life
expectancy at birth. However, demographic analysis
procedures exist which permit the construction of life
tables based solely on census data and on techniques
derived from population theory. These procedures offer
the possibility of making approximate estimates for
those countries that do not have age-specific mortality
data or else, computing estimates that make
it
possible
to correct (at least partially) the information of those
countries whose mortality and population data are not
of the desired quality.
The analyses that follow are based on the values for
life expectancy at birth published by the Population
Division of the United Nations, which have been
pre-pared and projected based on the aforementioned
procedures.
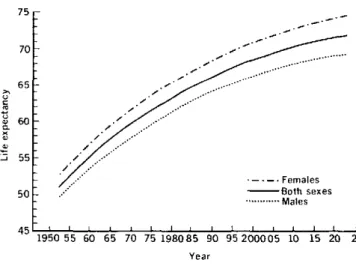
Figures 1 and 2 show estimated and projected life
expectancy at birth for both sexes in the countries of the
Region, from 1950 to 2025. Accordingly, it is expected
that the countries of Latin America and the Caribbean
will reach in the period 2000-2005 the level of life
expec-tancy at birth that the countries of Northern America
had in 1950-1955. However, not until after the year 2010
will they achieve the average figure of 70 years which
the countries of Northern America had reached in
1960).
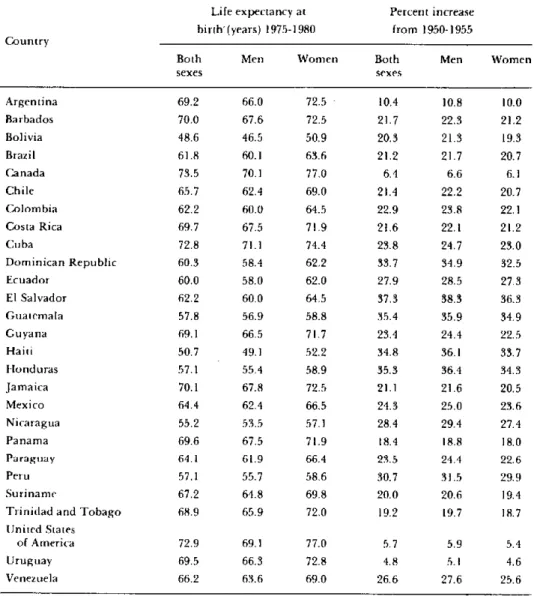
Table 1 shows that these subregional averages mask
large differences among the countries, some of which
Figure 1. Estimated and projected life expectancy at birth, both
sexes, Northern America,* 1950-2025.
80
75 ._.
70...
65-
601-u a
2u 0 a
55
-50
.- -. Females
- Both sexes ... Males
45L lI I I i {`l I I I I 1
1950 55 60 65 70 75 198085 90 95200005 10 15 20 25
Year
Canada and United States of America
Source: World Population Prospects as Assessed in 1980. New York, United Nations. 1981.
Figure 2. Estimated and projected life expectancy at birth, both sexes, Latin America and the Caribbean, 1950-2025.
75
70
65
60
.i 55
50
//
-.--. Females -BBoth sexes
... Males
1950 55 60 65 70 75 198085 90 95200005 10 15 20 25
Year
Source: World Population Prospects as Assessed in 1980 New York. United Nations. 1981.
already had surpassed a life expectancy at birth of 70
years in the period 1975-1980. According to recent
pro-jections of the Population Division of the United
Nations,
2other countries will attain the minimum goal
by the end of the century, but 1 1 countries should make
2 World population Prospects as Assessed in 1980. New York,
United Nations. 1981.
o
4h . . . 1 . 1
Table 1. Life expectancy at birth in the period 1975-1980, by country and sex, and percent increase from the period 1950-1955 in the countries of the Americas.
Life expectancy at Percent increase birth-(years) 1975-1980 from 1950-1955 Country
Both Men Women Both Men Women
sexes sexes
Argentina 69.2 66.0 72.5 - 10.4 10.8 10.0
Barbados 70.0 67.6 72.5 21.7 22.3 21.2
Bolivia 48.6 46.5 50.9 20.3 21.3 19.3
Brazil 61.8 60.1 63.6 21.2 21.7 20.7
Canada 73.5 70.1 77.0 6.4 6.6 6.1
Chile 65.7 62.4 69.0 21.4 22.2 20.7
Colombia 62.2 60.0 64.5 22.9 23.8 22.1
Costa Rica 69.7 67.5 71.9 21.6 22.1 21.2
Cuba 72.8 71.1 74.4 23.8 24.7 23.0
Dominican Republic 60.3 58.4 62.2 33.7 34.9 32.5
Ecuador 60.0 58.0 62.0 27.9 28.5 27.3
El Salvador 62.2 60.0 64.5 37.3 38.3 36.3
Guatemala 57.8 56.9 58.8 35.4 35.9 34.9
Guyana 69.1 66.5 71.7 23.4 24.4 22.5
Haiti 50.7 49.1 52.2 34.8 36.1 33.7
Honduras 57.1 55.4 58.9 35.3 36.4 34.3
Jamaica 70.1 67.8 72.5 21.1 21.6 20.5
Mexico 64.4 62.4 66.5 24.3 25.0 23.6
Nicaragua 55.2 53.5 57.1 28.4 29.4 27.4
Panama 69.6 67.5 71.9 18.4 18.8 18.0
Paraguay 64.1 61.9 66.4 23.5 24.4 22.6
Peru 57.1 55.7 58.6 30.7 31.5 29.9
Suriname 67.2 64.8 69.8 20.0 20.6 19.4
Trinidad and Tobago 68.9 65.9 72.0 19.2 19.7 18.7
United States
of America 72.9 69.1 77.0 5.7 5.9 5.4
Uruguay 69.5 66.3 72.8 4.8 5.1 4.6
Venezuela 66.2 63.6 69.0 26.6 27.6 25.6
Source: World Population Prospects as Assessed in 1980. New York, United Nations, 1981.
special efforts to reduce their mortality levels. On the other hand, these national values are also averages, and do not provide information on the differences among population subgroups within the same country, just as regional averages do not reflect differences among countries.
Life expectancy at birth for women is consistently higher than for men, and this difference appears to be greater in the countries of Northern America where it reaches approximately eight years, almost double the difference observed in Latin American and Caribbean countries (see Figures 1 and 2 and Table 1). Another salient point is that the progressive gain in life expec-tancy at birth slows down as its level increases; to gain
Figure 3. Percent change in life expectancy at birth, Region of the Americas, observed from 1975-1980, relative to values registered
from 1950-1955.
35.0
32.5
30.0
27.5
25.0
22.5
20.0
17.5
15.0
12.5
10.0
7.5
r n q
35 40 45 50 55 60 65 70
Life expectancy at birth (1950-1955)
75 80
Source: World Population Prospects as Assessed in 1980. New York. United Nations., 1981.
rapidly than the expected rate and that others have done so much more slowly, as reflected in the points that lie above and below that line, respectively.
Table 2 shows some selected indicators for 10 coun-tries for which cause-specific mortality data were avail-able: the five with highest life expectancy and the five with the lowest life expectancy for the period 1975-1980. The countries are sequenced according to their life expectancy at birth, from highest to lowest in the first group and from lowest to highest in the second. The second column shows the age-adjusted overall death rates. The comparisons made from them do not coin-cide exactly with those based on life expectancy at birth, since these rates do not follow a strict rising sequence for the countries. of the first group, nor a falling sequence for those of the second. This confirms that different adjustment procedures can lead to different conclusions. The third column shows the infant mor-tality rate and its close relation to life expectancy at birth. Mortality in children under one year of age affects life expectancy at birth more than mortality at any other age. This has led to proposals to use the life expectancy at one year of age in conjunction with infant mortality rate to better describe the countries' social situation, health being one of its main components. The percen-tage of deaths in children under five years of age unders-cores observations made on previous occasions with
Table 2. Selected indicators for the five countries with the highest and lowest life expectancy, around 1978.
Life Age-adjusted Infant Percentage Percentage Percentage Maternal Crude expectancy mortality mortality of deaths of the popu- of the popu- mortality reproduction Country at birth rate per rate per under 5 lation under lation 65 rate per ratea
1,000 popu- 1,000 live years 15 years years and 10,000 live
lation births older births
Canada 73.5 3.8 10.4 3.1 23.2 8.9 0.6 0.91
United States
of America 72.9 4.1 12.1 2.8 22.9 10.7 1.0 0.94
Cuba 72.8 4.3 20.4 7.6 31.3 7.3 4.6 1.06
Barbados 70.0 4.6 25.5 7.4 28.9 6.5 6.9 1.30
Costa Rica 69.7 4.1 25.7 19.8 37.9 3.6 3.8 1.74
Nicaragua 55.2 5.4 84.5 36.5 48.0 2.4 8.5 3.20
Peru 57.1 5.0 81.9 41.1 42.3 3.4 15.3 2.68
Honduras 57.1 5.1 81.5 36.3 47.8 2.7 11.3 3.48
Guatemala 57.8 9.2 67.7 50.7 44.1 2.9 12.1 2.77
Ecuador 60.0 7.4 72.2 42.3 44.4 3.5 21.6 3.07
37.5
alu
m
tp Sl
c.
Source: Pan American Health Organization. Health conditions in the Americas, 1977-1980. Washington, D.C., Scientific Publication 427,
1982.
a World Population Prospects as Assessed in 1980. New York, UJnited Nations, 1981.
.
Table 3. Proportional mortality for the five leading causes of death and for ill-defined symptoms and causes in countries with the highest life expectancy, around 1978.
Ist cause 2nd cause 3rd cause 4th cause 5th cause Total, five ll-defined
Country (%) (%) (%) (%) (%) leading symptoms
causes and causes
(%) (%)
Canada Diseases Malignant Cerebro- Accidents Influenza/
of the heart neoplasms vascular pneumonia
disease
34.5 22.1 9.0 7.1 3.1 75.9 1.4
United States Diseases Malignant Cerebro- Accidenis Influenza/
of America of the heart neoplasms vascular pneumonia
disease
38.1 20.6 9.1 5.7 3.0 76.5 1.6
Cuba Diseases Malignant Cerebro- Accidents Influenza/
of the heart neoplasms vascular pneumonia
disease
29.8 17.5 11.3 9.5 7.9 76.0 0.3
Barbados Diseases Malignant Cerebro- Diabetes Influenza/
of the heart neoplasms vascular mellitus pneumonia disease
22.,1 16.8 14.5 5.5 5.1 64.4 3.4
Costa Rica Diseases Malignant Accidents Causes of
Cerebro-of the heart neoplasms perinatal vascular
mortalilty disease
16.7 16.3 10.6 6.5 6.0 56.0 9.3
Source: Pan American Health Organization. Health Conditions in the Americas, 1977-1980.
1982.
respect to the importance of deaths of the groups under one year and 1-4 years, respectively.5 The following two columns show that, in general, the countries with low life expectancy have a "younger" population than those with high life expectancy. In this connection it should be remembered that the life table procedure practically eliminates the effect of age structure on the level of life expectancy. The two last columns of the table suggest that the great differential observed in favor of women in the countries with high life expectancy could be explained in part by a reduction of the causes of morbidity and mortality associated with a woman's reproductive period.
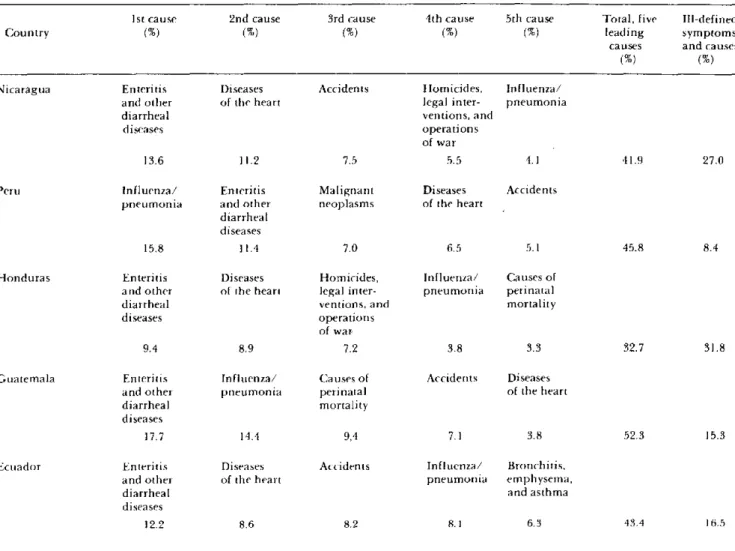
Tables 3 and 4 show proportional mortality due to the five leading causes of death and the proportion of deaths from symptoms and ill-defined conditions in the countries with high and low life expectancy at birth,
' See PAHO Epidemiological Bulletin, Vol. 4, No. 2, 1983.
Washington, D.C., Scientific Publication 427,
Table 4. Proportional mortality for the five leading causes of death and for ill-defined symptoms and causes in countries with the lowest life expectancy, around 1978.
Ist cause 2nd cause 3rd cause 4th cause 5th cause Total, five IIll-defined
Country (%) (%) (%) (%) (%) leading symptoms
causes and causes
(%) (%)
Nicaragua Enteritis Diseases Accidents Homicides, Influenza/
and other of the heart legal inter- pneumonia
diarrheal ventions, and
diseases operations
of war
13.6 11.2 7.5 5.5 4.1 41.9 27.0
Peru Influenza/ Enteritis Malignant Diseases Accidents
pneumonia and other neoplasms of the heart diarrheal
diseases
15.8 11.4 7.0 6.5 5.1 45.8 8.4
Honduras Enteritis Diseases Homicides, Influenza/ Causes of
and other of the heart legal inter- pneumonia perinatal
diarrheal ventions, and mortality
diseases operations
of war
9.4 8.9 7.2 3.8 3.3 32.7 31.8
Guatemala Enteritis Influenza/ Causes of Accidents Diseases
and other pneumonia perinatal of the heart
diarrheal mortality
diseases
17.7 14.4 9,4 7.1 3.8 52.3 15.3
Ecuador Enteritis Diseases Accidents Influenza/ Bronchitis,
and other of the heart pneumonia emphysema,
diarrheal and asthma
diseases
12.2 8.6 8.2 8.1 6.3 43.4 16.5
Source: Pan American Health Organization. Health Condition.s in the Americas, 1977-1980. Washington, D.C., Scientific Publication 427,
1982.
the content of Table 4 considerably. In general, the
proportion of deaths in this category is used as an
indicator of not only the quality of mortality
informa-tion but also of the coverage of medical care available
for the disease that caused the death. Another indicator
of this type is given by the proportion of medically
certified deaths which tends to be inversely related lo
deaths from ill-defined causes. The four countries of the
second group that have these data report percentages
that range from 11 to 67 percent, corresponding to the
countries with the largest and smallest proportion of
ill-defined causes, respectively.
The preceding discussion illustrates the value of
using life expectancy at birth as an indicator of
mortal-ity, and its usefulness for the health planner and
admiri-istrator, since it provides indirect information about the
age distribution of the population and its most
impor-tant health problems in a single figure. The analysis of
life expectancy can be enhanced by calculating survival expected at certain ages, notably, life expectancy at one
year of age; this value is in general much higher than
that at birth, since it deals with those who have survived
infant mortality. In addition, when census information
and suitable mortality data are available, one can
con-struct life tables for certain subgroups of the
popula-tion, according to cause-specific of mortality or
accord-ing to geographic, social, occupational, or other
criteria, taken separately orjointly, to analyze and
mon-itor the survival of population groups with risks of
different types and magnitude. Similarly, so-called
"decremental" life tables can be constructed, which
make it possible to estimate the number of years of life
that would be gained if it were possible to eliminate one
or several causes of death.
health sector contribute to the reduction of economic
and social inequalities among the countries of the
Region and within each of them. The figures analyzed
reflect differences among the countries, but they do not
provide information with respect to internal
inequali-ties. Except for data referring to geographic
subdivi-sions, the necessary information for documenting these
differences and monitoring the process of their
reduc-tion tends to be more difficult to obtain in the least
developed countries, where it can be assumed that these
differences may be more pronounced. This situation
requires that decisions be made to strengthen the efforts
of the health sector in attaining information, be
it
by
censuses and ongoing registration of mortality, or by
periodic studies, to achieve a more effective and efficient
use of the knowledge and resources available in the
prevention and control of disease.
(Source:
Epidemiology Unit, Health Programs
Development, PAHO.)
Diseases Subject to the International
Health Regulations
Cholera, yellow fever, and plague cases and deaths reported in the
Region of the Americas up to 31 August 1983
Yellow fever
Country and Cholera Plague
administrative subdivision cases Cases Deaths Cases
BOLIVIA - 10 10 20
Beni - I I
Cochabamba 7a 7
a
7
La Paz - 2 2 20
BRAZIL - 7 7 36
Bahía - - - 6
Ceará - - - 30
Pará - 2 2
Rodónia - 5 5
CANADA 1 - -
-Ottawa lb
COLOMBIA - 1 1
Santander - 1
b
Ib
ECUADOR - 4 1
Chimborazo - 1 1
-Pastaza - 3
-PERIT - 18 17
-Huanuco - 1 1
-Junín - 3 3
Madre de Dios - 4 14
San Martin - 10 9
-UNITED STATES 1 - - 28
Arizona - - - 9
California - - - 1
New Jersey lb
New Mexico - - 16
Oregon - -
-Uttah - - -1
aRevised data.