measures of access and users’ internet skills
Marcelo Henrique de Araujo¹ Nicolau Reinhard¹
Maria Alexandra Cunha²
¹ Universidade de São Paulo / Faculdade de Economia, Administração e Contabilidade (FEA-USP), Programa de Pós-Graduação em Administração, São Paulo / SP — Brazil
² Fundação Getulio Vargas / Escola de Administração de Empresas de São Paulo, Departamento de Informática e Métodos Quantitativos, São Paulo / SP — Brazil
This article aims to analyze how measures to promote Internet access, and users’ competencies influence the use of electronic government services in Brazil. We adopted Sen’s Capability Approach as theoretical framework in order to analyze the microdata from the ICT Households 2013, a national-wide survey coordinated by the Regional Center for Studies on Development of the Information Society (Cetic.br). The results indicate that for social classes C (middle class), D and E (lower class) the increase in the odds ratio of the use of e-gov services is strongly influenced by both internet access preferably at home or work (individual access) as well as the users’ internet skills.
Keywords: electronic government; capability approach; ICT Households Survey; internet skills.
Serviços de governo eletrônico no Brasil: uma análise a partir das medidas de acesso e competências de uso da internet
Este artigo tem como objetivo analisar como medidas de disponibilidade de acesso à internet e de competência de uso influenciam o uso de serviços de governo eletrônico no Brasil. A pesquisa se baseou na abordagem das capacidades de Amartya Sen para a análise dos microdados da pesquisa TIC Domicílios coordenada pelo Centro Regional de Estudos para o Desenvolvimento da Sociedade da Informação, referente ao ano-base de 2013. Para o tratamento e a análise dos dados, empregou-se um conjunto de técnicas estatísticas multivariadas. Os resultados indicam que nas classes C, D e E o aumento da chance de uso de serviços de e-gov é fortemente influenciado pela disponibilidade de acesso à internet em casa ou no trabalho (acesso individual), assim como pela maior compe-tência de uso de outros recursos da internet.
Palavras-chave: governo eletrônico; abordagem das capacidades; Tic Domicílios, competências de uso da internet.
Servicios de gobierno electrónico en Brasil: un análisis a partir de medidas de acceso y competencias de uso de Internet
En este artículo se pretende analizar cómo la disponibilidad de medidas de acceso a internet y las habilidades de uso de internet (capacidades) influyen en el uso de los servicios de gobierno electrónico en Brasil. La investigación se fundamenta en el enfoque de las capacidades de Amartya Sen para el análisis de los microdatos de investigación TIC Domicílios coordinados por el Centro Regional para el Desarrollo de la Sociedad de la Información (Cetic.br), para el año base de 2013. Los resultados indican que en las clases C (clase media), D y E (clase baja) el incremento de la probabilidad de adopción de servicios de gobierno electrónico está fuertemente influenciado por el acceso a internet en casa o trabajo (acceso individual), así como la amplitud de competencias del usuario en utilizar otros recursos de internet.
Palabras clave: gobierno electrónico; enfoque de las capacidades; Tic Domicilios; competencias de uso de internet.
DOI: http://dx.doi.org/10.1590/0034-7612171925
Article received on November 13, 2016 and accepted on August 30, 2017.
1. INTRODUCTION
This article explores the use of information and communication technology (ICT) by Brazilian citizens in consuming government services and the way in which factors such as internet availability and internet usage competencies affect the use of these electronic services.
For years the governmental sector has been using ICT resources in an intensive manner to provide improved management and operations for public administration processes in terms of a greater variety of services for citizens as well as better quality and effectiveness. More recently, it has also developed technology applications to expand the democratic practices on offer. Initiatives which are based on the use of ICT and redefine the way in which the government and its citizens interact are known by the term “electronic government” (e-gov) (Barbosa, Pozzebon and Diniz, 2013; Cunha and Miranda, 2013, Diniz et al., 2009).
There is no consensus on the definition of electronic government. However, Diniz and collaborators (2009) affirm that the dimension of this term cannot be reduced to the massive use of these technological artifacts within the context of the public sector, but must also include the use of these technologies to provide services and improve public management, for example. In this sense, the discussion proposed in this article is oriented towards public e-services, which consist of the use of ICT to improve the services provided to citizens and organizations (Cunha and Miranda, 2013).
In Brazil, e-gov initiatives have become popular due to the variety of electronic services (e-services) available to the population, such as the electronic voting system, and systems for filing income tax returns, scheduling medical appointments, and registering students at public schools, among others (Reinhard and Moya, 2002; Avgerou et al., 2009). However, the success of these e-gov initiatives is conditioned on access and predisposition to using ICTs which make this interaction between the government and civil society possible.
In terms of the access dimension, we note the existence of digital inclusion public policies in this country that seek to offer individual as well as collective access. Individual access policies consist of actions that favor the acquisition of information technology equipment and internet access, for example, through the reduction of taxes charged on acquiring ICT resources. Collective access policies focus on offering and making available free access (e.g., telecenters) or paid access in public centers (e.g., Cybercafés) (Vaz, 2016).
The assessment of these public policies requires the creation of measurement mechanisms which make it possible to better understand the impact of using these technological resources on a national scale. To accomplish this, the Brazilian Internet Steering Committee (CGI.br), through its Regional Center for Studies on the Development of the Information Society (Cetic.br), conducts surveys that generate statistics and indicators about the use of the internet in different areas (health, government, companies, etc.). The annual ICT Households Survey used in this article, explores aspects related to ICT infrastructure in urban and rural households and the way these resources are used by individuals of at least 10 years of age (CGI.BR, 2014).
analysis would possibly obscure specific findings for rural areas. Therefore, we have opted to limit this investigation to respondents from urban regions in this country. To analyze this phenomenon, we use the capability approach proposed by Amartya Sen (2000), which contemplates in an explicit manner the freedom of choice exercised by people when they use available resources, conditioning factors (skills and social factors) that influence this decision, and the distinct ways in which these resources are applied.
The contribution of this article is that it explores the demand side of these e-services from a capability approach. The distinguishing aspect of this approach (when compared to the models that are most often used in the e-gov literature such as Technology Acceptance Model (TAM) and Unified Theory of Acceptance and Use of Technology (UTAUT) is that it makes it possible to explore, through mediation chains, the effects of access conditions and internet user skills on the freedom of the user to utilize electronic government services. In addition, the microdata from the ICT Households Survey makes it possible — through a probabilistic sample of the national reality — to explore the depth of the e-service phenomenon within the Brazilian context. The analysis model employed enables us to evaluate digital inclusion policies of the 1st order (internet access), as well as categorize users in terms of their internet
usage competencies, and the differences between these categories in the use of e-gov services (digital inclusion of the 2nd order) (Van Deursen and Helsper, 2015; Helbig, Gil-García and Ferro, 2009).
After this introduction, Sections 2 and 3 will present electronic government services and the technical fundamentals of the capability approach. Section 4 delineates the methodological strategy adopted, and it is followed by Section 5 which includes the description and analysis of the findings of this investigation. Finally Section 6 will present our final considerations.
2. ELECTRONIC GOVERNMENT SERVICES
Electronic government services (or e-services) are one of the most popular e-gov initiatives, having been associated from the outset with the very concept of electronic government (Barbosa, Pozzebon and Diniz, 2013; Cunha and Miranda, 2013; Diniz et al., 2009). However, in this article we use the concept of e-services in a more limited sense, covering the use of ICT tools — such as government portals or mobile devices — as the channel for providing public services to citizens and companies (Cunha and Miranda, 2013; Diniz et al., 2009). Beginning in the mid-nineties, various spheres of government have invested in the development of these initiatives. In Brazil, the most notable services have dealt with filing tax returns, electronic voting, scheduling medical appointments, registering students for public schools, citizen customer service centers and the participatory digital budget (Avgerou et al., 2009; Reinhard and Moya, 2002; Pinho, 2008; Cunha, Frega and Lemos, 2011).
According to a review of the literature conducted by Cunha, Coelho and Przeybilovicz (2017) regarding the national and international academic production on electronic government services, there has been a predominance in the application of (generalist) technology adoption models, such as TAM (Davis, 1989) and UTAUT (Venkatesh et al., 2003) to predict the adoption and use of e-services. These models are based on the use of variables that capture perceptions, beliefs and attitudes (such as ease of use, and the perceived usefulness, among others) to predict the use of these electronic services. Although they are useful, these predictors are difficult to measure and are not available to public institutions that seek to increase the intensity of e-services use (Gerpott and Ahmadi, 2016:641).
2008) and measurements of internet skills and use (Athmay, 2015; Gerpott and Ahmadi, 2016; Zheng, 2017). Even though it is aligned with this stream of research, the work of Gerpott and Ahmadi (2016) points to significant limitations of this approach due to the use of small samples with respondents selected without any systematic process and a predominant focus on the reality of the United States and Asia.
Considering the academic production of electronic government field, several authors (e.g., Mota et al., 2016; Gerpott and Ahmadi, 2016; Van Dijk, Peters and Ebbers, 2008; Helbig, Gil-García and Ferro, 2009; Reddick, 2005) warn that the majority of studies have explored the phenomenon of e-services from the supply side perspective, that is, focusing on the characteristics available in e-gov services. Some of the most notable studies such as Rampelotto, Löbler and Visentini (2015), Pinho (2008), and Damian and Merlo (2013) analyze the effectiveness of electronic portals of several Brazilian state governments (e.g., Damian and Merlo, 2013; Pinho, 2008), as well as government institutions such as the Brazilian Federal Revenue agency (Rampelotto, Löbler and Visentini, 2015) in providing services to companies and citizens. Nevertheless, there is a scarcity of studies exploring the demand side of e-services, that analyze the interaction between citizens and various levels of government.
Barbosa, Pozzebon and Diniz (2013), through a qualitative investigation, developed a performance evaluation model for e-services focused on the citizen, based on a single case study for the municipality of São Paulo. Cunha, Frega and Lemos (2011) performed an analysis, through a quantitative national study, on the profile of Brazilian e-gov services users. Mota and collaborators (2016) analyzed, based on the perspective of citizens of the city of João Pessoa, the impact of civic mindedness, trustworthiness, ease of use and usefulness in the utilization of government portals. The studies of Barbosa, Pozzebon and Diniz (2013) and Mota and collaborators (2016), even though being based on different methodologies, make it possible to analyze the demand side of e-services through local initiatives (municipalities). Even though Cunha, Frega and Lemos (2011) used a sample to contemplate all Brazilian States, it is not characterized as a representative sample, which therefore reduces the degree to which the study’s results can be generalized to describe the country as a whole.
This investigation aims to contribute to the group of national studies which is dedicated to exploring which factors impact in adoption of electronic public services. More specifically, it seeks to contribute to those which explore the demand side perspective of e-services, analyzing the effects of the availability of internet access and internet skills on the use of e-services in Brazil among the various socioeconomic classes.
3. CAPABILITY APPROACH
It should be emphasized that the evaluation of a resource (good) and its appropriation depends on a series of cultural, social and knowledge factors which are called conversion factors. Thus, based on the access conditions of a given good and the related conversion factors, individuals will recognize a group of resources, which will be assessed on the basis of their access availability and perception of usefulness. As a consequence, we can reduce this initial group, its capability, to a smaller group of resources which will be taken into consideration in making choices in terms of use (Sen, 2000). Based on these capabilities, individuals will decide on how to use these resources to achieve their functioning, that is, the results of the effective use of these resources, which in the last instance will lead to its utility, for example: the exercise of rights, well-being, and the use of e-gov services.
4. METHODOLOGY AND THE REFERENCE MODEL
This article adopts a quantitative methodological approach based on the ICT Households Survey, an annual national-wide survey coordinated by the Regional Center for Studies on the Development of the Information Society (Cetic.br). Microdata from the 2013 edition were used due to these being the most recent dataset available when this research was performed. This survey covers a wide variety of thematic blocks (e.g., ICT access, cell phones, electronic commerce, etc.), and this article explores only the data from blocks related to the use of the internet and electronic government.
Figure 1 illustrates the variables used to operationalize the employed reference model.
FIGURE 1 REFERENCE MODEL: AMARTYA SEN’S CAPABILITY APPROACH
This reference model aims to demonstrate, based on the availability of internet access, the factors that stimulate an individual to use e-gov services. The model is composed of three constructs: (i) conditions for acquisition of (or accessing) the resource; (ii) freedom and ability to choose (capabilities); and (iii) the results achieved (functionings).
In order to operationalize the first construct, we use the variable “(most frequent) Internet Access Location” from the survey. We consider only the most frequent access location understanding that this will be the environment where the user will feel most comfortable in engaging in e-gov activities.
The second construct will synthesize the internet user’s capabilities, which are here understood as the user’s internet skills. To operationalize them, we have analyzed the several activities related to the internet use patterns explored through the ICT Households Survey, that is, the groups of activities performed on the internet related to communication, looking up information and transactions, multimedia, education and work, downloads, and content creation and sharing.
The last construct synthesizes the target phenomenon of this article, the use of electronic government services. This concept was operationalized through a binary variable, indicating whether internet users have or have not utilized electronic government services over the past 12 months.
There are several ICT adoption models for the Information Systems field, such as TAM (Davis, 1989) and UTAUT (Venkatesh et al., 2003). These models are based on the evaluation of the beliefs and attitudes of users (e.g., perception of usefulness and ease-of-use), characteristics which are not always available in e-government studies (Gerpott and Ahmadi, 2016) and are also not measured by the ICT Households Survey. The capability approach (Sen, 2000) is more appropriate for providing a framework to explore the mediation chains demonstrated by the choices and actions of internet users, which therefore justifies the adoption of this theoretical approach. In addition to this, these theoretical concepts can be operationalized by attributes that can be directly measured by the ICT Households Survey, making it possible to conduct a study with a statistically representative sample, collected with robust procedures and available to both Brazilian governments and researchers.
Box 1 synthesizes the variables that the ICT Households Survey uses in its analyses.
BOX 1 VARIABLES
Variables Categories
Social Class A and B (combined), C and D and E (combined)
Internet Access Location (most frequent) Home, Work, Someone else’s house, School, Telecenter, Cybercafé, On the move; Other location
Use of Electronic Government Services Yes/No Communication
Group of binary items (Yes/No) for each of the several activities performed online Looking Up Information and Transactions
Multimedia Education and Work
In Box 1, social class is a demographic attribute that indicates the internet user’s socioeconomic class. In this investigation, we have opted to group some social groups, dividing them into: Classes A and B (upper class); Class C (middle class); and Classes D and E (lower class). Internet access location indicates the preferred environment (most frequent) that the individual uses to access the internet. The use of e-gov services is measured by a binary metric, indicating whether these services have been used in the past 12 months.
The other variables presented in Box 1 represent the different uses identified by the ICT Households Survey. Each of them is represented by a set of binary metrics which explore activities linked to communication, looking up information and transactions, multimedia, education and work, downloads, and content creation and sharing.
Descriptive and multivariate statistic techniques were used in data analysis (exploratory factor analysis for binary data, logistic regressions, cluster analysis and correspondence analysis). The statistical procedures were conducted using IBM SPSS 19 and Stata 11.
Before analyzing the mediation chain for e-gov services, we explored the relationship between the most frequent internet access location with the internet user’s social class, using the correspondence analysis technique (Anacor). The main objective of this technique is to elucidate, through a perceptual map, the associations between the categories of these two variables (Hair et al., 2006; Fávero et al., 2009).
Binary factor analysis and cluster analysis were applied to classify internet users in groups based on the variety of activities performed on the Internet. Factor analysis is a multivariate technique whose objective is to identify the relatively small number of factors in common (latent variables) that can be used to represent the relationships between a large number of inter-related variables (Fávero et al., 2009). However, due to the natural dichotomy of the data, a specific variation of this technique was applied, namely binary factor analysis (Bartholomew et al., 2002). Cluster analysis is a procedure that seeks to form homogeneous groups based on their similarity in terms of given characteristics stipulated by the researcher (Fávero et al., 2009; Hair et al., 2006).
Due to the number of activities explored in each of the internet use patterns (e.g., communication, education and work), binary factor analysis technique was applied to reduce the dimension of this data. Then cluster analysis was applied using the factor scores for these latent factors. These groupings serve as a measurement of the capabilities exposed in the reference model (figure 1).
Binary logistic regression technique was used to evaluate the impact of each of the internet access locations on the probabilities of users belonging to one of these internet user groups, and the way in which belonging to one of the referred clusters influences the decision to use e-gov services.
Continue
5. DISCUSSION AND ANALYSIS OF THE RESULTS
The ICT Households Survey is based on a statistically representative sample of 16,887 households, located in urban and rural regions throughout the Country. For this article, we selected urban area residents, consisting of 14,931 respondents and those of 16 years of age or older (13,703), which is considered the initial age for the use of e-gov services. Classes A and B correspond to 46.3% of the sample, Class C, 47.6%, and Classes D and E, 6.1% (table 1). The sample is further limited to individuals who have used the internet at least once in the three months before the data collection (6,739).
TABLE 1 CHARACTERIZATION OF THE SAMPLE
Criteria Size (n)
Complete database 16,887
Urban region 14,931
Individuals of 16 years of age or older 13,703
Users who have already used the internet 7,783
Users that have used the internet at least once in the past three months 6,739 (sample)
Classes A and B (aggregate) 3,123 (46.3%)
Class C 3,206 (47.6%)
Classes D and E (aggregate) 410 (6.1%)
Source: Elaborated by the authors.
5.1 AVAILABILITY OF INTERNET ACCESS
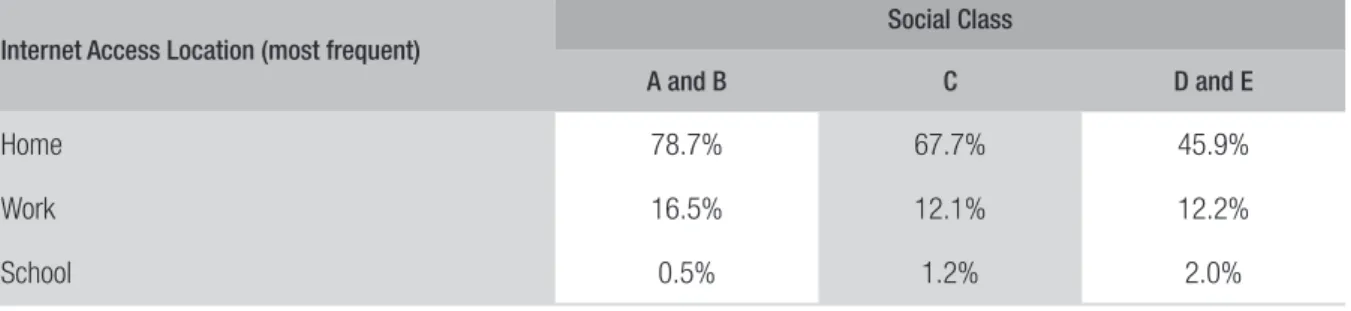
Table 2 presents the users’ main internet access locations, segmented by social class. The percentages are calculated based on the total number of internet users per social class, which makes it possible to explain the differences between these users in terms of their internet access location and social class.
TABLE 2 INTERNET ACCESS LOCATION (PERCENTAGE)
Internet Access Location (most frequent)
Social Class
A and B C D and E
Home 78.7% 67.7% 45.9%
Work 16.5% 12.1% 12.2%
Internet Access Location (most frequent)
Social Class
A and B C D and E
Someone else’s house 1.4% 9.4% 17.1%
Telecenter (free public access center) 0.1% 0.5% 1.0%
Cybercafé (paid public access center) 1.1% 6.5% 16.8%
On the move 1.5% 2.2% 4.9%
Other locations 0.1% 0.6% 0.2%
Source: Elaborated by the authors.
Home is the main internet access location for all the three socioeconomic classes. For classes A and B, most internet use occurred at home (78.7%) and work (16.5%). For class C, the percentages in terms of the preferred internet access location were 67.7% for home, and 12.1% for work. In this class, the percentages for people who use the internet in someone else’s house (9.4%) and Cybercafés (6.5%) displayed greater values. For classes D and E, even though most of the users access the internet from home, the percentage represents less than half of them (45.9%). On the other hand, other locations gained more prominence: other people’s houses (17.1%), Cybercafé (16.8%) and work (12.2%).
From the percentages for Classes C and D and E, we note the importance of internet access at someone else’s house: this option came in third place for Class C and second for Classes D and E, which demonstrates the existence of relationship networks among these internet users for internet access. Table 2 also shows the importance of paid public access centers (cybercafé) to classes D and E. The use of telecenters is not very common (as a proportion of access) for Class C (0.5%) as well as Classes D and E (1%). To explore the relationships between the users’ most frequent internet access location and social class, we used correspondence analysis technique. First, we applied a non-parametric chi-squared test to the access location and social class variables, which demonstrated the existence of an association between these variables (χ² = 631.4; p < 0.01;), therefore meeting the underlying assumption for applying Anacor.
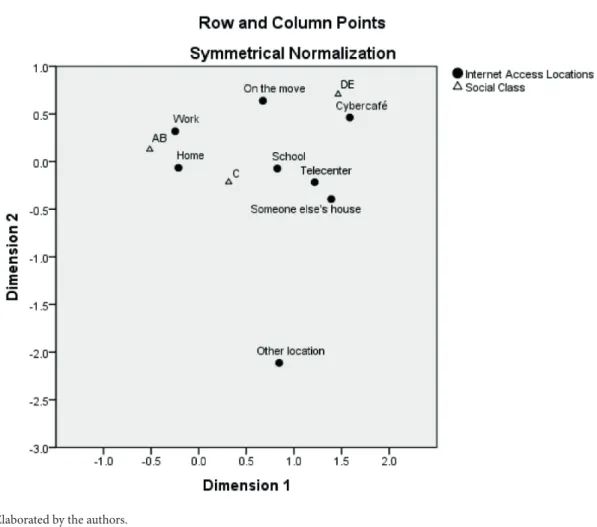
The Anacor perceptual map (figure 2) shows the categories for the variables social class and internet access location. The closer the categories, the greater their association. Dimensions 1 and 2 explain respectively 96.2% and 3.8% of the total inertia of the data. Dimension 1 is much more relevant to explaining the behavior of the data.
largest percentage of internet users who access the internet through mobile devices. This situation could also be the result of public policies that promoted the creation of internet access points in public spaces, such as public squares (e.g., the Free Wi-Fi Program in São Paulo, among others).
FIGURE 2 ASSOCIATION BETWEEN INTERNET ACCESS LOCATION AND SOCIAL CLASS (PERCEPTUAL MAP)
Source: Elaborated by the authors.
5.2 EXPLORING INTERNET USAGE PATTERNS
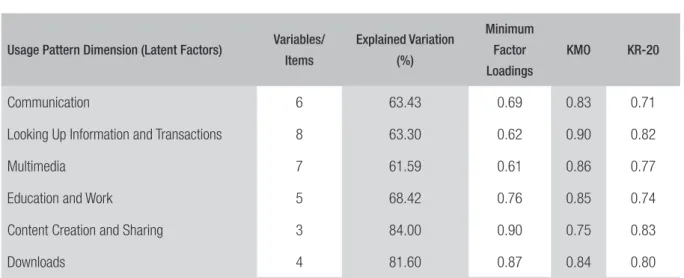
In order to explore the various internet usage patterns, we use a group of 33 dichotomic variables (yes/no) — related to Module C (internet use) of the ICT Households Survey — which represents the activities that can be realized on the internet.
TABLE 3 INTERNET USAGE PATTERNS
Usage Pattern Dimension (Latent Factors) Variables/ Items
Explained Variation
(%)
Minimum
Factor
Loadings
KMO KR-20
Communication 6 63.43 0.69 0.83 0.71
Looking Up Information and Transactions 8 63.30 0.62 0.90 0.82
Multimedia 7 61.59 0.61 0.86 0.77
Education and Work 5 68.42 0.76 0.85 0.74
Content Creation and Sharing 3 84.00 0.90 0.75 0.83
Downloads 4 81.60 0.87 0.84 0.80
Source: Elaborated by the authors.
The underlying variable approach (Bartholomew et al., 2002) was used, in which a Pearson correlation matrix is substituted by a tetrachoric correlation matrix in order to allow the estimation of latent factors. The functionality available through the Stata software (tetrachoric library), which calculates tetrachoric correlation matrices, makes it possible to obtain a correlation matrix that can be applied to factor analysis. To determine whether the data was appropriate for the technique’s assumptions, we used the KMO (Kaiser-Meyer-Olkin) method, which presented values above 0.7 for all of the analyses, indicating that this sample is appropriate for the use of this technique.
Factor analysis was applied to each of the six variable groups (table 3), using the extraction method of principal component analysis (PCA) and using retention criteria for factors with eigenvalues greater than or equal to 1. The PCA method was used due to the objectives of reducing the dimensions and validating the construct variables (the usage pattern dimension) (Fávero et al., 2009).
The data in table 3 demonstrate the one-dimensionality of the relationship of each type of use after the extraction of the six latent factors, that were then named for the activities that they represent: (i) communication; (ii) looking up information and transactions; (iii) multimedia; (iv) education and work; (v) content creation and sharing and (vi) downloads. Each of the variables (items) presented a factor load above 0.6; therefore, none was excluded based on a low correlation with the corresponding factor. To analyze the internal reliability of these factors, we used the KR20 measure — a measure similar to Cronbach’s Alpha, but applicable just to dichotomic data (Sijtsma, 2009).
The data in table 3 demonstrate that all of the factors have values above 0.7, which makes it possible to confirm the internal reliability of each of the factors. Next, we calculated the standardized factor scores (those with mean of zero and a standard deviation of 1), which made it possible to work with the variables that represent each of these six latent factors.
factors. Before applying the cluster analysis, we inspected the data (through Box-plot graphs) to verify whether there were any outliers or missing data which could affect the characterization of the clusters.
In order to define the number of clusters, we initially opted for the application of the hierarchical cluster analysis technique (through the between-groups method and the quadratic Euclidean distance). The analysis of the results presented in the dendrogram and agglomeration schedule demonstrated the formation of four clusters as the best alternative. Based on this definition of the number of conglomerates, cluster analysis was applied again, but using the k-means method.
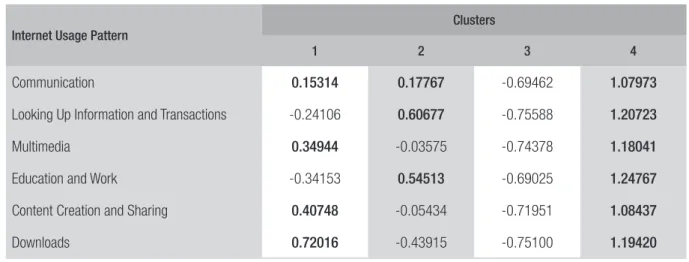
Table 4 presents the final clusters centers in relation to the variables utilized for their formation.
TABLE 4 FINAL CLUSTER CENTERS
Internet Usage Pattern
Clusters
1 2 3 4
Communication 0.15314 0.17767 -0.69462 1.07973
Looking Up Information and Transactions -0.24106 0.60677 -0.75588 1.20723
Multimedia 0.34944 -0.03575 -0.74378 1.18041
Education and Work -0.34153 0.54513 -0.69025 1.24767
Content Creation and Sharing 0.40748 -0.05434 -0.71951 1.08437
Downloads 0.72016 -0.43915 -0.75100 1.19420
Source: Elaborated by the authors.
Groups 3 and 4 present opposite profiles. Cluster 4 consists of users with a varied usage pattern, that is, they use the internet for a wide array of activities. All these grouping indices are positive with larger values than the other clusters, indicating that the internet users in this group engage in a greater variety of activities within each of the usage patterns (e.g., communication, looking up information). Cluster 3, on the other hand, comprises the users who execute the smallest quantity of activities (in comparison with the other clusters), which thus characterizes this group as one that uses the internet only for a very restricted group of tasks. The indicators show values that are lower than all the other groupings for all the usage patterns analyzed.
5.3 MEDIATION CHAIN FOR THE USE OF E-GOV SERVICES
The results of the mediation chain described in the reference model for this study (figure 1) are presented in tables 5, 6 and 7.
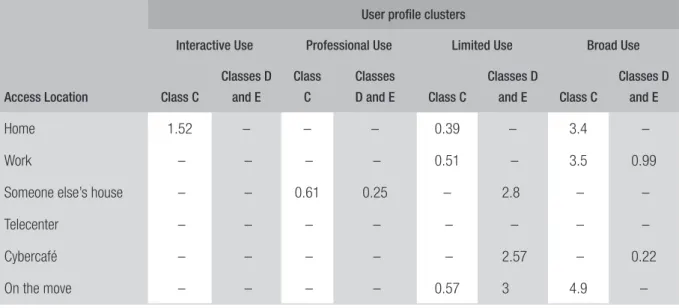
Binary logistic regression technique was applied using the odds ratio measures, where an odds ratio measure indicates how much — while maintaining the other conditions constant — each of the independent variables increases the chance of the studied phenomenon occurring (Fávero et al., 2009). Odds ratio above 1 indicate an increase in the probability of the event (in this case, use e-gov services), while odds ratio values less than 1 indicate that there will be a decrease in the chances of this event. Table 5 displays the odds ratio values (95% level of confidence) of the different internet access locations in relation to the chance that the individual belongs to each of the analyzed user groups (e.g., interactive use, broad use, etc.). To apply this technique, the access location variable was transformed into a group of seven dummies, defining the category “other location” as the reference dummy. It should be emphasized that “-” in the tables refers to attributes that were not statistically significant in relation to the level of confidence imposed. We evaluated only Class C and class D and E, considering that the use of e-gov services among Classes A and B has already been disseminated and does not require further efforts in terms of diffusion.
TABLE 5 CONTRIBUTION OF THE INTERNET ACCESS LOCATION TO EACH OF THE INTERNET USER GROUPS (ODDS RATIO)
Access Location
User profile clusters
Interactive Use Professional Use Limited Use Broad Use
Class C
Classes D
and E
Class
C
Classes
D and E Class C
Classes D
and E Class C
Classes D
and E
Home 1.52 – – – 0.39 – 3.4 –
Work – – – – 0.51 – 3.5 0.99
Someone else’s house – – 0.61 0.25 – 2.8 – –
Telecenter – – – – – – – –
Cybercafé – – – – – 2.57 – 0.22
On the move – – – – 0.57 3 4.9 –
Source: Elaborated by the authors.
a different location. Furthermore, the significant role of the internet using mobile devices (on the move) should be emphasized with such users having a 4.9 times greater chance of belonging to the more advanced group (Broad Use).
Within the Limited Use group, we may observe that members of Class C who use the internet more frequently at home, at work or “on the move” (mobile devices) have a lesser chance of belonging to the Limited Use group (an odds ratio of less than 1). This decrease in likelihood is explained by the positive impact of a preference for these locations on the chance of belonging to the Broad Use group. Within Classes D and E, it can be observed that the preference for using the internet at someone else’s house, a Cybercafé or on the move considerably increases (2.5 to 3 times) the odds of the user belonging to the Limited Use group. This result suggests that the preferred use of the internet in paid public access center (also considered in digital inclusion policies), for example, contributes little to the creation of more intense internet users.
The data in table 5 also indicates that the use of mobile devices (while the user is moving) differs in impact on Class C and Classes D and E. In terms of Class C, the preference for using mobile phones increase the odds of belonging to the Broad Use group, or in other words, increases the variety of activities in internet use, while in Classes D and E this impact does not occur, since the preference for mobile devices in these classes increases three times the chances of users belonging to the Limited Use group. In other words, while in Class C mobile devices make it possible to broaden the variety of activities performed online (communication, education and work, multimedia etc.), in Classes D and E the same device is less often employed for these types of use.
In terms of the Interactive Use and Professional Use groups, it can be observed that most of the indices are not statistically significant. This suggests that internet access location by itself is not enough to explain the behavior of the groups which are characterized by Interactive Use and Professional Use.
TABLE 6 CONTRIBUTION OF INTERNET USER GROUPS TO THE USE OF ELECTRONIC GOVERNMENT SERVICES (ODDS RATIO)
User Groups Class C Classes D and E
Interactive Use 1.3 2.072
Professional Use 3.14 5.62
Limited Use 0.21 0.16
Broad Use 6.8 6.78
Source: Elaborated by the authors.
the second most likely group to use e-gov services, followed by the Interactive Use group. Therefore, internet usage competence (capability) positively influence the use of e-services, mainly for the social classes C and D and E.
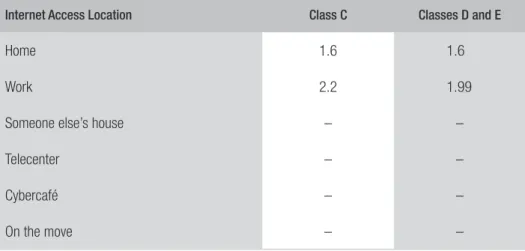
Table 7 demonstrates the individual impact of internet access location on the chances of using e-gov services.
TABLE 7 CONTRIBUTION OF INTERNET ACCESS LOCATION TO THE USE OF ELECTRONIC GOVERNMENT SERVICES (ODDS RATIO)
Internet Access Location Class C Classes D and E
Home 1.6 1.6
Work 2.2 1.99
Someone else’s house – –
Telecenter – –
Cybercafé – –
On the move – –
Source: Elaborated by the authors.
This reinforces the finding that using the internet at home or at work — for Class C as well as Classes D and E — considerably increases the odds of the individual being a user of electronic government services. Collective access environments, such as telecenters and Cybercafés, are not very significant as motivators for the use of e-gov services. Therefore, this indicates that public policies that favor internet access in these sorts of environment may be less effective to increase the use of e-gov services.
6. FINAL CONSIDERATIONS
This article aims to analyze the way in which the availability of internet access and internet user skills influence the use of electronic government services in Brazil. To this end, it adopts a quantitative methodological approach based on microdata from the ICT Households Survey of 2013. The research’s reference model is based on the capability approach, developed by the economist Amartya Sen (2000). To realize these analyses, the following multivariate techniques were applied: (i) binary factor analysis, (ii) cluster analysis, (iii) a logistic regression and (iv) correspondence analysis.
The investigation’s results demonstrate the home as the main (most frequent) internet access location for all socioeconomic classes. However, while in Classes A and B access is almost restricted to home or work (95.2% of the observations, see table 2), in Classes C and D and E other locations are prominent. For example, someone else’s house occupies third place in Class C’s preferences and second place in the preferences of Classes D and E. The results also show a low user preference for telecenters (public centers with free access) and Cybercafé (paid public access centers), locations that are featured in public policies sponsoring digital inclusion. In particular, telecenters presented a low level of being the most frequent form of internet access, both for Class C (0.5%) as well as Classes D and E (1%). Cybercafés, even though they represent a low use percentage for Class C (6.5%), are still the third most preferred location for internet access by Classes D and E (16.8%). Even though it being recent, a preference for internet access through mobile devices (on the move) was proportionately greater for Classes D and E (4.9%) and C (2.2%). This trend possibly reflects digital inclusion policies that seek to create public locations for free internet access to increase internet use through mobile devices, such as the Free Wi-Fi program in São Paulo, and others in Brazil. In addition, the high cost of broadband access through mobile devices in Brazil could be an important limitation for the use of the internet by Classes C and D and E.
In relation to the different internet usage patterns, this study’s findings have allowed us to characterize the following user groups: (i) Broad Use; (ii) Limited Use; (iii) Interactive Use; and (iv) Professional Use. The first group consists of internet users with a varied pattern of use, that is, they use the internet for a broad variety of activities. The second group, on the other hand, uses the internet for a quite restricted group of activities. The third group represents users who use the internet for very interactive activities such as communication, multimedia, and the content creation and sharing. Finally, the last group consists of those who use the internet for professional purposes, that is, activities linked to searching for information and online transactions, educational tasks and work.
In terms of the factors that impact the use of electronic government services, this investigation’s findings demonstrate that it is influenced by internet access location and a series of internet skills. In other words, a preference for internet access at home, work or through mobile devices (just for Class C) positively affects the chance of a user belonging to the Broad Use group, who in turn, are more likely (compared to the other groups) to use e-gov services.
The results of this investigation demonstrate that the preference for using the internet in Cybercafé or at someone else’s house favors users that belong to the Limited Use group, which as a result reduces the chance that they will use e-gov services. These results reinforce the finding that internet access at public centers such as telecenters and Cybercafé has not been shown to be effective in increasing the utilization of e-gov services. In terms of public policies, this investigation’s findings point out that actions that facilitate individual access to the internet (e.g., reducing taxes on ICT equipment or reducing fees for broadband service for mobile devices for Classes C and D and E), could be more efficient as policies to stimulate and expand the use of e-gov services, compared to initiatives that seek to reorient paid (Cybercafés) and free public access centers (telecenters) to become access points for e-gov services.
The main limitation of this research is that it is related to the use of a single measure of e-services, without considering the diversity of different types of electronic government initiatives. Another limitation has to do with the groupings of Classes A and B and D and E. This action was necessary due to the low number of respondents from Class A as compared to the entire sample (this led to the joining of Classes A and B), but also because the grouping of Classes D and E is already defined in the microdata for the ICT Households Survey. These groups impede the identification of differences between classes, but do not harm the socioeconomic stratification of internet users.
REFERENCES
ATHMAY, Alaa A. A. R. A. A. Demographic factors as determinants of e-governance adoption. A field study in the United Arab Emirates. Transforming Government: People, Process and Policy, v. 9, p. 159-180, 2015.
AVGEROU, Chrisanthi et al. Interpreting the trustworthniness of government mediated by information and communication technology: lessons from electronic voting in Brazil. Information Technology for Development, v. 15, n. 2, p. 133-148, 2009.
BARBOSA, Alexandre F.; POZZEBON, Marlei; DINIZ, Eduardo H. Rethinking e-government performance assessment from a citizen perspective.
Public Administration, v. 91, n. 3, p. 744-762, 2013.
BARTHOLOMEW, David et al. The analysis and
interpretation of multivariate data for social scientists. London: Chapman & Hall: CRC Press, 2002.
BIDO, Diógenes S.; MANTOVANI, Daielly M. N.; COHEN, Eric D. Aplicações da análise fatorial exploratória à pesquisa na área de produção e operações: um estudo em publicações nacionais e internacionais. In: SIMPÓSIO DE ADMINISTRAÇÃO DA PRODUÇÃO, LOGISTICA E OPERAÇÕES INTERACIONAIS, 19., São Paulo, 2016. Anais... São Paulo: FGV, 2016. p. 1-12.
CGI.BR. Pesquisa sobre o uso das tecnologias da informação e da comunicação no Brasil — TIC Domicílios e TIC Empresas 2013. São Paulo: CGI. br, 2014.
CUNHA, Maria A.; COELHO, Taiane R.; PRZEYBILOVICZ, Érico. Get into the club: Positioning a developing country in the international e-gov research. Electronic Journal of Information Systems in Developing Countries. v. 79, n. 4, p. 1-21, 2017.
CUNHA, Maria A. V. C.; MIRANDA, Paulo R. M. Uso de TIC pelos governos: uma proposta de agenda de pesquisa a partir da produção acadêmica nacional. Organizações & Sociedade, v. 20, n. 66, p. 543-566, 2013.
CUNHA, Maria A. V. C.; FREGA, José R.; LEMOS, Iomara S. Portais de serviços públicos e de informação ao cidadão: uma descrição do perfil do visitante.
Revista Eletrônica de Sistemas de Informação, v. 9, n. 1, p. 1-19, 2011.
DAVIS, Fred D. Perceived usefulness, perceived ease of use, and user acceptance of Information Technology. MIS Quarterly, v. 13, n. 3, p. 319-340, 1989.
DAMIAN, Ieda O. M.; MERLO, Edgard M. Uma análise dos sites de governos eletrônicos no Brasil sob a ótica dos usuários dos serviços e sua satisfação.
Rev. Adm. Pública, Rio de Janeiro, v. 47, n. 4, p. 877-899, 2013
DINIZ, Eduardo H. et al. O governo eletrônico no Brasil: perspectiva histórica a partir de um modelo estruturado de análise. Rev. Adm. Pública, Rio de Janeiro, v. 43, n. 1, p. 23-48, 2009.
FÁVERO, Luiz P. et al. Análise de dados: modelagem multivariada para tomada de decisões. Rio de Janeiro: Elsevier, 2009.
GERPOTT, Torsten J.; AHMADI, Nima. Use levels of electronic government services among German citizens: An empirical analysis of objective household and personal predictors. Transforming Government: People, Process and Policy. v. 10, n. 4, p. 637-668, 2016.
HAIR, Joseph F. et al. Multivariate data analysis. New Jersey: Pearson Prentice Hall, 2006.
HELBIG, Natalie; GIL-GARCÍA, J. Ramon; FERRO, Enrico. Understanding the complexity of electronic government: implications from the digital divide literature. Government Information Quartely, v. 26, p. 89-97, 2009.
MACHADO, João G. R.; PAMPLONA, João B. A ONU e o desenvolvimento econômico: uma interpretação das bases teóricas da atuação do PNUD. Economia e Sociedade, v. 17, n. 1, p. 53-84, 2008.
MOTA, Flávio P. B. et al. The influence of civic mindedness, trustworthiness, usefulness, and ease of use of government websites. Revista de Administração, v. 51, n. 4, p. 344-354, 2016.
PINHO, José A. G. Investigando portais de governo eletrônico de estados no Brasil: muita tecnologia, pouca democracia. Rev. Adm. Pública, Rio de Janeiro, v. 42, n. 3, p. 471-93, 2008.
RAMPELOTTO, Alexandre; LÖBLER, Mauri L.; VISENTINI, Monize S. Avaliação do sítio da Receita Federal do Brasil como medida da efetividade do governo eletrônico para o cidadão. Rev. Adm. Pública, Rio de Janeiro, v. 49, n. 4, p. 959-983, July/ Aug. 2015.
REDDICK, Christopher G. Citizen interaction with e-government: from the streets to servers?
Government Information Quarterly, v. 22, n. 1, p. 38-57, 2005.
REINHARD, Nicolau; MOYA, Ricardo W. The adoption of electronic filing for individual income tax returns in Brazil. In: INTERNATIONAL CONFERENCE ON E-BUSINESS (ICEB), 2., 2002, Taipei. Proceedings... Beijing: Iceb, p. 353-358, 2002.
ROBEYNS, Ingrid. The capability approach: a theoretical survey. Journal of Human Development, v. 6, n. 1, p. 93-117, 2005.
SEN, Amartya K. Desenvolvimento como liberdade. São Paulo: Companhia das Letras, 2000.
SIJTSMA, Klaas. On the use, the misuse, and the very limited usefulness of Cronbach’s Alpha.
Psychometrika, v. 74, n. 1, p. 107-120, 2009.
VAN DEURSEN, Alexander J. A. M.; HELSPER, Ellen J. The third-level of digital divide: who benefits most from being online?. Emerald Studies in Media Communication, v. 10, p. 29-52, 2015.
VAN DIJK, Jan A. G. M.; PETERS, Oscar; EBBERS, Wolfgang. Explaining the acceptance and use of government internet services: a multivariate analysis of 2006 survey data in the Netherlands. Government Information Quarterly, v. 25, n. 3, p. 379-399, 2008.
VAZ, José C. O acesso à tecnologia como objeto de política pública: direitos, democracia, desenvolvimento e soberania nacional. In: NÚCLEO DE INFORMAÇÃO E COORDENAÇÃO DO
PONTO BR (Ed.). Pesquisa sobre o Uso das
Tecnologias da Informação e Comunicação nos domicílios brasileiros. São Paulo: CGI, 2016. p. 55-64.
VENKATESH, Viswanath et al. User acceptance of information technology: toward a unified view. MIS Quarterly, v. 27, n. 3, p. 425-478, 2003.
ZHENG, Yueping. Explaining citizens’ e-participation usage: functionality of e-participation applications.
Administration and Society, v. 49, n. 3, p. 423-442, 2017.
Marcelo Henrique de Araujo
PhD Candidate in Business Administration in the School of Economics, Business and Accounting at the Uni-versity of São Paulo (FEA-USP). E-mail: [email protected].
Nicolau Reinhard
PhD in Business Administration and a Senior Professor in the School of Economics, Business and Accounting at the University of São Paulo (FEA-USP). E-mail: [email protected].
Maria Alexandra Cunha