Acta Scientiarum
http://periodicos.uem.br/ojs/acta ISSN on-line: 1807-8621 Doi: 10.4025/actasciagron.v41i1.39594
SOILS
Spatial variability of soil physical-hydric attributes under
bovine trampling in agreste of Pernambuco State, Brazil
Pedro Henrique Dias Batista1* , Gledson Luiz Pontes de Almeida2 , Héliton Pandorfi2 , Uilka Elisa
Tavares1 , Airon Aparecido Silva de Melo3 and Cristiane Guiselini2
1Programa de Pós-Graduação em Engenharia Agrícola, Universidade Federal Rural de Pernambuco, Rua Manuel de Medeiros, s/n, 52171-900, Dois Irmãos, Recife, Pernambuco, Brazil. 2Departamento de Engenharia Agrícola, Universidade Federal Rural de Pernambuco, Recife, Pernambuco, Brazil.
3Departamento de Ciência Animal, Universidade Federal Rural de Pernambuco, Garanhuns, Pernambuco, Brazil. *Author for correspondence. E-mail: [email protected]
ABSTRACT. Soils under pastures suffer physical modifications, in greater or lesser intensity, via the action of animal trampling. Thus, the aim was to evaluate the spatial dependence of soil physical attributes under bovine trampling. The trial was performed at Roçadinho Farm, Agreste of Pernambuco, Brazil, in a 40 x 40 m paddock that was managed with continuous stocking by bovines and 12 AU ha-1 stocking rate. Soil samples were collected before and after grazing using a 6 x 6 m grid, totaling 36 sampling points. At each point, the bulk density, total porosity, moisture, soil penetration resistance at 0.00 - 0.10, 0.10 - 0.20, and 0.20 - 0.30 m depth were estimated, as was the hydraulic conductivity on the saturated soil surface. Descriptive statistics and geostatistics supported the data analysis. A normal distribution was verified for all variables, which were scored as either low or high variability in terms of the variation coefficient. The physical attributes (density, total porosity, moisture, soil penetration resistance and hydraulic conductivity) of the soil sampled presented a strong spatial dependence before and after grazing.
Keywords: compaction soil; geostatistic; girolando; grazing; ordinary kriging.
Received on September 20, 2017. Accepted on December 27, 2017.
Introduction
Dairy livestock are of great economic importance for Agreste of Pernambuco State, where pastures occur across most of the region. Thus, research on this topic is of fundamental importance in supporting decisions by farmholders.
Soil diversity and its physical, chemical, biological, mineralogical, and morphological attributes, as well as its relief, stony characteristic, and climate, cause soils to respond differently to management, machine traffic, and animal trampling (Magliano, Fernández, Florio, Murray, & Jobbágy, 2017).
Soil under grazing suffers physical modifications in greater or lesser intensity via the action of animal trampling (Rauberet al., 2018; Spera, Santos, Fontaneli, & Tomm, 2010). Different soil attributes have been used to characterize the physical changes caused by compaction due to animal trampling or even due to different pastureland management practices. The physical parameters that are commonly used to characterize soil under pasture include bulk density, porosity (Cardoso, Wanderley, & Souza, 2016; Carvalho, Ruiz, Costa, Passos, & Araújo, 2014), soil penetration resistance (Cubillos et al., 2016; Redin et al., 2017), and soil-water infiltration (Cullotta et al., 2016; Suárez, Navarro, Campos, Flores, & Mejía, 2018).
Compaction refers to the initial stage, type, and water content present in soil (Costa et al., 2012; Pilon et al., 2017; Stavi, Shuker, Barkai, Knoll, & Zaady 2018). Thus, the compaction caused by animal grazing changes physical attributes through the repetitive and cumulative effects of trampling on soil (Capurro, Secco, Reichert, & Reinert, 2014). For this reason, porosity and the amount of water infiltration tend to decrease as the soil density and penetration resistance increases (Frolla, Aparicio, Costa, & Krüger, 2018). Thus, compacted soil can restrict plant root development (Ortigara et al., 2014) and diminish water infiltration (Miguel, Vieira, & Grego 2009). Consequently, pasture productivity is reduced (Bonetti, Paulino, Souza, Carneiro, & Silva, 2015).
can represent the soil hydraulic conductivity, which becomes constant after a determined time (Di Prima et al., 2018; Nascimento, Almeida, Batista, & Coutinho, 2017).
The quantitative and qualitative characteristics of soil physical attributes in pastures as well as their spatial variability can be precisely realized by geostatistical analysis, which is an important tool in decision making processes and can support adjustments in soil management and pasture conservation (Bernardiet al., 2016; Wang & Shao, 2013).
Continuous stocking by bovines can modify soil physical structure in the long-term. Thus, we aimed to evaluate the spatial dependence of penetration resistance, moisture, bulk density, porosity, and hydraulic conductivity of soil under pasture in Agreste of Pernambuco State.
Material and methods
The trial was performed over 21 days on a commerce property of dairy cows at Roçadinho Farm at Capoeiras, located at Vale do Ipojuca microregion, Agreste meso-region of Pernambuco State, Brazil, 8° 36’S latitude and 36° 37’W longitude. Soil was classified as Planossol according to Agroecological Mapping of Pernambuco – Zape Digital (2001). Soil characterization was performed at the Laboratory of Soil Mechanical and Residues recovering at Federal University Rural of Pernambuco (Table 1), according to the methods described by the Brazilian Agricultural Research Corporation [EMBRAPA] (2011).
Table 1. Soil characteristics.
¹Dp (kg dm-3) ²OM (g kg-1) Sand (g kg-1) Silt (g kg-1) Clay (g kg-1) Textural Class
2.64 39.57 817.22 178.78 4.00 Loam Sand
¹Density of particle; ²Organic Matter.
The experimental area was 40 x 40 m, wherein a 6 x 6 m grid was used, resulting in 36 sampling points, with a 5-m border and a 8 x 10 m rest area for animals attached to the pasture that contained water and 16 m2 of shade (Figure 1). The soil was prepared with a harrow plow prior to planting, and fertilizer was not applied because the area had no declivity. The management system was continuous stocking in soil under pasture composed of Brachiaria decumbens, a drought-resistant crop plants. Grazing was performed by three girolando heifers, each with a 300 kg body weight. The grazing period started when the canopy had a 90-cm height and ended when it had a 20-cm height, as suggested by Fidalski and Alves (2015).
Figure 1. Sketch of trial pasture: sampling points ( ), rest and shade area for animal relief ( ).
For each sampling point, the penetration, moisture, bulk density, total porosity and particles density of soil at 0.0 - 0.10, 0.10 - 0.20, and 0.20 - 0.30 m depth, and hydraulic conductivity on saturated soil surface were measured. Sample collection was performed prior to and after grazing. For an undisturbed soil sample, an Uhland sampler was used.
the soil dried mass kept at 105°C and using an extraction ring of known volume. Total porosity (TP) was calculated by the correlation between BD and Dp (EMBRAPA, 2011).
To measure soil penetration resistance (PR) a penetrometer of reduced impact was used (model IAA/Planalsucar/Stolf), with number of impacts dm-1 transformed to dynamic resistance (MPa) according to Equation 1 proposed by Stolf (1991).
(1)
where:
PR – Soil penetration resistance, kgf cm-2 (kgf cm-2 × 0.098 = MPa); M - Mass of piston, 1.6 kg;
m - Mass of machine without piston, 1.5 kg; h - Height of piston fall, 54 cm;
X – Penetration of machine stick, cm by impact; A - Area of cone, 1.35 cm².
The soil-water surface infiltration was characterized using the Beerkan method, which is based mainly on simplified infiltration assays and analyzing the soil particle size distribution (Di Prima, Lassabatere, Bagarello, Iovino & Angulo-Jaramillo, 2016). A PVC ring was used with a 150 mm diameter, 15 volumes of 150 mL water, and a chronometer. In the grazing area, the ring was inserted in the soil at a 1-cm depth to avoid lateral losses of water during the process. The water volumes were consecutively spilt in the cylinder, where another volume was spilt after every emptying. The time required for every volume to infiltrate into the soil was recorded, and the process was stopped when the infiltration velocity became constant or after 15° of volume emptying. Hydraulic conductivity was estimated as described by Bagarello, Di Prima, Iovino, and Provenzano (2014) in Equation 2. According to the authors, this methodology should be applied only for soil surfaces.
b
. 67 . r (2)
where:
K0– Hydraulic conductivity in saturated soil, mm s-1;
b – Slope of an equation linearized in function of cumulative infiltration over time; r – Ring radius, 75 mm;
– adopted 0.012 as suggested by Reynolds, Bowman, Drury, Tan, and Lu (2002), for practices in permeameter and infiltrometer in soil that ranges from thick sand to compacted clay.
Initially, descriptive statistical analyses (minimum, maximum, average, median, standard error, coefficient of variation, asymmetry, and kurtosis) were performed on the soil physical attribute data collected in the field trial. The data normality hypothesis was estimated by Kolmogorov-Smirnov test.
To verify the spatial variability of variables over time, the results were analyzed by geostatistical methods of semivariogram analysis (Vieira, 2000). Spatial autocorrelation among neighbors was estimated by semivariance γ (h), through Equation 3:
i -z i
i (3)
where: N(h) is the number of value pairs Z(xi) and Z(xi + h), separated by the h vector. The γ(h) equation in function h correspondent values, namely, semivariogram, is a function of only the h vector.
The GS+ 7.0 (Gamma Design Software, 2012) adjusted the semivariogram models. The choice of the best model adjusted to semivariogram was based on coefficient of determination (R2). Surfer 9 (Golden Software, 2010) was used to manipulate and observe the spatial distribution through isolines map building for variables with ordinary kriging. Maps scales of RP were constituted according to the levels adapted by Soil Survey Staff (2017), where low: RP < 0.1 MPa; moderate: 0.1 - 2.0 MPa; high: 2.0 - 4.0 MPa; very high: 4.0 - 8.0 MPa; and extremely high: RP > 8.0 MPa.
Variability of parameters was estimated using the coefficient of variation as reported by Warrick and Nielsen (1980), where: CV < %, ≤ CV < 6 %, and CV ≥ 6 % represented low, moderate, and ig
variability attributes, respectively.
Results and discussion
The results for descriptive statistics before and after grazing showed similarity for the average and median, which indicated a symmetric distribution; the measures of central tendency were dominated by typical values in the distribution (Tables 2 and 3). According to the Kolmogorov-Smirnov test, all variables had normal distribution, with coefficients of asymmetry and kurtosis similar or equal to zero (Cunha et al., 2017).
The coefficient of variation (Table 2) revealed low variability for soil bulk density (BD) at all depths and total porosity (TP) at a 0.0 - 0.1 m depth, similar to the results of Ribeiro et al. (2016), who observed the spatial variability of cohesive soil physical attributes submitted to conventional management and direct seeding methods. Penetration resistance (PR) for 0.1 - 0.2 m and 0.2 - 0.3 m depth, gravimetric moisture (GM) for all depths, TP for 0.1 - 0.2 m and 0.2 - 0.3 m depth, and hydraulic conductivity (K0) all had moderate variability. The PR for 0.0 - 0.1 m showed high variability, as also reported by Mion et al. (2012), who analyzed the spatial variability of the physical attributes in a yellow argisol under alternate sheep grazing; those authors attributed their results to high variability of the average, showing a distribution with high heterogeneity of data.
Table 2. Descriptive statistic parameters of soil physical-hydric attributes at 0 - 0.1, 0.1 - 0.2 and 0.2 - 0.3 m depth, before grazing.
Variables 1MIN 2MAX Average Median 3SE 4CV 5A 6K 7D
0.00 – 0.10 (m)
PR (MPa) 0.55 3.46 1.31 0.87 0.89 68.30 1.24 0.09 0.22*
GM (%) 6.79 17.53 13.43 14.06 2.90 21.70 -0.29 -0.95 0.10*
BD (kg dm-3) 1.49 1.85 1.65 1.64 0.08 4.80 0.21 -0.40 0.09*
TP (%) 32.85 42.71 37.476 37.95 2.67 7.10 -0.07 -0.84 0.10*
0.10 – 0.20 (m)
PR (MPa) 0.87 7.67 3.81 3.46 2.03 53.40 0.30 -0.97 0.12*
GM (%) 4.93 15.94 10.39 11.03 3.33 32.00 0.02 -1.15 0.06*
BD (kg dm-3) 1.41 1.87 1.67 1.70 0.13 8.10 -0.38 0.89 0.08*
TP (%) 29.22 46.90 37.00 37.04 5.31 14.40 0.26 -1.03 0.06*
0.20 – 0.30 (m)
PR (MPa) 3.46 10.58 6.40 6.39 2.61 40.80 0.14 -0.10 0.19*
GM (%) 5.59 14.09 9.55 9.54 1.90 19.90 0.43 0.18 0.13*
BD (kg dm-3) 1.31 1.94 1.61 1.65 0.16 10.50 -0.07 -1.06 0.18*
TP (%) 29.79 52.48 39.51 38.62 6.10 15.40 0.34 -0.88 0.17*
Hydraulic conductivity in saturated soil surface
K0 (mm s-1) 0.007 0.04 0.02 0.02 0.01 44.70 0.77 0.15 0.20*
PR: Penetration Resistance; GM: Gravimetric Moisture; BD: Bulk Density; TP: Total Porosity; K0: Hydraulic Conductivity of soil.¹MIN: Minimum; ²MAX: Maximum; ³SE: Standard Error; 4CV: Coefficient of Variation; 5A: Asymmetry; 6K: Kurtosis; 7D: Normality by K-S *Significant at 5%.
After grazing, BD and TP had low variability for all depths sampled, which was also found by Guimarães, Junior, Marques, Santos, and Fernandes (2016), who evaluated the spatial variability of soil physical attributes in latosol, argisol, and cambisol pastures and reported that their results were due to bovines having preferred spots in a pasture, which can promote greater soil heterogeneity. The PR, GM, and K0 showed moderate variability (Table 3). In a study performed in Agreste of Pernambuco State by Tavares et al. (2014), the coefficient of variation was low for GM and moderate for PR. According to Santos et al. (2012), low variability shows lower attribute heterogeneity for the experimental area sampled, whereas moderate variability occurs due to soil use and management associated with machines and their implements as well as geomorphological processes, which provide greater homogenization of sand and clay. High variability indicates large soil heterogeneity in the field trial sampled.
A small increment in soil moisture was observed after grazing due to precipitation that occurred prior to sample collection.
The BD had an average of 1.6 kg dm-3. According to Reichert, Reinert, and Braida (2003), a density values of 1.65 kg dm-3 in sandy soils indicates a high probability of root growth restriction. In conventional grazing over 10 years, Guimarães et al. (2016) reported 1.27 kg dm-3 BD. The BD increase, which occurred mainly at the shallowest depths, can be related to high-intensity bovine trampling and, consequently, pasture degradation. As reported by Cecagno et al. (2016), BD is normally modified by bovine trampling and soil degradation, mostly at 0.0 - 0.1 m depth.
Table 3. Descriptive statistic parameters of soil physical-hydric attributes at 0 - 0.1, 0.1 - 0.2 and 0.2 - 0.3 m depth, after grazing.
VARIABLES 1MIN 2MAX Average Median 3SE 4CV 5A 6K 7D
0.00 – 0.10 (m)
PR (MPa) 0.87 6.05 2.35 2.16 1.23 52.40 0.97 0.03 0.10*
GM (%) 7.60 22.03 15.48 16.28 3.31 21.40 -0.46 -0.17 0.14*
BD (kg dm-3) 1.55 1.78 1.66 1.67 0.06 3.90 -0.12 -0.97 0.08*
TP (%) 32.51 39.86 36.37 36.34 2.15 5.90 -0.07 -0.77 0.08*
0.10 – 0.20 (m)
PR (MPa) 2.16 9.93 5.92 5.24 2.58 43.60 0.95 -0.16 0.14*
GM (%) 5.22 17.82 10.89 10.64 3.00 27.60 0.32 0.41 0.07*
BD (kg dm-3) 1.51 1.89 1.72 1.74 0.09 5.30 -0.63 -0.12 0.05*
TP (%) 28.23 43.57 34.91 34.30 3.57 10.20 0.66 0.08 0.16*
0.20 – 0.30 (m)
PR (MPa) 5.08 11.55 8.29 8.31 1.82 22.00 0.21 -0.76 0.22*
GM (%) 9.00 17.03 13.02 13.12 1.90 14.70 -0.31 0.24 0.07*
BD (kg dm-3) 1.36 1.90 1.63 1.63 0.12 7.80 0.09 -0.51 0.09*
TP (%) 28.21 45.29 37.87 37.04 4.69 11.90 -0.27 -0.95 0.10*
Hydraulic conductivity in saturated soil surface
K0 (MM S-1) 0.004 0.02 0.01 0.01 0.003 33.50 0.27 -0.25 0.05*
PR: Penetration Resistance; GM: Gravimetric Moisture; BD: Bulk Density; TP: Total Porosity; K0: Hydraulic Conductivity of soil.¹MIN: Minimum; ²MAX: Maximum; ³SE: Standard Error; 4CV: Coefficient of Variation; 5A: Asymmetry; 6K: Kurtosis; 7D: Normality by K-S *Significant at 5%.
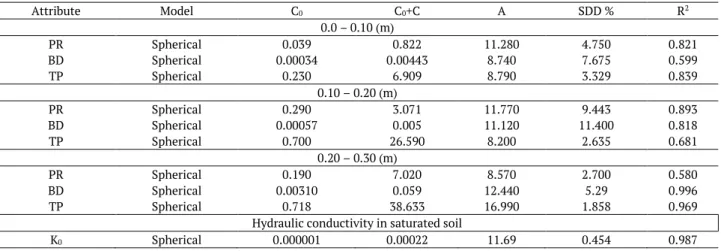
Table 4. Parameters of semivariograms models and spatial dependence degree (SDD) prior to grazing time.
Attribute Model C0 C0+C A SDD % R2
0.0 – 0.10 (m)
PR Spherical 0.039 0.822 11.280 4.750 0.821
BD Spherical 0.00034 0.00443 8.740 7.675 0.599
TP Spherical 0.230 6.909 8.790 3.329 0.839
0.10 – 0.20 (m)
PR Spherical 0.290 3.071 11.770 9.443 0.893
BD Spherical 0.00057 0.005 11.120 11.400 0.818
TP Spherical 0.700 26.590 8.200 2.635 0.681
0.20 – 0.30 (m)
PR Spherical 0.190 7.020 8.570 2.700 0.580
BD Spherical 0.00310 0.059 12.440 5.29 0.996
TP Spherical 0.718 38.633 16.990 1.858 0.969
Hydraulic conductivity in saturated soil
K0 Spherical 0.000001 0.00022 11.69 0.454 0.987
C0: Nugget Effect; C0+C: Threshold; A: Reach; SDD: Spatial Dependence Degree (%); R²: Semivariogram Adjustment.
The TP and K0 average declined 2.93 and 5.65, 4.16 and 50.00%, respectively, after grazing; the decline in these factors can be explained by increases in PR and GM. The TP results observed in our study were similar to those of Lanzanova et al. (2007), who estimated the total porosity in soil under grazing (4 UA ha-1) and reported that TP was reduced 18% at 0.0 - 0.05 m and 7% at 0.05 - 0.10 m after 14 days of grazing. The authors attributed this reduction to the pressure of animals on the soil. Likewise, Oliveira Júnior et al. (2014) observed the hydrodynamic attributes in Regolithic neosol under pasture and “caatinga” and reported average K0 values of 0.063 mm s-1 for pasture and 0.125 mm s-1 for caatinga; however, soil management under pasture significantly changed the saturated hydraulic conductivity that was affected by animal trampling.
By geostatistical analysis through semivariograms, TP had no spatial dependence at depths of 0.1–0.2 and 0.2–0.3 m after grazing (Table 5). Thus, the variability of this variable can be considered aleatory, and lower spacing will be necessary for sample collection to detect spatial dependence, as suggested by Cambardella et al. (1994). Likewise, Guimarães et al. (2016) reported a pure nugget effect for TP at 0.10 and 0.15 m after applying 10 x 10 m spacing to estimate the spatial dependence of the physical attributes of soil under pasture. The spatial dependence degree (SDD) was classified as strong for other variables analyzed. The SDD results were similar to those of Soares et al. (2015), who observed the spatial dependence of soil physical attributes under pasture.
Table 5. Parameters of semivariogram models and spatial dependence degree (SDD) after grazing.
Attribute model C0 C0+C A SDD % R2
0.0 – 0.10 (m)
PR Spherical 0.276 1.805 9.560 15.300 0.904
BD Spherical 0.00004 0.002 8.950 2.000 0.998
TP Spherical 0.112 2.371 11.180 4.728 0.890
0.10 – 0.20 (m)
PR Spherical 0.010 7.625 13.920 0.131 0.984
BD Spherical 0.00009 0.003 8.720 3.000 0.523
TP PNE - - - - -
0.20 – 0.30 (m)
PR Spherical 0.163 3.079 12.140 5.300 0.967
BD Spherical 0.00001 0.016 8.270 0.062 0.937
TP PNE - - - - -
HYDRAULIC CONDUCTIVITY IN SATURATED SOIL
K0 Spherical 0.000001 0.00001 9.560 10.000 0.934
C0: Nugget Effect; C0+C: Threshold; A: Reach; SDD: Spatial Dependence Degree (%); R²: Semivariogram Adjustment; PNE: Pure Nugget Effect.
Kriging maps (Figure 2) allowed verification of the result that PR increased by 79.40, 55.40, and 29.50% at 0.0 - 0.1, 0.1 - 0.2, 0.2 - 0.3 m depth, respectively, after grazing. These results are similar to observed by Lanzanova et al. (2007), who evaluated the physical attributes of soil under grazing (4 AU ha-1) and noticed an increase of 57% PR at 0.05 - 0.08 m after 14 days of grazing. Costa et al. (2012) reported a higher PR under different stocking rates (1.26, 5.57, 7.45, and 8.23 AU ha-1) and at 0.2 - 0.3 and 0.3 - 0.4 m depth, with greater grazing intensity, in sandy-loam soil.
Modification of spatial variability of PR before and after grazing can be explained by the fact that animals that are managed under continuous grazing stay in the same paddock without rest time. Additionally, clumped grass growth can promote bare soil with greater impact of animal hoof pressure. Consequently, there is a greater tendency for compaction, which was confirmed after grazing due to greater penetration resistance (Fernández, Alvarez, & Taboada, 2015).
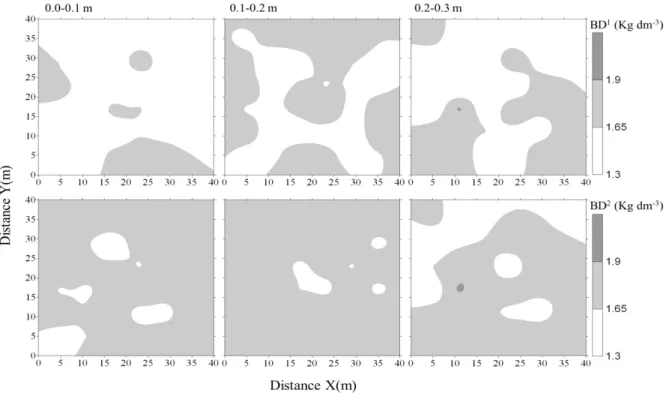
The threshold for BD suggested by Reichert et al. (2003) is 1.65 kg dm-3. This value was surpassed across a large portion of the sampling area, mainly at 0.0 - 0.1 and 0.1 - 0.2 m depth after grazing. Likewise, Lima, Silvino, Melo, Lira, and Ribeiro (2015) studied a pasture with continuous grazing at Brejo of Paraíba and reported an average BD of 1.6 and 1.5 kg dm-3 at 0.0 – 0.10 and 0.10 – 0.20 m, respectively. According to Costa et al. (2012), the BD can be affected by animal trampling, especially at depths of 0.0 – 0.10 and 0.10 – 0.20 m.
In pastures with bovine rotational stocking and a 12 AU ha-1 stocking rate, Ortigara et al. (2014) reported that animal trampling changed the soil structure by increasing the BD and PR and decreasing the porous space. Thus, these findings are similar to those of our study.
In contrast to the literature, Bonetti et al. (2015) studied the soil physical attributes and soy bean productivity of a pasture managed with different stocking rates (1.5, 2.5, and 3.5 AU ha-1) and canopy heights (0.25, 0.35, and 0.45 m) in a dystroferric Red latosol. The authors reported that after 120 grazing days, the soil physical attributes had small changes that were maintained near the threshold considered normal. Furthermore, the authors reported that a low stocking rate and soil moisture could have contributed to fewer impacts of animal trampling.
The TP and K0 decreased as PR and BD increased (Figures 2, 3, 4, and 5), the results similar to findings of Guimarães et al. (2016). According to Mion et al. (2012), TP shows a strong correlation with PR, which tends to increase as TP is reduced. The increase of PR and BD and the decrease in TP are responsible for the decrease in K0 and, therefore, for increased water runoff from rain or irrigation, which exacerbates the erosion process (Stefanoski, Santos, Marchão, Petter, & Pacheco, 2013).
Iglesias, Galantini, Krüger, and Venanzi (2014) also observed similar results when they evaluated TP distribution in areas with bovine trampling and different plant systems. The authors reported that trampling by animals reduced TP, mainly at a depth of 0.0 - 0.1 m.
Figure 3. Kriging maps of BD¹ (kg dm-3) before grazing time and BD² (kg dm-3) after grazing time.
The K0 was markedly reduced after grazing time, mainly due to the increased BD and PR, with a reduction in porosity. Likewise, Miguel et al. (2009) evaluated soil water infiltration as a function of trampling intensity at an alternate stocking rate (6 AU ha-1) and reported a reduction of 70% for K
0 after the fifteenth grazing period through paddocks (Figure 5).
An evaluation of the compaction of the soil surface caused by 120 bovines grazing in a 100 x 70 m pastureland during three weeks by Tuffour, Bonsu, and Khalid (2014) found that grazing at any intensity affected the soil water infiltration because the animal hoof pressure greatly reduced the porous space of soil, which supported our results.
not affect the soil physical quality in continuous or alternate stocking systems, as long as the stocking rate and forage mass are controlled (Fidalski et al., 2008). Adopting good management and maintaining the pasture can be a solution for those problems.
Figure 4. Kriging maps of TP¹ (%) before grazing and TP² (%) after grazing.
Figure 5. Kriging maps of K0¹ (mm s-1) before grazing and K0² (mm s-1) after grazing.
Conclusion
Penetration resistance, moisture, bulk density, and hydraulic conductivity of the soil had a strong spatial dependence before and after grazing.
Soil physical attributes were modified after grazing, which increased the penetration resistance and bulk density and reduced the hydraulic conductivity and total porosity.
References
Bernardi, A. D. C., Bettiol, G. M., Ferreira, R. D. P., Santos, K. E. L., Rabello, L. M., & Inamasu, R. Y. (2016). Spatial variability of soil properties and yield of a grazed alfalfa pasture in Brazil. Precision Agriculture, 17(6), 737-752. DOI: 10.1007/s11119-016-9446-9
Bonetti, J. D. A., Paulino, H. B., Souza, E. D. D., Carneiro, M. A. C., & Silva, G. N. D. (2015). Influence of the integrated crop-livestock system on soil and soybean and brachiaria yield. Pesquisa Agropecuária Tropical, 45(1), 104-112. DOI: 10.1590/1983-40632015v4529625
Cambardella, C. A., Moorman, T. B., Parkin, T. B., Karlen, D. L., Novak, J. M., Turco, R. F., & Konopka, A. E. (1994). Field-scale variability of soil properties in central Iowa soils. Soil Science Society of America Journal, 58(5), 1501-1511. DOI: 10.2136/sssaj1994.03615995005800050033x
Capurro, E. P. G., Secco, D., Reichert, J. M., & Reinert, D. J. (2014). Compressibility and elasticity of a Vertissol affected by the intensity of grazing cattle. Ciência Rural, 44(2), 283-288. DOI: 10.1590/S0103-84782014000200014
Cardoso, G. G. D. G., Wanderley, R. C., & Souza, M. L. (2016). Physical attributes of a pasture soil in southeast Goiás determined by geostatistics. Engenharia Agrícola, 36(1), 143-151. DOI: 10.1590/1809-4430-Eng.Agric.v36n1p143-151/2016
Carvalho, M. A., Ruiz, H. A., Costa, L. M., Passos, R. R., & Araújo, C. A. S. (2014). Particle size distribution, density and porosity of aggregates in an Oxisol under two vegetal covers. Revista Brasileira de Engenharia Agricola e Ambiental, 18(10), 1010–1016. DOI: 0.1590/1807-1929/agriambi.v18n10p1010-1016
Cecagno, D., Andrade, S. E. V. G. d., Anghinoni, I., Kunrath, T. R., Martins, A. P., Reichert, J. M., ... & de Faccio Carvalho, P. C. (2016). Least limiting water range and soybean yield in a long-term, no-till,
integrated crop-livestock system under different grazing intensities. Soil and Tillage Research, 156, 54-62. DOI: 10.1016/j.still.2015.10.005
Costa, M. A. T., Tormena, C. A., Lugão, S. M. B., Fidalski, J., Nascimento, W. G., & Medeiros, F. M. (2012). Soil resistance to penetration and forage and root production at different grazing intensities. Revista Brasileira de Ciência do Solo, 36(3), 993-1004. DOI: 10.1590/S0100-06832012000300029
Cubillos, A. M., Vallejo, V. E., Arbeli, Z., Terán, W., Dick, R. P., Molina, C. H., ... & Roldan, F. (2016). Effect of the conversion of conventional pasture to intensive silvopastoral systems on edaphic bacterial and ammonia oxidizer communities in Colombia. European Journal of Soil Biology, 72, 42-50. DOI:
10.1016/j.ejsobi.2015.12.003
Cullotta, S., Bagarello, V., Baiamonte, G., Gugliuzza, G., Iovino, M., La Mela Veca, D. S., & Sferlazza, S. (2016). Comparing different methods to determine soil physical quality in a mediterranean forest and pasture land. Soil Science Society of America Journal, 80(4), 1038-1056. DOI: 10.2136/sssaj2015.12.0447 Cunha, J. M., Gaio, D. C., Campos, M. C. C., Soares, M. D. R., Silva, D. M. P., & Lima, A. F. L. (2017). Physical
attributes and carbon stock of soils of Archaeological Dark Earth of the Amazonia. Revista Ambiente & Água, 12(2), 263-281. DOI: 10.4136/ambi-agua.1890
Di Prima, S., Concialdi, P., Lassabatere, L., Angulo-Jaramillo, R., Pirastru, M., Cerda, A., & Keesstra, S. (2018). Laboratory testing of Beerkan infiltration experiments for assessing the role of soil sealing on water infiltration. Catena, 167, 373-384. DOI: 10.1016/j.catena.2018.05.013
Di Prima, S., Lassabatère, L., Bagarello, V., Iovino, M., & Angulo-Jaramillo, R. (2016). Testing a new automated single ring infiltrometer for Beerkan infiltration experiments. Geoderma, 262, 20-34. DOI: 10.1016/j.geoderma.2015.08.006
Empresa Brasileira de Pesquisa Agropecuária [EMBRAPA]. (2011). Manual de métodos e análise de solo (2a ed). Rio de Janeiro, RJ: Centro Nacional de Pesquisa de Solos.
Fernández, P. L., Alvarez, C. R., & Taboada, M. A. (2015). Topsoil compaction and recovery in integrated no-tilled crop–livestock systems of Argentina. Soil and Tillage Research, 153, 86-94. DOI:
10.1016/j.still.2015.05.008
Fidalski, J., & Alves, S. J. (2015). Grazing height of brachiaria and stocking rate limited by soil physical properties three years into an integrated soybean crop-livestock system. Revista Brasileira de Ciência do Solo, 39(3). DOI: 10.1590/01000683rbcs20140667
Frolla, F., Aparicio, V., Costa, J. L., & Krüger, H. (2018). Soil physical properties under different cattle stocking rates on Mollisols in the Buenos Aires Province, Argentina. Geoderma Regional, 14, e00177. DOI: 10.1016/j.geodrs.2018.e00177
Gamma Design Software. [GS+] (2012). Geostatistics for the environmental sciences. Plainwell, US: Gamma Design Software.
Golden Software (2010). Surfer for windows version 9.0. Colorado, US: Golden.
Guimarães, W. D., Junior, J. G., Marques, E. A., Santos, N. T., & Fernandes, R. B. (2016). Spatial variability of the physical attributes of soil under pasture. Revista Ciência Agronômica, 47(2), 247. DOI: 10.5935/1806-6690.20160029
Iglesias, J. O., Galantini, J. A., Krüger, H., & Venanzi, S. (2014). Soil pore distribution as affected by cattle trampling under no-till and reduced-till systems. Agriscientia, 31(2), 93-102. DOI:
10.31047/1668.298x.v31.n2.16536
Lanzanova, M. E., Silveira Nicoloso, R. D., Lovato, T., Eltz, F. L. F., Amado, T. J. C., & Reinert, D. J. (2007). Soil physical attributes in integrated cattle Raising-crop production system under no-tillage. Revista Brasileira de Ciência do Solo, 31(5), 1131-1140. DOI: 10.1590/S0100-06832007000500028
Lima, F. V. D., Silvino, G. D. S., Melo, R. S. D. S., Lira, E. C., & Ribeiro, T. D. S. (2015). Spatial variability of soil physical properties in the hilly area of degradation process. Revista Caatinga, 28(4), 53-63. DOI: 10.1590/1983-21252015v28n406rc
Magliano, P. N., Fernández, R. J., Florio, E. L., Murray, F., & Jobbágy, E. G. (2017). Soil physical changes after conversion of woodlands to pastures in dry Chaco Rangelands (Argentina). Rangeland Ecology &
Management, 70(2), 225-229. DOI: 10.1016/j.rama.2016.08.003
Miguel, F. R. M., Vieira, S. R., & Grego, C. R. (2009). Spatial variability of water infiltration rate in soil under pasture as a function of cattle trampling intensity. Pesquisa Agropecuária Brasileira, 44(11), 1513-1519. DOI: 10.1590/S0100-204X2009001100020
Mion, R. L., Nascimento, E. M. S., Sales, F. A. L., Silva, S. F., Duarte, J. M. L., & Sousa, B. M. (2012). Spatial variability of total porosity, moisture and soil resistance to penetration of a yellow Ultisol. Semina: Ciências Agrárias, 33(6), 2057-2066. DOI: 10.5433/1679-0359.2012v33n6p2057
Nascimento, V. N., Almeida, G. L. P., Batista, P. H. D., & Coutinho, A. S. (2017). Physical attributes of a dystrophic regolithic neosol under pasture submitted to mechanical forage harvesting or animal grazing. Boletim de Indústria Animal, 74(3), 169-175. DOI: 10.17523/bia.v74n3p169
Oliveira Júnior, J. A., Souza, E. S., Correa, M. M., d. S, L., José, R., Souza, R., & Silva Filho, L. A. (2014).
Spatial variability of ydrodynamic properties of a Regolit ic eosoil under pasture and ‘caatinga’.
Revista Brasileira de Engenharia Agrícola e Ambiental, 18(6), 631-639. DOI: 10.1590/S1415-43662014000600010
Ortigara, C., Koppe, E., Luz, F. B. D., Bertollo, A. M., Kaiser, D. R., & Silva, V. R. D. (2014). Soil use and physical-mechanical properties of a Red Oxisol. Revista Brasileira de Ciência do Solo, 38(2), 619-626. DOI: 10.1590/S0100-06832014000200026
Pilon, C., Moore, P. A., Pote, D. H., Pennington, J. H., Martin, J. W., Brauer, D. K., & Lee, J. (2017). Long-term effects of grazing management and buffer strips on soil erosion from pastures. Journal of Environmental Quality, 46(2), 364-372. DOI: 10.2134/jeq2016.09.0378
Pulido, M., Schnabel, S., Lavado Contador, J. F., Lozano-Parra, J., & González, F. (2018). The impact of heavy grazing on soil quality and pasture production in rangelands of SW Spain. Land Degradation & Development, 29(2), 219-230. DOI: 10.1002/ldr.2501
Rauber, L. P., Andrade, A. P., Friederichs, A., Mafra, Á. L., Baretta, D., Rosa, M. G. D., ... & Correa, J. C. (2018). Soil physical indicators of management systems in traditional agricultural areas under manure application. Scientia Agricola, 75(4), 354-359. DOI: 10.1590/1678-992x-2016-0453
Reichert, J. M., Reinert, D. J., & Braida, J. A. (2003). Qualidade dos solos e sustentabilidade de sistemas agrícolas. Ciência & Ambiente, 14(27), 29-48.
Reynolds, W. D., Bowman, B. T., Drury, C. F., Tan, C. S., & Lu, X. (2002). Indicators of good soil physical quality: density and storage parameters. Geoderma, 110(1), 131-146. DOI: 10.1016/S0016-7061(02)00228-8
Ribeiro, L. S., Oliveira, I. R., Dantas, J. S., Silva, C. V., Silva, G. B., & Azevedo, J. R. (2016). Spatial variability of physical attributes of a cohesive soil under conventional and no-tillage management systems.
Pesquisa Agropecuária Brasileira, 51(9), 1699-1702. DOI: 10.1590/s0100-204x2016000900071
Santos, K. S., Montenegro, A. A., Almeida, B. G. D., Montenegro, S. M., Andrade, T. D. S., & Júnior, F. (2012). Spatial variability of physical attributes of soil in alluvial valley of semiarid region of Pernambuco State. Revista Brasileira de Engenharia Agrícola e Ambiental, 16(8), 828-835. DOI:
10.1590/S1415-43662012000800003
Silveira, D. C., Melo Filho, J. F. D., Sacramento, J. A. A. S. D., & Pinto Silveira, E. C. (2010). Relationship between the soil water content and root penetration resistance of a dystrocohesive yellow argissol. Revista Brasileira de Ciência do Solo, 34(3), 659-667. DOI: 10.1590/S0100-06832010000300007
Soares, M. D. R., Campos, M. C. C., Souza, Z. M., Brito, W. B. M., Franciscon, U., & Castione, G. A. (2015). Spatial variability of soil physical attributes in area of dark archaeological earth in Manicore, AM. Revista de Ciências Agrárias/Amazonian Journal of Agricultural and Environmental Sciences, 58(4), 434-441. DOI: 10.4322/rca.1975
Soil Survey Staff. (2017). Soil survey manual (USDA Handbook 18). Washington, D.C.: Government Printing Office.
Spera, S. T., Santos, H. P., Fontaneli, R. S., & Tomm, G. O. (2010). Soil physical characteristics of an Oxisol as affected by production systems lay farming, under no-tillage. Acta Scientiarum. Agronomy, 32(1), 37-44. DOI: 10.4025/actasciagron.v32i1.92610.4025/actasciagron.v32i1.926
Stavi, I., Shuker, S., Barkai, D., Knoll, Y. M., & Zaady, E. (2018). Effects of livestock grazing on Anemone coronaria L. in drylands: Implications for nature conservation. Geo: Geography and Environment, 5(1), e00053. DOI: 10.1002/geo2.53
Stefanoski, D. C., Santos, G. G., Marchão, R. L., Petter, F. A., & Pacheco, L. P. (2013). Soil use and management and its impact on physical quality. Revista Brasileira de Engenharia Agricola e Ambiental, 17(12), 1301-1309. DOI: 10.1590/S1415-43662013001200008
Stolf, R. (1991). Theory and test of formulas for transforming impact penetrometer data in soil resistance. Revista Brasileira de Ciência do Solo, 15(3), 229-235.
Suaréz, M. P., Flores, M. A. N., Martínez, Á. R. C., Estrada, J. G. F., & Chávez, M. C. M. (2018). Impact of extensive grazing on supporting and regulating ecosystem services of mountain soils. Mountain Research and Development, 38(2), 125-134. DOI: 10.1659/MRD-JOURNAL-D-17-00103
Tavares, U. E., Montenegro, A. A. A., Rolim, M. M., Silva, J. S., Vicente, T. F. V., & Andrade, C. W. L. (2014). Spatial variability of penetration resistance and soil water content in Neossolo Flúvico. Water Resources and Irrigation Management, 3(2), 79-89. DOI: 10.19149/2316-6886/wrim.v3n2p79-89
Torres, J. L. R., Rodrigues Junior, D. J., Sene, G. A., Jaime, D. G., & Vieira, D. M. S. (2012). Penetration resistance in area of pasture tifton influenced by trampling and irrigation. Bioscience Journal, 28(1), 232-239.
Tuffour, H. O., Bonsu, M., & Khalid, A. A. (2014). Assessment of soil degradation due to compaction resulting from cattle grazing using infiltration parameters. International Journal of Scientific Research in Environmental Sciences, 2(4), 139-149. DOI: 10.12983/ijsres-2014-p0139-0149
Vieira, S. R. (2000). Geoestatistica em estudo de variabilidade espacial do solo: In R. F. Novais, V. H. Alvarez V., & C. E. G. R. Schaefer (Ed.), Tópicos em ciência do solo (p. 1-55). Viçosa, MG: Sociedade Brasileira de Ciência do Solo.
Wang, Y. Q., & Shao, M. A. (2013). Spatial variability of soil physical properties in a region of the Loess Plateau of PR China subject to wind and water erosion. Land Degradation & Development, 24(3), 296-304. DOI: 10.1002/ldr.1128
Warrick, A. W., & Nielsen, D. R. (1980) Spatial variability of soil physical properties in the field. In D. Hillel (Ed.), Applications of soil physics (p. 319-344). New York, US: Academic D.