ABSTRACT: Soil electrical conductivity (ECa) is a soil quality indicator associated to attributes interesting to site-specific soil management such as soil moisture and texture. Soil ECa provides information that helps guide soil management decisions, so we performed spatial evaluation of soil moisture in two experimental fields in two consecutive years and modeled its influence on soil ECa. Soil ECa, moisture and clay content were evaluated by statistical, geostatistical and regression analyses. Semivariogram models, adjusted for soil moisture, had strong spatial dependence, but the relationship between soil moisture and soil ECa was obtained only in one of the experimental fields, where soil moisture and clay content range was higher. In this same field, coefficients of determinations between soil moisture and clay content were above 0.70. In the second field, the low soil moisture and clay content range explain the absence of a relation-ship between soil ECa and soil moisture. Data repetition over the years, suggested that ECa is a qualitative indicator in areas with high spatial variability in soil texture.
Keywords: precision agriculture, soil physics, geostatistics, soil sensors Received September 22, 2011
Accepted August 23, 2012
1USP/ESALQ – Depto. de Engenharia de Biossistemas, Av. Pádua Dias, 11 – 13418-900 – Piracicaba, SP – Brasil. 2FATEC Marília, Campus de Pompéia, Av. Shunji Nishimura, 605 – 17580-000 – Pompéia, SP – Brasil.
*Corresponding author <[email protected]>
Edited by: José Euclides Stipp Paterniani
Spatial and temporal variability of soil electrical conductivity related to soil moisture
José Paulo Molin1*, Gustavo Di Chiacchio Faulin2
Introduction
Soil electrical conductivity (ECa) is an effective and rapid indicator of soil variability and production potential (Corwin et al., 2003; Corwin and Lesch, 2005). This is associated to soil attributes interesting to precision agriculture.
Electrical conductivity can be defined as the ability of a material to transmit or conduct electrical current. This is the case of soil, which can conduct an electrical current through electrolytes dissolved in soil solution (water) and through exchangeable cations close to charged particle surfaces and electrically mo-bile at a number of levels. An ECa model developed by Rhoades and Corwin (1990) describes three conduction pathways: (i) between alternate layers of soil particles and soil solution, (ii) through continuum soil solutions, and (iii) through or between soil particle surfaces di-rectly in contact with each other. Therefore, in addi-tion to soil moisture content, ECa is associated to soil salinity, clay content and cation exchange capacity, clay minerals, pore size and distribution, organic matter and temperature (Mcneill, 1992; Sudduth et al., 2001). ECa was also shown to indicate soil texture variability, i.e., ECa is higher in soils with high clay content and lower in soils with high sand content (Machado et al., 2006; Molin and Castro, 2008; Moral et al., 2010; Aimrun et al., 2011). Other authors have investigated the re-lationship between soil moisture and ECa (Sheets and Hendrickx, 1995) and ECa has been used for defining management zones taking water as the limiting factor (Besson et al., 2010).
Commercial devices for rapid ECa determination provide useful information for decision-making in crop management (Siri-Prieto et al., 2006). However, the quality of ECa information on Brazilian soils is poor. This information is important for tropical agricultural soils, especially because they usually have low levels
of dissolved salts. Since ECa, texture and moisture are expected to be correlated, the objective of this study was to perform spatial monitoring of soil moisture in two different experimental fields over two consecutive years and evaluate the influence of moisture on soil ECa. The results provide new insight on the interpre-tation of ECa information for tropical soils and on its relationship with soil moisture.
Materials and Methods
This study was carried out in two experimental fields. Field 1, in Tibagi, state of Paraná (PR), Brazil (24º32’ S 50º21’ W), covers 18.9 ha, with a mean alti-tude of 826 m and predominance of medium-textured Typic Dystrudoxes with moderate A horizon. Field 2, in Campos Novos Paulista, state of São Paulo (SP), Brazil (22º41’ S 49º59’ W), covers 22.2 ha, with a mean alti-tude of 533 m, and predominance of medium-textured Typic Hapludoxes with moderate A horizon, both rep-resentative of two major grain production regions in the South/Southeast of Brazil.
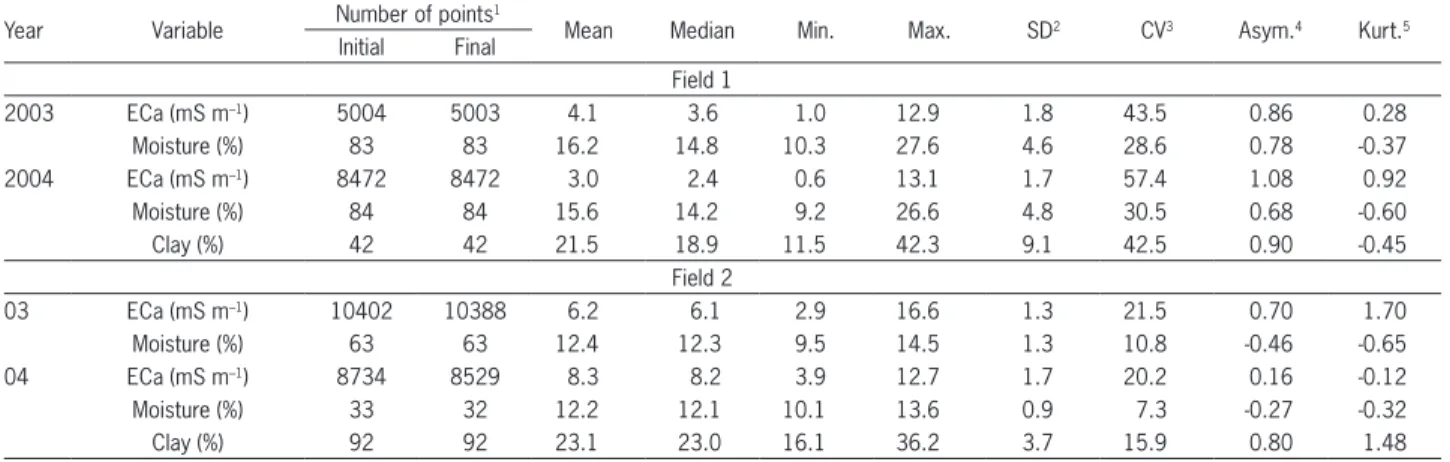
deter-Table 1 – Exploratory statistics for soil electrical conductivity (ECa), moisture and clay content.
Year Variable Number of points
1
Mean Median Min. Max. SD2 CV3 Asym.4 Kurt.5
Initial Final
Field 1
2003 ECa (mS m–1) 5004 5003 4.1 3.6 1.0 12.9 1.8 43.5 0.86 0.28
Moisture (%) 83 83 16.2 14.8 10.3 27.6 4.6 28.6 0.78 -0.37
2004 ECa (mS m–1) 8472 8472 3.0 2.4 0.6 13.1 1.7 57.4 1.08 0.92
Moisture (%) 84 84 15.6 14.2 9.2 26.6 4.8 30.5 0.68 -0.60
Clay (%) 42 42 21.5 18.9 11.5 42.3 9.1 42.5 0.90 -0.45
Field 2
03 ECa (mS m–1) 10402 10388 6.2 6.1 2.9 16.6 1.3 21.5 0.70 1.70
Moisture (%) 63 63 12.4 12.3 9.5 14.5 1.3 10.8 -0.46 -0.65
04 ECa (mS m–1) 8734 8529 8.3 8.2 3.9 12.7 1.7 20.2 0.16 -0.12
Moisture (%) 33 32 12.2 12.1 10.1 13.6 0.9 7.3 -0.27 -0.32
Clay (%) 92 92 23.1 23.0 16.1 36.2 3.7 15.9 0.80 1.48
1Before and after removing the outlier data identified by exploratory analyses; 2standard deviation; 3coefficient of variation; 4asymmetry; 5kurtosis.
mines the thickness of soil this device reads, which can be concentrated approximately at 0.3 m or 0.9 m. In this study, only the shallowest soil portion (0.3 m) was evaluated as the soil on both fields has no substantial vertical stratification and both fields have been farmed under no-till for several years, with few anthropic in-terventions in the soil profile. Field 1 was studied in Oct. 2003 and Jun. 2004, while Field 2 in Oct. 2003 and Oct. 2004.
While the sensor was pulled over the fields, simple soil samples were collected and georeferenced to deter-mine moisture content in the 0.3 m depth using a heli-coidal auger. The samples were kept in aluminum cap-sules, sealed and taken to the laboratory. Samples were weighed, oven dried at 105ºC until mass stabilization and weighed again for gravimetric soil moisture content to be determined. Five sub-samples were collected to determine soil texture, within a 5 m radius of the georef-erenced sampling site, which in turn were positioned in a sampling grid. In Field 1 soil samples were removed at 0-0.2 m depth using a helicoidal auger in 2003; in Field 2, soil samples were available from earlier studies at this site. Bouyoucos’s or densimetric method (Bouyoucos, 1962) was used to determine texture.
Statistica 6.0 software was used for exploratory analyses. We calculated until the fourth-order statisti-cal moment to characterize data behavior. Variability was determined by the coefficient of variation (CV), which was categorized as low (CV < 12 %), moder-ate (12 < CV < 62 %) or high (CV > 62 %) (Warrick and Nielsen, 1980). A second stage of this analysis was performed to validate or not apparently discrep-ant data. This was achieved by combining exploratory analyses with a spatial description of the variable sets obtained. Despite the high quality of statistical analy-ses, they disregard the spatial position of each sample. Spatialization of apparently discrepant ECa results and soil moisture and clay content were performed using a geographic information system (GIS) (SSToolBox 3.4, SST Development Group, Stillwater, OK, USA). If these
values were clustered, they were not considered dis-crepant or excluded from analyses.
Vesper 1.6 software (ACPA, University of Sydney) was used to calculate experimental ECa, soil moisture and clay content semivariograms of both experimental fields. Semivariograms were obtained using a classical Matheron semivariogram estimator and fit to the ex-perimental semivariograms obtained. Those with the best fit in terms of sum of squared residuals (SSR) were selected. The classification proposed by Cambardella et al. (1994) was used to determine the dependence level of the studied attributes. Spatial dependence is there-fore strong in semivariograms with a nugget effect (C0) less than or equal to 25 % of the sill, moderate between 25 % and 75 % and weak above 75 %.
After spatial dependence analyses, we evaluated sites that had not been sampled in order to produce sur-face maps by ordinary block kriging. This was achieved using the Vesper 1.6 software, which generates raster maps with 10 × 10 m pixels. The range of kriged data-set for moisture and clay content corresponded to the spatial continuity of each of these variables. With re-spect to ECa, which had higher sampling density com-pared to the other variables, Vesper 1.6 determined the searching range without researcher interference.
Regression analysis was used to evaluate the in-terdependence of the studied attributes. ECa, moisture and clay content values were interpolated and then re-gressions were performed to obtain the coefficients of determination (R2).
Results and Discussion
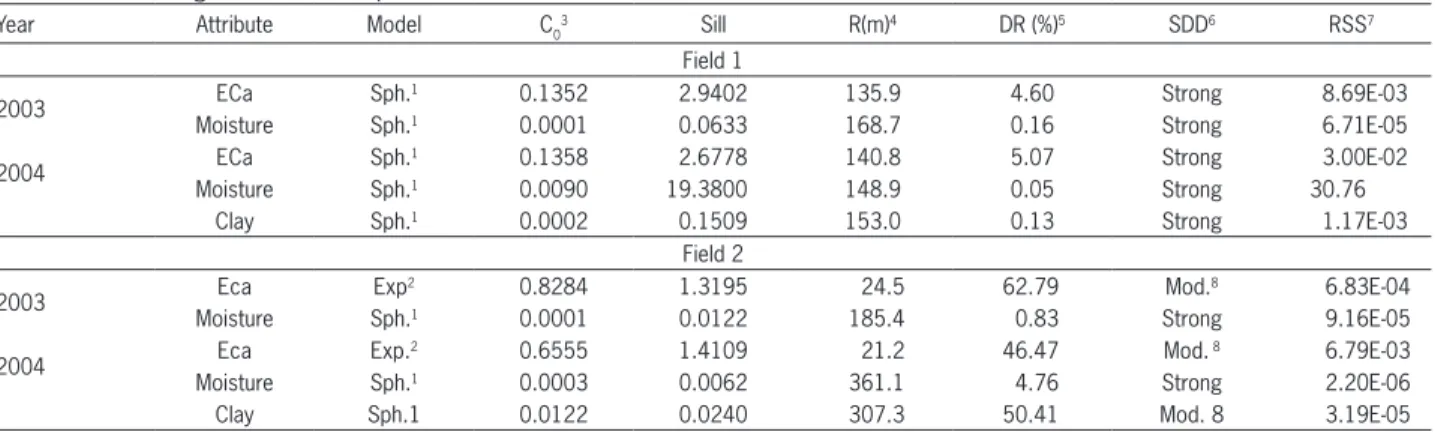
Table 2 – Semivariogram models and parameters fitted to the soil attributes studied.
Year Attribute Model C0
3 Sill R(m)4 DR (%)5 SDD6 RSS7
Field 1
2003 ECa Sph.
1 0.1352 2.9402 135.9 4.60 Strong 8.69E-03
Moisture Sph.1 0.0001 0.0633 168.7 0.16 Strong 6.71E-05
2004 ECa Sph.
1 0.1358 2.6778 140.8 5.07 Strong 3.00E-02
Moisture Sph.1 0.0090 19.3800 148.9 0.05 Strong 30.76
Clay Sph.1 0.0002 0.1509 153.0 0.13 Strong 1.17E-03
Field 2
2003 Eca Exp
2 0.8284 1.3195 24.5 62.79 Mod.8 6.83E-04
Moisture Sph.1 0.0001 0.0122 185.4 0.83 Strong 9.16E-05
2004 Eca Exp.
2 0.6555 1.4109 21.2 46.47 Mod. 8 6.79E-03
Moisture Sph.1 0.0003 0.0062 361.1 4.76 Strong 2.20E-06
Clay Sph.1 0.0122 0.0240 307.3 50.41 Mod. 8 3.19E-05
1 Spherical; 2 exponential; 3 nugget effect; 4 range (m); 5dependence ratio; 6 spatial dependence degree; 7 residual sum of squares; 8 moderate.
Table 3 – Regression analyses between soil electrical conductivity (ECa) and soil moisture and clay levels.
Field Year Moisture level Clay level
R2 F R2 F
ECa
1 2003 0.7725 * 0.7318 *
2004 0.7421 * 0.7158 *
2 2003 0.0386 * 0.0013 *
2004 0.0893 * 0.0000 ns
* F test, significant at p < 0.01; ns = F test, non-significant (p > 0.01). and Nielsen (1980), CVs in Field 1 can be considered
moderate, whereas in Field 2 they were low for mois-ture content and moderate for soil ECa and clay con-tent. Corwin et al. (2003) and Corwin and Lesch (2005) found similar CV values of those from Field 1 (43% and 57% for the first and second year, respectively) in North American soils and considered the CV as a first indicator of the possible relevant spatial variability. At this level of variability, ECa may serve as an indicator of soil quality, and it requires further investigation. Field 2 ECa was similar on both years (around 20%) limited by the lower spatial variability of clay content and, in consequence, by soil moisture. In this case, the scale of the investiga-tion may be affecting the results.
Table 2 shows semivariogram models and param-eters. The attributes were fitted to the spherical model over a two-year period, except for soil ECa in Field 2, which was fitted to the exponential model. Spherical mathematical models prevail in soil science studies (Carvalho et al., 2002). However, Siri-Prieto et al. (2006) and Molin and Castro (2008) fitted soil ECa to exponen-tial models.
According to the spatial dependence degree, the attributes studied had moderate to strong spatial de-pendence (Table 2), showing that their spatial distribu-tion was not randomized (Cambardella et al., 1994). In Field 1, spatial dependence explains 95.4 % of total ECa variation in 2003 and 94.9 % in 2004, with random er-ror caused by a nugget effect of 4.6 % and 5.1 %, re-spectively. In Field 2, random errors in ECa were 62.8 % in 2003 and 46.5 % in 2004. These errors are associ-ated to lower spatial dependence of ECa variation in Field 2 compared to Field 1. The difference is related to the spatial distribution of the dominant factors affect-ing ECa on both fields.
Range can be defined as the maximum distance (ra-dius) allowed for sampling continuous paths for kriging interpolation. ECa range in Field 2 was 24.5 m in 2003 and 21.2 m in 2004, corresponding to 18 % and 15 % of the values obtained in Field 1, respectively. The use of narrow ranges may compromise model predictions due to
the reduced number of interpolation points. Nevertheless, the kriging interpolation used to estimate ECa in Field 2 exhibited good quality for practical purposes because of the high sampling density performed by the equipment used. The results obtained reinforce the higher spatial dis-tribution discontinuity of ECa in Field 2.
Semivariogram model parameters combined with kriging technique estimated attribute values in areas not sampled. The magnitude of the nugget effect is important for kriging because the higher its difference for the semivariogram sill, the higher the phenomenon continuity, the lower the estimation variance, or the higher the estimation confidence. With the maps from kriging (not shown) the regressions were obtained and Table 3 shows R2 values from regression analyses be-tween ECa and soil moisture and clay levels. Significant regressions were observed (F test, p < 0.01) except for clay content in Field 2 in 2004 (F test, p > 0.1). Even though, in a very low rate clay and moisture content had an effect on ECa also on field 2.
An important result was reading repetition over the two years. The fact that ECa reading varied as a function of soil moisture at reading time suggests that it is a good soil quality indicator that is magnified by moisture level, which in turn depends on soil texture, as also indicated by the work of Gebbers et al. (2009) and Aimrun et al. (2011).
In Field 2, R2 was close to zero between ECa and soil moisture and null between ECa and clay con-tent, indicating the weak or even absent relationship between ECa and these variables. The expected attri-bute relationships were not obtained in Field 2, likely because it had lower clay and moisture ranges than Field 1, i.e., lower spatial variability of the attributes, illustrated by lower spatial dependence. The different results indicate that may have a threshold of range for clay and moisture in the soil where ECa can be used to express it and more studies are required to model it with more detail.
The relationships between the attributes were well evidenced in Field 1. In this case, soil ECa can be used to delineate management zones as a function of soil clay content. This was indeed highly related with moisture levels in 2003 (R2 = 0.93, p < 0.0001) and 2004 (R2 = 0.92, p < 0.0001). Field 2 presented the respective R2 values of 0.36 and 0.65 (p < 0.0001). Soil ECa reading depends on soil texture and moisture availability, which are spatially variable attributes that may further affect productivity.
Conclusions
Relationship between moisture and ECa was found only in experimental Field 1, which had a higher soil moisture range. In this same area, the co-efficients of determination between ECa and mois-ture and clay content were higher than 72 %. The expected attribute relationships were not obtained in Field 2, likely because it had lower clay and mois-ture ranges than Field 1 with lower spatial variability of the attributes, illustrated by lower spatial depen-dence. ECa is a qualitative indicator in areas with high spatial variability in soil texture. In Field 2, where soil moisture range was lower, ECa was not associated to moisture levels.
Acknowledgements
This study was sponsored by FAPESP, CNPq and
Fundação ABC and received logistical support from
ex-perimental field owners.
References
Aimrun, W.; Amin, M.S.M.; Nouri, H. 2011. Paddy field zone characterization using apparent electrical conductivity for rice precision farming. International Journal of Agricultural Research 6: 10–28.
Besson, A.; Cousin, I.; Bourennane, H.; Nicollaud, C.; Pasquier, C.; Richard, G. 2010. The spatial and temporal organization of soil water at the field scale as described by electrical resistivity measurements. European Journal of Soil Science 61: 120–132.
Bouyoucos , G. J. 1962. Hydrometer method improved for making particle size analysis of soils. Agronomy Journal 54:464-465.
Cambardella, C.A.; Moorman, T.B.; Novark, J.M.; Parkin, T.B.; Karlen, D.L.; Turco, R.F.; Konopka, A.E. 1994. Field-scale variability of soil properties in central Iowa soils. Soil Science Society of America Journal 58: 1501–1511.
Carvalho, J.R.P.D.; Silveira, P.M.; Vieira, S.R. 2002. Geostatistics to determine spatial variability of soil chemical properties using different preparation systems. Pesquisa Agropecuária Brasileira 37: 1151–1159 (in Portuguese, with abstract in English).
Corwin, D.L.; Lesch, S.M.; Shouse, P.J.; Soppe, R.; Ayars, J.E. 2003. Identifying soil properties that influence cotton yield using soil sampling directed by apparent soil electrical conductivity. Agronomy Journal 95: 352–364.
Corwin, D.L.; Lesch, S.M. 2005. Characterizing soil spatial variability with apparent soil electrical conductivity. Part II. Case study. Computers and Electronics in Agriculture 46: 135–152.
Johnson, C.K.; Doran, J.;Duke, H.R.; Wienhold, B.J.; Eskridge, K.; Shanahan, J.F. 2001. Field-scale electrical conductivity mapping for delineating soil condition. Soil Science Society of America Journal 65: 1829–1837.
Empresa Brasileira de Pesquisa Agropecuária [Embrapa]. 1997. Sistema Agroindustrial do Leite no Brasil = Dairy Agri-industrial System in Brazil. Embrapa Solos: Rio de Janeiro, RJ, Brazil.
Gebbers, R.; Lück, E.; Dabas, M.; Domsch, H. 2009. Comparison of instruments for geoelectrical soil mapping at the field scale. Near Surface Geophysic 7: 179–190.
Machado, P.L.O.A.; Bernardi, A.C.C.; Valencia, L.I.O.; Molin, J.P.; Gimenez, L.M.; Silva, C.A.; Andrade, A.G.A.; Madari, B.E., Meirelles, M.S.P.M. 2006. Electrical conductivity mapping in relation to clay of a Ferralsol under no tillage system. Pesquisa Agropecuária Brasileira 41: 1023–1031 (in Portuguese, with abstract in English).
Molin, J.P.; Castro, C.N.D. 2008. Establishing management zones using soil electrical conductivity and other soil properties by the fuzzy clustering technique. Scientia Agricola 65: 567–573.
Moral, F.J.; Terrón, J.M.; Marques da Silva, J.R. 2010. Delineation of management zones using mobile measurements of soil apparent electrical conductivity and multivariate
geostatistical techniques. Soil and Tillage Research 106: 335– 343.
Rhoades, J.D.; Corwin, D.L. 1990. Soil electrical conductivity: effects of soil properties and application to soil salinity appraisal. Communications in Soil Science Plant Analysis 21: 837–860.
Siri-Prieto, G.; Reeves, D.W.; Shaw, J.N.; Mitchell, C.C. 2006. World’s oldest cotton experiment: relationships between soil chemical and physical properties and apparent electrical conductivity. Communications in Soil Science Plant Analysis 37: 767–786.
Sudduth, K.A.; Drummond, S.T.; Kitchen, N.R. 2001. Accuracy issues in electromagnetic induction sensing of soil electrical conductivity for precision agriculture. Computers and Electronics in Agriculture 31: 239–264.