Repositório ISCTE-IUL
Deposited in Repositório ISCTE-IUL:
2018-04-23
Deposited version:
Post-print
Peer-review status of attached file:
Peer-reviewed
Citation for published item:
Barreira, A. P., Ramalho, J. J. S., Panagopoulos, T. & Guimarães, M. H. (2017). Factors driving the population growth and decline of Portuguese cities. Growth and Change. 48 (4), 853-868
Further information on publisher's website:
10.1111/grow.12205
Publisher's copyright statement:
This is the peer reviewed version of the following article: Barreira, A. P., Ramalho, J. J. S.,
Panagopoulos, T. & Guimarães, M. H. (2017). Factors driving the population growth and decline of Portuguese cities. Growth and Change. 48 (4), 853-868, which has been published in final form at https://dx.doi.org/10.1111/grow.12205. This article may be used for non-commercial purposes in accordance with the Publisher's Terms and Conditions for self-archiving.
Use policy
Creative Commons CC BY 4.0
The full-text may be used and/or reproduced, and given to third parties in any format or medium, without prior permission or charge, for personal research or study, educational, or not-for-profit purposes provided that:
• a full bibliographic reference is made to the original source • a link is made to the metadata record in the Repository • the full-text is not changed in any way
The full-text must not be sold in any format or medium without the formal permission of the copyright holders.
Serviços de Informação e Documentação, Instituto Universitário de Lisboa (ISCTE-IUL) Av. das Forças Armadas, Edifício II, 1649-026 Lisboa Portugal
Phone: +(351) 217 903 024 | e-mail: administrador.repositorio@iscte-iul.pt https://repositorio.iscte-iul.pt
FACTORS DRIVING THE POPULATION GROWTH AND
DECLINE OF PORTUGUESE CITIES
Ana Paula Barreira1, Joaquim J.S. Ramalho2, Thomas Panagopoulos1, Maria Helena
Guimarães1,3
ABSTRACT Despite the worldwide trend of urbanisation, data reveal that some cities are growing whereas others are losing inhabitants. To assess such dynamics in Portuguese cities, demographic, employment, housing, and climate variables were analysed as possible drivers of population change for the period 1991–2011. Panel data models show that higher shares of employment in the secondary and tertiary sectors, higher maximum temperatures, and a higher proportion of middle-aged vacant houses act as pull factors attracting inhabitants, whereas a higher unemployment rate is a push factor for cities.
1 CIEO – Research Centre for Spatial and Organizational Dynamics, University of Algarve, Portugal; 2 ISCTE-IUL Instituto Universitário de Lisboa, Portugal;
3 Landscape Dynamics and Social Processes Group, Instituto de Ciências Agrárias e Ambientais Mediterrânicas
(ICAAM), University of Évora, Portugal.
Corresponding author:
Ana Paula Barreira, CIEO – Research Centre for Spatial and Organizational Dynamics, University of Algarve, Campus de Gambelas, Building 9, P–8005–139 Faro, Portugal.
1
Introduction
1
Cities that have achieved economic success tend to attract new inhabitants, and thus 2
demographic growth is often related to economic growth (Begg 1999; Lutz 2001; 3
Storper and Manville 2006). Cities with economic growth usually show an increase in 4
the amount of accumulated wealth available for redistribution, better job opportunities, 5
and a higher quality of life (Bhatta 2010; Blanc, Cahuzac, and Tahar 2008) by creating 6
the conditions that are needed for businesses to become established (Hansen and 7
Niedomysl 2009) and for public amenities to be provided (Kourtit, Nijkamp, and 8
Scholten 2015). Jointly with economic opportunities, the provision of affordable 9
housing (RWI 2010; Sasser 2010) and a friendly environment with pleasant climatic 10
conditions (Cheshire and Magrini 2006; Rappaport 2007) also attract inhabitants into 11
cities. Although some pull and push factors of cities may have universal relevance, 12
some factors appear to differ territorially (e.g., Guimarães et al. 2016; Royuela, Moreno, 13
and Vaya 2010). Therefore, identifying the specific factors that attract inhabitants into 14
particular cities has become increasingly relevant for policy purposes. 15
The process of urbanisation has been prevalent in Portugal since the 1960s, as it 16
has in most other parts of the world. The percentage of the Portuguese population living 17
in cities was 23% in 1960 and 30% in 1981, subsequently rising to 43% in 1991 and to 18
44% in 2011(i) (calculations based on INE – Portuguese National Statistics). However, 19
despite the city-based population increasing as a percentage of the national total, not all 20
cities have increased the number of their inhabitants. In fact, about one-fifth of 21
Portuguese cities registered the reverse process of population decline between 1991 and 22
2011 (Alves et al. 2016). 23
Although drivers of population growth and decline have been analysed in other 24
countries (e.g., Rappaport 2003; Stansel 2011, for the US; Bosker and Marlet 2006, for 25
2
Europe), there are no known studies investigating these dynamics in Portugal. 1
Moreover, with the exceptions of Ubareviciene, Van Ham, and Burneika (2016), for 2
declining regions of Lithuania, and Ferguson (2005), for local Canadian communities, 3
studies that have evaluated the impact of economic opportunities on population 4
migration have not analysed how each economic sector evolves and how the changes in 5
these sectors influence the choice of city of residence. Therefore, our study helps to fill 6
these gaps in the Portuguese context and serves as an empirical case study for an 7
approach that can be transposed to other realities. 8
The aim of the present study is to contribute to identifying the major drivers that 9
explain why Portuguese cities have grown or declined. To this end, several empirical 10
models are specified to relate city population growth to a set of variables that may affect 11
each city’s attractiveness as a place to live. Such variables include the active population 12
(i.e., working-age inhabitants, 18–65 years old), the share of employment per economic 13
sector (primary, secondary, or tertiary), the unemployment rate, the proportion of vacant 14
dwellings in the housing stock and their corresponding age, and climatic characteristics. 15
16
Literature Review
17In most countries of the world, an increasing number of individuals are living in 18
cities. Economic transformations related to globalization, climate change, and the 19
concentration of public facilities in large agglomerations in order to exploit scale 20
economies all help explain the movement of inhabitants from rural or less urbanised 21
areas into cities (Duranton and Puga 2004; Seto, Sánchez-Rodríguez, and Fragkias 22
2010). The process of urbanisation is based largely on the fact that urban areas tend to 23
have more jobs for skilled workers and higher wages (Blanc, Cahuzac, and Tahar 2008) 24
3
as well as improved public services and higher levels of social well-being 1
(Panagopoulos, Duque, and Dan 2016). 2
Despite this tendency for population to be increasingly concentrated in or around 3
cities, growing cities go hand in hand with declining cities (Cadwallader 1991). As a 4
result of demographic transitions such as increased life expectancies and decreased birth 5
rates, data reveal the existence of cities with increasing proportions of older residents 6
and, more surprisingly, cities that are losing inhabitants. In fact, despite the rise of urban 7
agglomerations, Turok and Mykhnenko (2007) found that the growth of European cities 8
generally slowed down between 1960 and 2005. 9
Migration tends to be related to employment opportunities, and a causal 10
relationship between employment and population growth is commonly observed (IOM 11
2011; Lutz 2001; Storper and Manville 2006). As such, migration is often explained by 12
the search for employment (Hunt 1993; Kourtit, Nijkamp, and Scholten 2015). Cities 13
that are more economically active generate more job opportunities and emerge as more 14
appealing places to live (Ferguson 2005; Panagopoulos, Duque, and Dan 2016), 15
especially for those individuals of working age and in particular for the creative class 16
(Blanc, Cahuzac, and Tahar 2008; Hansen and Niedomysl 2009). Moreover, individuals 17
and families tend to locate themselves where the chances of finding jobs are maximised 18
(Storper and Manville 2006). In Germany, Arntz, Gregory, and Lehmer (2013) found 19
that the movements of working-age individuals across regions are driven mainly by 20
differences in employment prospects. Even small changes in labour demand and in 21
productivity are determinants of a persistent inflow of population into a city (Rappaport 22
2004). In contrast, a high concentration of unemployment undermines population 23
growth (Ubareviciene, Van Ham, and Burneika 2016) by causing higher levels of social 24
deprivation (Andersen and van Kempen 2003). Accordingly, individuals and 25
4
households tend to choose places with low unemployment rates (Bhatta 2010; Hunt 1
1993), with the need for employment being a driver of out-migration and city 2
population decrease (Hoekveld 2012). 3
Despite the lack of studies addressing the impact of sectoral employment on 4
population growth, an increase in the number of jobs in the industry and service sectors 5
is expected to be a factor favouring in-migration, as these sectors are concentrated in 6
cities (Annez and Buckley 2009). The exploitation of agglomeration economies 7
provided by cities (Duranton and Puga 2004; Fujita and Thisse 2002) offers the right 8
environment for the development of high-technology and creative industries as well as 9
of financial and innovative services (Couch, Sykes, and Börstinghaus 2011; European 10
Commission 2006, 2007), which has increasingly brought newcomers into cities. The 11
only authors who have explicitly considered the influence of economic sectors on 12
population movements in their studies are Ferguson (2005) and Ubareviciene, Van 13
Ham, and Burneika (2016). The former author found for local Canadian communities 14
that industry diversity has a positive effect on population growth whereas agricultural 15
and resource extraction sectors have a negative effect. The latter authors examined the 16
economic factors that explain population change in Lithuanian regions and found that 17
populations are likely to expand in areas with increasing employment in the services 18
sector and to decrease in areas with a high proportion of employment in the agricultural 19
sector. 20
Together with economic attraction factors, the affordability of housing has also 21
been found to be a major factor in migration flows (Sasser 2010). The number of vacant 22
houses also seems to play an important role in both attracting and repelling inhabitants. 23
Depending on the state of preservation (i.e., the condition) of the vacant houses, a city 24
can be either an appealing location or a place from which to move. Two types of 25
5
vacancy are identified by Fielder and Smith (1996), namely, “transaction vacants” and 1
“problematic vacants”, with houses of the latter type being in poor states of repair and 2
expected to remain vacant. In more general terms, those cities that better reflect 3
households’ housing needs more commonly show urban growth, with both affordability 4
and the availability of new houses playing important roles. According to the Second 5
State of European Cities Report (RWI 2010), the existence of affordable, high-quality 6
housing may constitute an advantage for city population growth, in particular for 7
smaller cities, thus partially negating disparities between small cities and large cities in 8
income and poverty. Bhatta (2010) points out that the lack of affordable housing impels 9
households to live in the areas surrounding cities (the outskirts), thus promoting urban 10
sprawl. 11
Other factors influencing the quality of life in cities are also vital for encouraging 12
in-migration or for preventing out-migration. One such factor is the process of de-13
industrialization due to the post-Fordist transformation that has affected the old 14
industrial cities of Europe, a major consequence of which is the abundance of 15
abandoned sites and empty houses (Friedrichs 1993; Oswalt 2005). Along with 16
economic transformation, the phenomenon of suburbanization has also been a major 17
driver of population decline in European cities. Suburbanization occurs when families
18
choose to live outside the city in order to find more spacious or cheaper houses than are
19
available in the city centre (Hesse 2006; Partridge, Ali, and Olfert 2010), thus
20
generating inner cities that contain increasingly impoverished neighbourhoods and
21
abandoned dwellings.
22
An out-migration of inhabitants may also occur when climatic factors challenge 23
the quality of life. Rappaport (2007) found that temperatures play a role in the way that 24
city populations evolve. By analysing the average maximum temperatures in January 25
6
and July for US counties from the 1880s to the 1990s, that author found that lower 1
maximum and higher minimum temperatures helped explain patterns of population 2
growth. Cadwallader (1991) discovered for US cities between 1975 and 1980 that the 3
level of climatic attractiveness was greater in growing cities. For Europe, Cheshire and 4
Magrini (2006), considering the former EU-12 countries, did not find any evidence that 5
weather influenced mobility between countries but did find it relevant for mobility 6
within countries, whereby “warm days” measured by an upper value of heat, dryness, or 7
sunshine favour higher city population growth. In contrast, Mykhnenko and Turok 8
(2008) studied Eastern European cities but failed to find any difference in population 9
growth between cities in the sunnier, southern parts of Europe and those located in the 10
cooler, northern parts. 11
12
Portugal: Population, Housing, Employment, and Climate
13From 1991 to 2011, the population of Portugal increased from 9.87 to 10.56 14
million inhabitants (INE – Statistics Portugal). Of Portugal’s 158 cities, 146 are located 15
on the mainland, 7 in the Madeira Archipelago, and 5 in the Azores Archipelago. The 16
146 mainland cities are distributed with 54 in the northern part of the country, 43 in the 17
central part, and 49 in the southern part. In 2011, 44% of the resident population lived in 18
cities and, relative to 1991, most of the cities had increased in population. The 19
population of these growing cities increased by 25%, meaning that a net total of 20
630,000 inhabitants moved to live in such cities between 1991 and 2011. 21
Despite the prevalence of cities that grew between 1991 and 2011, 31 cities 22
showed population loss in that period, with 14 cities displaying a persistent decline 23
(both decades). Moreover, during those two decades, Portugal’s two biggest cities, 24
Lisbon and Oporto, experienced population declines of 17.4% and 21.5%, respectively. 25
7
Although the number of cities that are losing inhabitants is small, the fact that the 1
country’s two main cities are included within the 31 shrinking cities means that these 2
shrinking cities overall lost 225,000 inhabitants between 1991 and 2011. 3
Considering the Portuguese division into regions according to the Nomenclature 4
of Territorial Units for Statistics (NUTS III), whereby 29 out of 32 regions have cities, 5
there is a diversity in the territorial distribution of cities growing and declining in 6
population (1991–2011). Variation is also found when the changes in the number of 7
inhabitants of cities and in the municipalities in which the cities are located are 8
compared. Figure 1 shows this territorially heterogeneous distribution of growing and 9
shrinking cities according to growing/shrinking regions and municipalities. 10
(Figure 1 here) 11
Portuguese cities also exhibit a wide diversity in size. In 2011, 8.2% (13) cities 12
had fewer than 5,000 inhabitants, 20.3% (32) had 5,000–10,000 inhabitants, 60.8% (96) 13
had 10,000–50,000 inhabitants, 6.3% (10) had 50,000–100,000 inhabitants, and 4.4% 14
(7) had more than 100,000 inhabitants. The average size of Portuguese cities is 29,000 15
inhabitants, meaning that Portuguese cities are relatively small when compared with the 16
average size of European cities. Even the capital Lisbon, with 548,000 inhabitants in 17
2011, can be considered only a medium-sized city on a European scale. 18
The population growth between 1991 and 2011 varied widely between cities. 19
Caniço, on Madeira Island, increased by 240% (from 6,900 to 23,400 inhabitants), the 20
maximum positive change, whereas Oporto, the second-most-populous city in the 21
country, declined by 21.5% (from 302,500 to 237,600 inhabitants). On average, 22
between 1991 and 2011, the population in Portuguese cities grew by 9%, but when only 23
the growing (declining) cities are considered, they increased (decreased) on average by 24
25% (13%). Considering the average growth of the growing cities, 48 have values 25
8
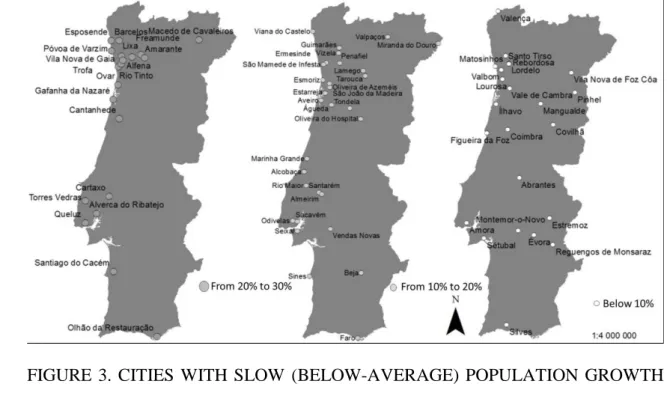
above the average and 79 have values below. Figures 2 and 3 show the locations of 1
mainland growing cities with rates above and below average, respectively, and Figure 4 2
shows the locations of cities that are declining in population (1991–2011). 3
(Figures 2, 3, and 4 here) 4
Between 1991 and 2011, the changes in the number of inhabitants in Portugal’s 5
cities were also accompanied by increases in the employment rate of between 38% and 6
45%. Given the diversity in the size of Portuguese cities, rates of employment and 7
unemployment also vary significantly between them. During this 20-year period 8
(considering observations for 1991, 2001, and 2011), the cities presented an average 9
unemployment rate of 7.6%, ranging from 18.7% in 2011 for Ponte de Sôr, a shrinking 10
city, to 0.9% in 1991 for Chaves, a growing city. In Portuguese cities, the tertiary sector 11
dominates employment, and the secondary sector is the second-most-important sector, 12
although its importance decreased from 35.8% of all jobs in 1991 to 24.9% in 2011. 13
Urban employment in the primary sector decreased from 6.8% in 1991 to 2.4% in 2011. 14
In 2011, the average number of houses in a city was 15,900, 13.4% of which were 15
vacant (i.e., uninhabited). The oldest houses (>30 years of age) and the most recently 16
constructed houses (<10 years of age) were the age categories that included a higher 17
proportion of vacant houses (both 16%), whereas only 8.5% of the houses that are 10– 18
30 years old were vacant. 19
Climatic conditions also vary between cities. Cities located near the coast are 20
favoured by mild temperatures with narrow amplitudes, whereas cities in the hinterland 21
have higher maximum and lower minimum average temperatures. The average 22
temperature of Portuguese cities is 15.5°C, with Moura (an inland city with a long 23
history of population decline) displaying the highest average temperature (21.3°C). The 24
85 cities (54%) that have an average temperature below the national average (14.1°C) 25
9
are located mostly along the Portuguese coast. Above-average temperatures are 1
experienced by 73 cities, located mostly in the hinterland areas, with an average 2
temperature of 17.0°C. These values suggest that in most cities, the amplitude of 3
temperature is relatively small. However, the difference between maximum and 4
minimum temperatures ranges from 14.8°C in Mêda (an inland shrinking city in the 5
central part of the country) to 4.1°C in Horta (an island of the Azores Archipelago). On 6
average, the difference between the maximum and minimum temperatures for 7
Portuguese cities is 9°C. 8
9
Data and Methodology
10The ‘city’ is a recent statistical category in Portugal. Only since 2003 have 11
resident population figures for cities started to be reported. More recently, in the 2011 12
census, other data were also made available by city (e.g., population by age, 13
employment, and number of houses, among others); however, such data do not allow 14
comparisons to be made with the past as corresponding figures are unavailable for the 15
censuses of 1991 and 2001. Other geographical configurations are more common in 16
Portuguese statistics, including geographical areas according to the NUTS scheme, 17
municipalities, parishes, and other smaller territorial units. However, none of these 18
geographical configurations matches with the ‘city’, although the closest one is the 19
parish. Therefore, and because some of the variables used in the empirical models 20
described below are not available at the city level for all three censuses (1991, 2001, 21
and 2011), the ‘city’ in all cases is considered as the sum of the predominantly urban 22
parishes that compose it. The information on the parishes that are part of each ‘city’ is 23
available online as a result of the 2013 parish reorganization that was undertaken in 24
Portugal. Therefore, data presented regarding the ‘city’ are in fact an approximation 25
10
based on the boundaries of the constituent parishes. A comparison of the values of data 1
available for ‘cities’ with those of the urban parishes that compose them for 2011 shows 2
that the differences are small and not detrimental to the analysis. 3
A database was constructed for each city for the period 1991–2011, based on the 4
corresponding 2011 parishes. Thus, the consistency of the analysis was ensured as cities 5
were constructed with constant boundaries over time. Data from censuses before 1991, 6
by parish, for all the considered variables, were not electronically available, limiting the 7
analysis to the 20-year period for which electronic collection of data was feasible 8
(1991–2011). 9
Data for resident population by parish were collected from the 1991, 2001, and 10
2011 censuses. Taking into consideration the characteristics analysed in the studies 11
reviewed, the other collected data measured: 1) total employment, and employment in 12
each sector; 2) unemployment; 3) the housing stock, taking into consideration the ages 13
of houses; 4) vacant houses, also distinguishing their ages; and 5) maximum and 14
minimum temperatures. All the data were retrieved from the Statistics Portugal database 15
(https://www.ine.pt) and correspond to census observations from 1991 to 2011, apart 16
from climatic data, which were retrieved from the website http://pt.climate-data.org. 17
The data refer to each of the current 158 Portuguese cities. 18
To explain the population growth of Portuguese cities, linear regression models 19
were estimated, with the dependent variable (Y) being defined as the percentage change 20
in city population between censuses (termed dPop). Since data are available from three 21
censuses, for each city there are two observations on Y, and therefore econometric 22
models appropriate for panel data are used. Because some of the explanatory variables 23
are time invariant, the following random effects model was estimated: 24
𝑌𝑖𝑡 = 𝑥𝑖𝑡𝛽 + 𝛼𝑖+ 𝑢𝑖𝑡, 25
11
where 𝑥𝑖𝑡 is the vector of explanatory variables observed for city 𝑖 in year t, with i = 1
1,…,158 and t = 2001, 2011; 𝛽 is the vector of the parameters of interest; 𝛼𝑖 are
city-2
specific effects; and 𝑢𝑖𝑡 is the idiosyncratic error term. 3
The vector 𝑥𝑖𝑡 comprises three different types of explanatory variables: economic 4
activity, housing stock, and temperature. Concerning economic activity, 𝑥𝑖𝑡 includes the 5
following variables for each city: the share of the population who are of working age 6
(ActPop); the rate of unemployment (Unemp); and the shares, taken with respect to the 7
total active population, of the labour force employed in the primary sector (mainly 8
agriculture and fishing, LfEmp1), in the secondary sector (mainly industry and 9
construction, LfEmp2), and in the tertiary sector (mainly services, LfEmp3). These 10
economic variables, along with the housing and climate variables, were considered as 11
regressors in the estimation of a first model (Model 1). The labour force share variables 12
were subsequently replaced by the shares of jobs in the primary and secondary sectors 13
with respect to total employment (JEmp1 and JEmp2) in the estimation of a second 14
specification (Model 2). 15
Regarding the housing stock of each city, the following variables are included: the 16
share of vacant houses in the total housing stock between two consecutive censuses 17
(VacancyRate); the proportion of old houses (>30 years old) that are vacant 18
(OldVacant); the proportion of middle-aged houses (10–30 years old) that are vacant 19
(MidVacant); and the proportion of new houses (<10 years old) that are vacant 20
(NewVacant). 21
Finally, 𝑥𝑖𝑡 also includes time-invariant climate-related variables for each city, 22
namely, the average monthly maximum temperature (MaxTemp) and the average 23
monthly minimum temperature (MinTemp). 24
12
Unlike the dependent variable, which is defined as a growth rate, all economic 1
and housing variables are measured in shares, taken at the beginning of each 10-year 2
period (1991 and 2001). Clearly, the starting values of these variables in a given period 3
may be important conditioning factors for city population changes during the following 4
decade. Another reason for using shares for measuring the explanatory variables is to 5
reduce the potential for simultaneity bias. Indeed, the growth rates of the economic and 6
housing variables are expected to be influenced by population changes. For example, 7
changes in the number of dwellings and vacant houses are likely to be predicted by 8
changes in population. Using shares observed at the beginning of each period instead of 9
growth rates for 𝑥𝑖𝑡 should eliminate this endogeneity problem. 10
To assess the suitability of each model, the RESET test was applied. While the 11
RESET test is typically used for testing functional form assumptions, it is, in fact, a 12
general test for model mis-specification, including random effects, fixed effects, and 13
endogeneity issues. For example, Ramalho and Ramalho (2012) showed that the 14
RESET test is able to detect a wide range of mis-specifications, including the omission 15
of relevant covariates, heteroskedasticity, covariate measurement error, response 16
misclassification, endogenous stratification, and missing data. Therefore, if the RESET 17
test fails to reject the hypothesis of correct specification of a given model, one can be 18
reasonably confident that a sound econometric model, from a statistical point of view, is 19
being used. The versions of the RESET test implemented in this paper used two fitted 20
powers of 𝑥𝑖𝑡𝛽 in the associated auxiliary regressions. 21
The coefficients of the explanatory variables and of the RESET tests were 22
obtained using the software package STATA. 23
Table 1 reports the means and other statistics for the dependent variable and 24
explanatory variables. 25
13 1
TABLE 1. DESCRIPTIVE STATISTICS FOR THE DEPENDENT VARIABLE AND 2
EXPLANATORY VARIABLES. 3
Variable Obs. Mean St. Dev. Min Max
dPop 316 9.99 14.58 −15.79 101.69 ActPop 316 52.47 3.54 38.35 67.58 Unemp 316 5.61 1.95 0.85 12.45 LfEmp1 316 4.26 5.20 0.20 50.36 LfEmp2 316 29.62 14.88 3.47 86.45 LfEmp3 316 51.39 13.08 10.59 118.55 JEmp1 316 5.18 6.33 0.24 57.11 JEmp2 316 34.09 14.69 11.10 80.50 VacancyRate 316 11.12 3.50 2.84 28.93 OldVacant 316 13.30 5.08 2.69 37.08 MidVacant 316 8.98 4.04 1.28 27.88 NewVacant 316 11.72 5.07 1.35 34.35 MaxTemp 316 20.12 2.15 15.10 29.20 MinTemp 316 10.95 2.34 3.70 17.00 4
Results and Discussion
5Table 2 reports the coefficients of the explanatory variables for the random effects 6
models specified in the previous section (Model 1 and Model 2). The respective results 7
of the RESET test show that both models can be considered to be correctly specified. 8
Based on the usual significance levels (1%, 5%, and 10%), the results of Model 1 show 9
that the main drivers explaining city population growth are the variables unemployment 10
rate (Unemp), shares of employment in the secondary (LfEmp2) and tertiary (LfEmp3) 11
sectors, middle-aged vacant houses (MidVacant), and maximum temperature 12
(MaxTemp). 13
Table 2 reveals that the higher the rate of unemployment, the lower the city 14
population growth. This result suggests that the dynamics of population change and the 15
economic strength of a city are directly related to the generation of employment. 16
Citizens follow job opportunities, and, as such, cities with higher employment rates are 17
14
more appealing for prospective residents. Conversely, high unemployment rates impel 1
households to find other cities. This result agrees with the literature, in which 2
employment works as a pull factor (Arntz, Gregory, and Lehmer 2013; Hunt 1993) 3
whereas unemployment acts as a push factor (Bhatta 2010; Hoekveld 2012). 4
5
TABLE 2. DETERMINANTS OF POPULATION CHANGE IN PORTUGUESE 6 CITIES. 7 Model 1 Model 2 ActPop 0.196 (0.297) 0.177 (0.304) Unemp −1.834*** (0.584) −1.836*** (0.581) LfEmp1 −0.067 (0.222) --- LfEmp2 0.171* (0.087) --- LfEmp3 0.220** (0.096) --- JEmp1 --- −0.296** (0.146) JEmp2 --- −0.007 (0.072) VacancyRate −0.693 (0.924) −0.671 (0.935) OldVacant −0.118 (0.325) −0.125 (0.323) MidVacant 1.549*** (0.417) 1.502*** (0.420) NewVacant 0.033 (0.287) 0.006 (0.285) MaxTemp 0.787* (0.413) 0.722* (0.429) MinTemp 0.554 (0.544) 0.659 (0.559) intercept −32.960 (20.625) −13.403 (19.416) N. observations 316 316 RESET test 3.44 2.27
Note: Standard deviations are in parentheses below the respective coefficients; ***,
8
**, and * denote variables or test statistics that are statistically significant at the 1%,
9
5%, and 10% levels of significance, respectively.
10 11
15
The results also corroborate the policies introduced by the governments of those 1
Portuguese municipalities that have been declining in population in recent years in 2
attempts to avoid the population loss. Such policies have been based mostly on 3
incentives directed towards the attraction or retention of a business fabric to improve or 4
maintain jobs. Policies based on tourism and handicraft activities have been particularly 5
supported (see Panagopoulos and Barreira 2012). Indeed, while the proportion of 6
working-age inhabitants does not seem to be a relevant factor for explaining changes in 7
city populations, any measure aiming to reduce the unemployment rate of cities will be 8
important for promoting population growth. Clearly, cities must be active in generating 9
job opportunities if they want to attract new inhabitants. 10
Our results also show that higher shares of employment in the secondary and 11
tertiary sectors are pull factors for Portuguese cities, leading to population growth. On 12
the other hand, employment in the primary sector does not promote population growth 13
in cities, supporting the previous findings of Ferguson (2005) and Ubareviciene, Van 14
Ham, and Burneika (2016). Jobs in the primary sector pay lower-than-average wages, 15
which may explain why cities creating job opportunities in the primary sector have 16
failed to attract new inhabitants in a significant way. Moreover, because Portuguese 17
cities, similar to most other cities around the globe, are places of agglomeration of 18
industry and service activities (Annez and Buckley 2009), employment in the primary 19
sector does not have enough relevance (representing on average just 4% of the labour 20
force employed – see Table 1) to influence movements from rural and surrounding areas 21
into cities. The most relevant economic sector in explaining population growth is 22
employment in the tertiary sector (services), followed by employment in the secondary 23
sector (industry), which reflects the economic structure of the Portuguese cities whereby 24
more than half of the employment generated is in the tertiary sector (see Table 1). 25
16
To further examine the contribution of the employment profile to explaining 1
population dynamics, Model 2 was estimated. The only difference compared with 2
Model 1 is the definition of the sectoral employment variables. In Model 1, the shares 3
were calculated over the total active population, so increasing the share of a sector by a 4
percentage point implies decreasing the share of the active population not employed by 5
the same amount. In Model 2, the shares of employment in each sector were calculated 6
relative to total employment (see descriptive statistics in Table 1), which means that the 7
shares of the three sectors sum to unity. Thus, only the shares of jobs in the primary and 8
secondary sectors are explicitly included in the regression model (JEmp1 and JEmp2), 9
and a percentage point increment in one of those sectors implies decreasing the share of 10
employment in the tertiary sector by the same amount. The results show that policies 11
aimed at increasing the importance of employment in the primary sector relative to the 12
tertiary sector lead to city population decline. In contrast, jobs in the secondary and 13
tertiary sectors may be interchanged without consequences for city population growth. 14
Overall, the results of both models suggest that those cities that successfully made a 15
transition from an economy characterized by a higher number of jobs in the agriculture 16
sector to one relying mainly on industry and services became more attractive to citizens 17
as places to work and live compared with other cities. 18
The proportion of vacant houses in a city does not significantly affect its 19
population dynamics. However, cities with a higher share of middle-aged vacant houses 20
appear to be more likely to exhibit population growth. A possible reason for this is that 21
these houses to purchase or to rent are usually not as expensive as similar newer houses 22
and tend to be in better condition than older houses, so cities with a higher proportion of 23
such middle-aged houses available in the housing market are better placed to attract new 24
inhabitants. Therefore, it is important to distinguish vacant houses that can enter the 25
17
market from those in poor condition whose entrance is less likely (Fielder and Smith 1
1996). The absence of habitable houses or the existence only of houses that are too 2
expensive (usually the newer ones) promotes urban sprawl, thus decreasing population 3
in cities, in accordance with previous predictions (Bhatta 2010; RWI 2010). 4
Finally, climatic factors also seem to be relevant in explaining the population 5
changes of Portuguese cities. In particular, cities with higher average maximum 6
temperatures are more likely to have experienced population growth, but average 7
minimum temperatures are not statistically significant. These results contrast with the 8
literature (Rappaport 2007), which has identified higher minimum and lower maximum 9
temperatures as pull factors for city population growth. A possible explanation for this 10
difference may be the different ranges of temperatures observed in the studies. 11
Rappaport (2007) considered the average maximum temperatures in January (5.2°C) 12
and July (36.8°C) for the US. In contrast, the present study considered annual average 13
monthly maximum temperatures for Portuguese cities, which show an overall average 14
maximum temperature of 20°C with a standard deviation of approximately 2°C (see 15
Table 1). Moreover, while in some countries low temperatures reach negative values on 16
average, in Portugal the average minimum temperature is 11°C with a standard 17
deviation of approximately 2°C. Thus, the results for the Portuguese cities are more in 18
line with the findings of Cheshire and Magrini (2006) that warmer conditions favour 19
city population growth. 20
21
Robustness Checks
22As discussed above, Portuguese cities are very heterogeneous. On the one hand, 23
these cities display a wide diversity in size, with almost 30% containing fewer than 24
10,000 inhabitants. On the other hand, the phenomenon of suburbanization has led to 25
18
the growth of some cities but has promoted population decline in others, most notably in 1
the two biggest cities, Lisbon and Oporto. Thus, to examine whether the aforementioned 2
findings are generally applicable to the Portuguese context or, rather, they are valid only 3
for specific groups of Portuguese cities, Model 1 was re-estimated for three sub-samples 4
of the initial dataset. 5
Table 3 reports the results obtained for three distinct sub-samples of Portuguese 6
cities. In the first two models, the smallest cities (less than 10,000 inhabitants) and the 7
biggest cities (Lisbon and Oporto) were respectively dropped from the sample. Then, to 8
examine the robustness of the results with respect to the suburbanization process that 9
has affected the urban growth of some cities, in the third model all cities in the Lisbon 10
and Oporto metropolitan areas were excluded from the sample. 11
In general, the factors identified above as the main drivers of city population 12
changes remain important when each of the three aforementioned three groups of cities 13
is dropped from the sample. In all cases when a group of cities is dropped, a higher 14
proportion of employment in the tertiary sector and a higher share of middle-aged 15
vacant houses are, as in Model 1, significant determinants of population growth in 16
cities, and a higher unemployment rate is again a factor inducing population decline. In 17
fact, when compared with Model 1, there are only minor changes in the estimation 18
results, which concern only variables that were, or are now, marginally significant from 19
a statistical point of view (10% level). Some of these changes may be a consequence of 20
a reduced sample size, which decreases the precision of the estimation and therefore (in 21
a statistical sense) makes it more difficult to obtain significant variables. Other changes 22
may be the result of excluding cities with specific characteristics from the sample. 23
19
TABLE 3. DETERMINANTS OF POPULATION CHANGE IN SUB-SAMPLES OF 1 PORTUGUESE CITIES. 2 Sample excludes Cities of <10,000 inhabitants (1)
Lisbon and Oporto (2)
Lisbon and Oporto metropolitan areas (3) ActPop 0.757* (0.422) 0.174 (0.300) 0.320 (0.323) Unemp −2.158*** (0.808) −1.769*** (0.596) −1.667*** (0.648) LfEmp1 0.601 (0.392) −0.111 (0.218) −0.262 (0.187) LfEmp2 0.127 (0.093) 0.154* (0.089) 0.106 (0.085) LfEmp3 0.183** (0.092) 0.227** (0.099) 0.186** (0.090) VacancyRate −0.434 (1.219) −0.668 (0.933) −1.178 (1.047) OldVacant −0.126 (0.398) −0.158 (0.328) −0.068 (0.371) MidVacant 1.465*** (0.521) 1.564*** (0.421) 1.810*** (0.475) NewVacant −0.157 (0.384) 0.011 (0.287) 0.116 (0.353) MaxTemp 0.219 (0.463) 0.626 (0.416) 0.778* (0.418) MinTemp 0.630 (0.691) 0.513 (0.545) 0.718 (0.575) Intercept −48.005* (27.630) −27.607 (20.848) −35.586* (21.331) No. observations 226 312 264 RESET test 2.79 3.34 2.60
Note: ***, **, and * denote variables that are statistically significant at the 1%, 5%, and 10%
3
levels of significance, respectively.
4 5
When small cities are excluded from the sample (column 1 of Table 3), the 6
proportion of the population represented by working-age inhabitants becomes a 7
determinant of population growth. Thus, policies focused on the working-age 8
population, even when not related to the creation of employment opportunities, may 9
promote population growth in medium-sized and large cities. Moreover, the negative 10
effect on population growth of a high unemployment rate appears to be more relevant 11
for cities containing more than 10,000 inhabitants. In contrast, the creation of 12
20
employment in the secondary sector seems to be an important factor in the population 1
growth of small and medium-sized cities (column 2 of Table 3). Finally, a higher 2
maximum temperature appears to be a relevant driver of population growth only in 3
cities outside the Lisbon and Oporto metropolitan areas (column 3 of Table 3). Clearly, 4
these two larger cities have achieved a state where climate is no longer an influence on 5
their population dynamics. 6
7
Concluding Remarks
8This study examined the determinants that make some cities more appealing 9
places to live compared with others. We tested whether explanatory variables related to 10
employment, housing, and climatic conditions are drivers of urban population growth 11
and decline, and found that greater employment opportunities in the secondary and 12
tertiary sectors, a higher share of middle-aged vacant houses, and higher average 13
temperatures favour population growth, whereas a higher unemployment rate helps to 14
explain population decline. 15
To increase their populations, cities must be active in generating job 16
opportunities. If those job opportunities are created mainly in the secondary and tertiary 17
sectors, then cities will have a higher probability of experiencing population growth. 18
Regarding the secondary sector, urban planners should contemplate promoting this 19
sector in designated areas where the impacts on the landscape and on the environment 20
are properly addressed. Technologies that are environmentally friendly and which lead 21
to higher productivity would help to change the usual negative image associated with 22
heavy industrial activity, and thus the implementation of high-technology industries 23
should be favoured. Such technology-driven industries, which are associated with 24
21
promoting gains in the quality of life, should attract more workers and inhabitants to 1
cities with industrial potential. 2
The share of middle-aged vacant housing is a pull factor for Portuguese cities, 3
whereas old vacant housing, despite constraining population growth, does not have a 4
significant effect on population evolution. The irrelevance of old vacant housing as a 5
push factor of cities might be due to the underlying process of shrinkage in Portugal, 6
which is at an early stage. In other countries, where the shrinkage phenomenon is more 7
evenly distributed geographically, such as the US and Germany (Haase et al. 2012; 8
Mallach 2011), the existence of old vacant houses seems to have a more important role 9
in pushing away inhabitants, compared with the case of Portugal, which has encouraged 10
the adoption of house-demolition policies. 11
Cities with higher average temperatures emerge as being more appealing places to 12
live compared with other cities. However, cities in the same region reveal different 13
patterns regarding the capability of attracting inhabitants. This reinforces the importance 14
of the other factors affecting city population growth as revealed by the regression 15
models, namely, those related to the economic activity of the city and the affordability 16
of housing. 17
The process of urbanisation across the globe shows different patterns. While 18
population growth in the cities of Europe and North America accelerated in the 19
nineteenth century, most had stabilized by the mid-twentieth century, and others are 20
continuing to urbanise, as in the Portuguese case (source: World Bank 2016). However, 21
because of the decreasing fertility rate, most European countries are likely to experience 22
a decline in population in the near future, thus increasing the likelihood of having a 23
wider dichotomy between cities gaining inhabitants and cities losing them. This paper 24
highlights that distinguishing these two processes, one of growth and one of decline, is 25
22
not an easy task. Governments will need to conceive new policies and planning 1
approaches to deal with these different realities. 2
To further understand the differences found between the dynamics of population 3
growth and decline, future work would also need to consider some subjective indicators 4
of urban quality, such as inhabitants’ emotional attachment to their cities and the level 5
of residential satisfaction. Such an analysis would help to more accurately define 6
suitable policies for dealing with the realities of city shrinkage and with the differences 7
in population decline/growth between cities. 8
9
REFERENCES
10Alves, D., A.P. Barreira, M.H. Guimarães, and T. Panagopoulos. 2016. Historical 11
trajectories of currently shrinking Portuguese cities: A typology of urban shrinkage. 12
Cities 52: 20–29. 13
Andersen, H.T., and R. van Kempen. 2003. New trends in urban policies in Europe: 14
evidence from the Netherlands and Denmark. Cities 20(2): 77−86. 15
Annez, P. C., and R. M. Buckley. 2009. Urbanization and growth: Setting the context. 16
In Urbanization and Growth, ed. M. Spence, P. C. Annez, and R. M. Buckley, 17
1−45. The International Bank for Reconstruction and Development/ The World 18
Bank, Commission on Growth and Development: Washington D.C. 19
Arntz, M., T. Gregory, and F. Lehmer. 2013. Can regional employment disparities 20
explain the allocation of human capital across space? Regional Studies 48(10): 21
1719–1738. 22
Begg, I. 1999. Cities and Competitiveness. Urban Studies 36(5–6): 795−809. 23
23
Bhatta, B. 2010. Causes and consequences of urban growth and sprawl. In Analysis of
1
Urban Growth and Sprawl from Remote Sensing Data, Advances in Geographic
2
Information Science, 17−36. Springer-Verlag: Berlin.
3
Blanc, M., E. Cahuzac, and G. Tahar. 2008. Hiring Difficulties and Manpower Flows: 4
Does Labour Market Density Matter? Environment and Planning A 40(5): 1090– 5
1108. 6
Bosker, M., and G. Marlet. 2006. Urban growth and decline in Europe. Utrecht School 7
of Economics, Tjalling C. Koopmans Research Institute. Discussion Paper no: 06– 8
18. 9
Cadwallader, M. 1991. Metropolitan growth and decline in the United States: an 10
empirical analysis. Growth and Change 22(3): 1−16. 11
Cheshire, P., and S. Magrini. 2006. Population growth in European cities: Weather 12
matters – But only nationally. Regional Studies 40(1): 23–37. 13
Couch, C., O. Sykes, and W. Börstinghaus. 2011. Thirty years of urban regeneration in 14
Britain, Germany and France: The importance of context and path dependency. 15
Progress in Planning 75(1): 1−52. 16
Duranton, G., and D. Puga. 2004. Micro-foundations of Urban Agglomeration 17
Economies. In Handbook of Regional and Urban Economics, vol. 4, ed. J. V. 18
Henderson, and J.-F. Thisse. Elsevier B.V: Amsterdam. 19
European Commission, 2006. Cohesion policy and cities: the urban contribution to 20
growth and jobs in the regions. Communication from the Commission to the 21
Council and Parliament, July. Office for Official Publications of the European 22
Communities: Luxembourg. 23
European Commission. 2007. State of European cities. Directorate-General Regional 24
Policy: Brussels. 25
24
Ferguson, M.A. 2005. Demographic change and sustainable communities: The role of 1
local factors in explaining population change (MSc thesis, University of 2
Saskatchewan). 3
Fielder, S., and R. Smith. 1996. Vacant Dwellings in the Private Sector. London: 4
HMSO. 5
Friedrichs, J. 1993. A theory of urban decline: Economy, demography and political 6
elites. Urban Studies 30(6): 907–917. 7
Fujita, M., and J.-F. Thisse. 2002. Economics of Agglomeration. Cambridge University 8
Press: Cambridge. 9
Guimarães, M.H., L.N. Catela, A.P. Barreira, and T. Panagopoulos. 2016. What makes 10
people stay in or leave shrinking cities? An empirical study from Portugal. 11
European Planning Studies 24(9):1684–1708. 12
Haase, A., G. Herfert, S. Kabisch, and A. Steinführer. 2012. Reurbanizing Leipzig 13
(Germany): Context Conditions and Residential Actors (2000–2007). European 14
Planning Studies 20(7): 1173–1196. 15
Hansen, H. K., and T. Niedomysl. 2009. Migration of the creative class: Evidence from 16
Sweden. Journal of Economic Geography 9: 191–206. 17
Hesse, M. 2006. Suburbanization. In Atlas of Shrinking Cities, ed. P. Oswalt, 96–97. 18
Hatje Cantz: Ostfildern. 19
Hoekveld, J. 2012. Time-space relations and the difference between shrinking regions. 20
Built Environment 38(2): 179–195. 21
Hunt, G. L. 1993. Equilibrium and disequilibrium in migration modelling. Regional
22
Studies 27(4): 341–349. 23
25
International Organization for Migration (IOM). 2011. Economic cycles, demographic 1
change and migration. International Dialogue on Migration Workshop – The future 2
of migration: Building capacities for change, Background Paper, 12–13 September. 3
Kourtit, K., P. Nijkamp, and H. Scholten. 2015. The Future of the New Urban World. 4
International Planning Studies 20(1–2): 4−20. 5
Lutz, J.M. 2001. Determinants of population growth in urban centres in the Republic of 6
Ireland. Urban Studies 38(8): 1329–1340. 7
Mallach, A. 2011. Demolition and preservation in shrinking US industrial cities. 8
Building Research and Information 39(4): 380–394. 9
Mykhnenko, V., and I. Turok. 2008. East European cities – patterns of growth and 10
decline, 1960–2005. International Planning Studies 13(4): 311−342. 11
Oswalt, P., ed. 2005. Shrinking Cities: International Research, Vol. 1. Hatje Cantz: 12
Ostfildern Germany. 13
Panagopoulos, T., and A.P. Barreira. 2012. Perceptions and shrink smart strategies for 14
the municipalities of Portugal. Built Environment 38(2): 276‒292. 15
Panagopoulos, T., J.A.G. Duque, and M.B. Dan. 2016. Urban planning with respect to 16
environmental quality and human well-being. Environmental Pollution 208(A): 17
137–144. 18
Partridge, M.D., M.D.K. Ali, and M.R. Olfert. 2010. Rural-to-urban commuting: Three 19
degrees of integration. Growth and Change 41(2): 303−335. 20
Rappaport, J. 2003. US urban decline and growth, 1950 to 2000. Federal Reserve Bank 21
of Kansas City, Economic Review, Third Quarter: 15‒44. 22
Rappaport, J. 2004. Why are population flows so persistent? Journal of Urban 23
Economics 56(3): 554‒580. 24
26
Rappaport, J. 2007. Moving to nice weather. Regional Science and Urban Economics 1
37(3): 375–398. 2
Ramalho, E.A., and J.J.S. Ramalho. 2012. Alternative versions of the RESET test for 3
binary response index models: a comparative study. Oxford Bulletin of Economics 4
and Statistics 74(1): 107–130. 5
Rheinisch-Westfälisches Institut (RWI). 2010. Second State of European Cities Report. 6
Research Project for the European Commission, DG Regional Policy. Germany: 7
Essen. 8
Royuela, V., R. Moreno, and E. Vaya. 2010. Influence of quality of life on urban 9
growth: A case study of Barcelona, Spain. Regional Studies 44(5): 551–567. 10
Sasser, A.C. 2010. Voting with their feet: Relative economic conditions and state 11
migration patterns. Regional Science and Urban Economics 40(2): 122‒135. 12
Seto, K.C., R. Sánchez-Rodríguez, and M. Fragkias. 2010. The new geography of 13
contemporary urbanization and the environment. Annual Review of Environment 14
and Resources 35: 167‒194. 15
Stansel, D. 2011. Why some cities are growing and others are shrinking. Cato Journal 16
31(2): 285‒303. 17
Storper, M., and M. Manville. 2006. Behaviour, preferences and cities: Urban theory 18
and urban resurgence. Urban Studies 43(8): 1247‒1274. 19
Turok, I., and V. Mykhnenko. 2007. The trajectories of European cities, 1960–2005. 20
Cities 24(3): 165‒182. 21
Ubareviciene, R., M. Van Ham, and D. Burneika. 2016. Shrinking regions in a 22
shrinking country: The geography of population decline in Lithuania 2001–2011. 23
Urban Studies Research 2016, Article ID 5395379. 24
27
World Bank. 2016. Urban population (% of total population). Available from: 1
https://datamarket.com. Consulted on April 9, 2016. 2
3
NOTES
(i) These values are lower than the world and European values of about 50% and 70% of
urban inhabitants, respectively. However, it should be noted that in Portugal, some towns do not have the status of ‘city’ in spite of having an urban profile and even in some cases a higher number of inhabitants (e.g., Gouveia is a city with around 3,000 inhabitants whereas Algueirão and Corroios are towns with approximately 66,000 and 47,000 inhabitants, respectively). When cities and towns are considered together, the urban population of Portugal in 2011 constituted more than 60% of the total population (World Bank 2016).
28 FIGURES 1 2 3 4 5 6 7 8 9 10 11 12
FIGURE 1. DISTRIBUTION OF GROWING AND SHRINKING CITIES BY 13
GROWING/SHRINKING REGIONS AND MUNICIPALITIES 14
15
FIGURE 2. CITIES WITH HIGH (ABOVE-AVERAGE) POPULATION GROWTH 16
IN PORTUGAL BETWEEN 1991 AND 2011. 17 18 Number of growing regions with Number of shrinking regions with Growing cities Located in growing municipalities Growing and
shrinking cities Shrinking cities
Located in shrinking municipalities 6 8 6 8 1 79 11 28 20 20 Located in growing municipalities with declining areas outside cities
29 1
FIGURE 3. CITIES WITH SLOW (BELOW-AVERAGE) POPULATION GROWTH 2
IN PORTUGAL BETWEEN 1991 AND 2011. 3
4
5
FIGURE 4. CITIES WITH POPULATION DECLINE IN PORTUGAL BETWEEN 6
1991 AND 2011. 7