A METHODOLOGY TO PRODUCE GEOGRAPHICAL INFORMATION FOR
LAND PLANNING USING VERY
‐
HIGH RESOLUTION IMAGES
Teresa Alexandra Gonçalves dos Santos Silva
Tese de Doutoramento em Geografia e Planeamento Territorial,
Especialização em Detecção Remota e Sistemas de Informação
Tese apresentada para cumprimento dos requisitos necessários à obtenção do grau de Doutor em Geografia e Planeamento Territorial, Especialização em Detecção Remota e Sistemas de Informação Geográfica, realizada sob a orientação científica do Professor Doutor José António Tenedório e co-orientação da Doutora Ana Fonseca
Dissertação de Doutoramento em Geografia e Planeamento Territorial, Especialização em Detecção Remota e Sistemas de Informação Geográfica, elaborada no âmbito do projecto
GEOSAT – Methodologies to extract large scale GEOgraphical information from very high
resolution SATellite images (PTDC/GEO/64826/2006), financiado pela Fundação para a Ciência
e Tecnologia, que decorreu no e-GEO – Centro de Estudos de Geografia e Planeamento Regional,
da Faculdade de Ciências Sociais e Humanas, no quadro do Grupo de Investigação Modelação Geográfica, Cidades e Ordenamento do Território
ACKNOWLEDGMENTS
Dirijo o meu primeiro agradecimento aos meus pais, ao António e aos meus filhos pela estabilidade, encorajamento e equilíbrio emocional que me propuseram, sem os quais não teria sido possível desenvolver o trabalho aqui apresentado.
Gostaria ainda de agradecer a outras pessoas que me ajudaram no decorrer desta investigação.
Ao Prof. Doutor José António Tenedório, meu orientador científico, que me acompanhou em todas as fases do trabalho, e me disponibilizou todos os meios técnicos e total liberdade de investigação.
À Engenheira Ana Fonseca, minha co-orientadora, pela sua disponibilidade e apoio em todas as fases desta tese.
Ao Dr. Miguel Brito, pelo esclarecimento de todas as dúvidas em relação ao cálculo dos parâmetros solares e ao Nuno Gomes pela implementação do modelo SIG que permitiu avaliar o potencial solar de edifícios.
Aos meus colegas Bruno Neves, Carla Rebelo, Nuno Afonso, Sara Encarnação e Rossana Estanqueiro, que me ajudaram em diversas fases deste estudo.
Um agradecimento especial ao meu amigo Sérgio Freire, pelo apoio, motivação, disponibilidade, críticas, interrogações e direcções apontadas.
Aos meus colegas do projecto GEOSAT, pelo companheirismo, troca de ideias e pela partilha de todas as frustrações e alegrias ao longo destes 3 anos de trabalho conjunto.
À Fundação para a Ciência e Tecnologia, pelo apoio financeiro cedido sob a forma de uma bolsa individual de doutoramento.
À empresa Lógica, pela cedência dos dados LiDAR, que permitiram ir mais além na investigação proposta.
RESUMO
DESENVOLVIMENTO DE UMA METODOLOGIA PARA PRODUÇÃO DE INFORMAÇÃO GEOGRÁFICA PARA PLANEAMENTO TERRITORIAL, A
PARTIR DE IMAGENS DE MUITO GRANDE RESOLUÇÃO ESPACIAL
TERESA ALEXANDRA GONÇALVES DOS SANTOS SILVA
PALAVRAS-CHAVE: uso do solo, ocupação do solo, imagens, muito-alta resolução espacial, extracção de features, LiDAR, planeamento, monitorização do território
Actualmente, os municípios são obrigados a produzir, no âmbito da elaboração dos instrumentos de gestão territorial, cartografia homologada pela autoridade nacional. O Plano Director Municipal (PDM) tem um período de vigência de 10 anos. Porém, no que diz respeito à cartografia para estes planos, principalmente em municípios onde a pressão urbanística é elevada, esta periodicidade não é compatível com a dinâmica de alteração de uso do solo. Emerge assim, a necessidade de um processo de produção mais eficaz, que permita a obtenção de uma nova cartografia de base e temática mais frequentemente. Em Portugal recorre-se à fotografia aérea como informação de base para a produção de cartografia de grande escala. Por um lado, embora este suporte de informação resulte em mapas bastante rigorosos e detalhados, a sua produção têm custos muito elevados e consomem muito tempo.
As imagens de satélite de muito alta-resolução espacial podem constituir uma alternativa, mas sem substituir as fotografias aéreas na produção de cartografia temática, a grande escala.
O tema da tese trata assim da satisfação das necessidades municipais em informação geográfica actualizada. Para melhor conhecer o valor e utilidade desta informação, realizou-se um inquérito aos municípios Portugueses. Este passo foi essencial para avaliar a pertinência e a utilidade da introdução de imagens de satélite de muito alta-resolução espacial na cadeia de procedimentos de actualização de alguns temas, quer na cartografia de base quer na cartografia temática.
A abordagem proposta para solução do problema identificado baseia-se no uso de imagens de satélite e outros dados digitais em ambiente de Sistemas de Informação Geográfica.
A experimentação teve como objectivo a extracção automática de elementos de interesse municipal a partir de imagens de muito alta-resolução espacial (fotografias aéreas ortorectificadas, imagem QuickBird, e imagem IKONOS), bem como de dados altimétricos (dados LiDAR).
ABSTRACT
A METHODOLOGY TO PRODUCE GEOGRAPHICAL INFORMATION FOR LAND PLANNING USING VHR IMAGES
TERESA ALEXANDRA GONÇALVES DOS SANTOS SILVA
KEYWORDS: land use, land cover, images, very-high spatial resolution, feature extraction, LiDAR, land planning, land monitoring
Currently, the Portuguese municipalities are required to produce homologated cartography, under the Territorial Management Instruments framework. The Municipal Master Plan (PDM) has to be revised every 10 years, as well as the topographic and thematic maps that describe the municipal territory. However, this period is inadequate for representing counties where urban pressure is high, and where the changes in the land use are very dynamic. Consequently, emerges the need for a more efficient mapping process, allowing obtaining recent geographic information more often. Several countries, including Portugal, continue to use aerial photography for large-scale mapping. Although this data enables highly accurate maps, its acquisition and visual interpretation are very costly and time consuming.
Very-High Resolution (VHR) satellite imagery can be an alternative data source, without replacing the aerial images, for producing large-scale thematic cartography.
The focus of the thesis is the demand for updated geographic information in the land planning process. To better understand the value and usefulness of this information, a survey of all Portuguese municipalities was carried out. This step was essential for assessing the relevance and usefulness of the introduction of VHR satellite imagery in the chain of procedures for updating land information.
The proposed methodology is based on the use of VHR satellite imagery, and other digital data, in a Geographic Information Systems (GIS) environment.
Different algorithms for feature extraction that take into account the variation in texture, color and shape of objects in the image, were tested. The trials aimed for automatic extraction of features of municipal interest, based on aerial and satellite high-resolution (orthophotos, QuickBird and IKONOS imagery) as well as elevation data (altimetric information and LiDAR data).
TABLE OF CONTENTS
Introduction ... 1
Overall Research Objectives ... 3
Relevance and Contributions ... 4
Thesis Organization and Outline ... 5
1. Conceptual Foundations of Urban Landscape Analysis Based on Remote Sensing Data 7 1.1 Urban Environment ... 8
1.1.1 Temporal Considerations ... 10
1.1.2 Spectral Considerations ... 10
1.1.3 Spatial Considerations ... 14
1.1.4 Urban Change Dynamics ... 17
1.2 Contribution of Remote Sensing Data to Study the Urban Context ... 17
1.2.1 Aerial and Spaceborne Images ... 18
1.2.2 Technical Considerations ... 20
1.2.3 Urban Remote Sensing Applications ... 23
1.3 Thematic Land Use and Land Cover Maps in Portugal ... 26
Concluding Remarks ... 32
2. Methodological Approches for Land Cover Mapping with Remote Sensing Data... 33
2.1 Selection of the Base Map and the Map Scale ... 34
2.2 Classification System ... 37
2.2.1 The Concepts of Land Use and Land Cover ... 38
2.2.2 International Classifications Systems... 39
2.3 Data Selection For Large-Scale Mapping ... 41
2.3.1 Very-High Resolution Imagery ... 41
2.3.2 Altimetric Data ... 45
2.3.3 Auxiliary Data ... 48
2.4 Imagery Pre-processing ... 48
2.4.1 Geometric Correction ... 48
2.4.2 Radiometric Correction ... 52
2.4.3 Multiresolution Fusion ... 54
2.5.1 Image Photo-Interpretation ... 56
2.5.2 Digital Image Classification ... 58
2.6 Accuracy Assessment ... 60
2.6.1 Completeness ... 61
2.6.2 Logical Consistency ... 61
2.6.3 Positional Accuracy... 62
2.6.4 Temporal Accuracy ... 63
2.6.5 Thematic Accuracy ... 63
2.6.6 Object-Based Accuracy Assessment ... 65
2.6.7 Change Detection Evaluation ... 66
3. From Earth Observation Data to Thematic Information: Land Use and Land Cover Mapping Approaches ... 68
3.1 Digital Classification at the Pixel Level ... 69
3.2 Digital Classification with Contextual Information ... 72
3.3 Classification at the Sub-Pixel Level ... 76
3.4 Fuzzy Classifiers ... 78
3.5 Use of Ancillary Data in the Classification Process ... 80
3.6 Object-Oriented Classification ... 84
3.6.1 Image Segmentation ... 85
3.6.2 Classification of Objects ... 91
3.6.3 Implementation Environments ... 91
3.7 Change Detection with Satellite Images ... 95
3.7.1 Nature of Change ... 97
3.7.2 Techniques to Detect Changes in Satellite Images ... 102
3.8 Conclusions ... 109
3.8.1 Data source for urban mapping ... 109
3.8.2 Methodologies for urban mapping ... 110
3.8.3 Methodologies to update urban maps... 111
4. Extracting Information From VHR Imagery – State of The Art ... 112
4.1 Extracting Land Information in Urbanized Areas ... 113
Synthesis... 133
4.3 Extracting Buildings Using Altimetric and Spectral Data ... 135
Synthesis... 143
5. Urban Planning and Land Management in Portugal ... 144
5.1 Land Planning System at the Local Level ... 145
5.1.1 National Entities Involved in the Land Planning Process ... 152
5.1.2 Territorial Management Instruments Applied in the Local Level ... 155
5.1.3 Formalizing the PDM ... 156
5.2 Municipal Procedures That Require Geographic Information ... 158
5.2.1 PDM Preparation ... 158
5.2.2 PDM Public Discussion ... 160
5.2.3 Assessing and Monitoring the PDM Implementation ... 161
5.3 The Need For Updated Geo-Information at the Municipal Level ... 164
5.3.1 Survey Text ... 165
5.3.2 Dissemination ... 167
5.3.3 Data Collection ... 167
5.3.4 Data Analysis and Results ... 167
5.3.5 Discussion ... 177
6. Geographic Information For Cartographic and Analytical Applications ... 180
6.1. Cartographic Applications ... 181
6.2 Analytical Applications ... 182
6.3 Multi-data Applications: Four Case Studies in the City of Lisbon ... 183
6.3.1 Building‘s Map Updating Using Aerial Photography ... 184
6.3.2 Alarm System For Land Use Land Cover Change in Urban Areas ... 186
6.3.3 Mapping Buildings‘ Solar Potential ... 186
6.3.4 Urban Environmental Indicators ... 189
6.4 Data Sets and Pre-Processing ... 191
6.4.1 Data Sets ... 191
6.4.2 Data Pre-Processing ... 192
6.5 Building‘s Map Updating Using Aerial Photography ... 199
6.5.1 Study Area and Data Set ... 199
6.5.2 Land Cover Classification ... 200
6.5.3 Land Cover Change Detection ... 203
6.6 Alarm System For Land Use Land Cover Change in Urban Areas ... 216
6.6.1 Study Area and Data Set ... 216
6.6.2 Land Cover Classification for 2005/06 ... 217
6.6.3 Quality Assessment of the Building Extraction ... 220
6.6.4 Map Updating ... 222
6.6.5 Quality of Detection of Building Change ... 225
6.6.6 User‘s Evaluation ... 227
6.7 Solar Potential Analysis ... 228
6.7.1 Study Area and Data Set ... 230
6.7.2 Solar Radiation at the Surface ... 231
6.7.2 Solar Radiation on the Roof-tops ... 235
6.7.3 Best Roof-top Locations for Solar Photovoltaic Systems ... 237
6.7.4 Energy Produced by Solar Photovoltaic Systems Located in the Most Suitable Roof-tops ... 239
6.8 Urban Environment Quality Indicators ... 241
6.8.1 Study Area and Data Set ... 242
6.8.2 Land Cover Extraction ... 243
6.8.3 Accuracy Assessment of Land Cover Map 2008 ... 248
6.8.4 Building Urban Indicators ... 249
6.8.5 Comparing Land Cover Map 2008 with Similar Maps ... 250
6.9 Conclusions ... 255
6.9.1 Extracting Geographic Information for Cartographic Applications ... 255
6.9.2 Extracting Geographic Information for Analytical Applications ... 256
7. Conclusions and Further research ... 259
Conclusions ... 259
Future work ... 261
REFERENCES ... 264
LIST OF FIGURES ... 294
LIST OF ABBREVIATIONS
ALOS Advanced Land Observing Satellite ALS Airborne Laser Scanning
ALUM Australian Land Use and Management Classification
ASTER Advanced Spaceborne Thermal Emission and Reflection Radiometer ATKIS German cartographic and topographic database (Amtliches
Topographisch-Kartographisches Informationssystem BAS Buildings, Annexes and Shacks
CARTUS-AML
Land Use Map of Lisbon Metropolitan Area (Carta de Uso do Solo da Área Metropolitana de Lisboa)
CCD Charge Coupled Device
CCDR Commissions for Regional Development (Comissão Coordenação para o Desenvolvimento Regional)
CLC CORINE Land Cover
CLUSTERS Classification for Land Use Statistics: Eurostat Remote Sensing Program
CNIG National Centre for Geographic Information (Centro Nacional de Informação Geográfica)
COS Land Cover Map of Portugal (Carta de Ocupação do Solo)
CP Control Point
DEM Digital Elevation Model
DGOTDU General Directorate of Territorial Management and Urban Development (Direcção-Geral do Ordenamento do Território e Desenvolvimento Urbano)
DGRF Forest Institute (Direcção Geral de Recursos Florestais)
DL Decree-Law
DMC Digital Mapping Camera
DN Digital Numbers
DR Regulatory Decree
DSM Digital Surface Model DTM Digital Terrain Model
EC European Commission
EEA European Environment Agency
e-GEO Geography and Regional Planning Research Centre
EO Earth Observation
ESA European Space Agency
EU European Union
FAO Food and Agriculture Organization GCP Ground Control Point
GDS Geographical Data Sets
GEOBIA GEographic Object Base Image Analysis
GEOSAT Methodologies to extract large scale GEOgraphical information from very high resolution SATellite images
GEOSS Global Earth Observation System of Systems
GI Geo-Information
GIS Geographic Information System GLCM Gray-Level Co-occurrence Matrix
GMES Global Monitoring for Environment and Security GPS Global Positioning System
HRV High Resolution Visible
I&CLC2000 IMAGE and CORINE Land Cover 2000
IGeoE Army Geographic Institute (Instituto Geográfico do Exército) IGP Portuguese Geographic Institute (Instituto Geográfico Português) IGT Territorial Management Instruments (Instrumentos de Gestão
Territorial)
IHS Intensity, Hue, Saturation INS Inertial Navigation System
IPCC Portuguese National Geodetic, Mapping and Cadastre Agency (Instituto Português de Cartografia e Cadastro)
IRS-1C Indian satellite
ISO International Standards Organization JRC Joint Research Centre
LBPOTU Urbanism and Planning Policy Framework Law (Lei de Bases da Política de Ordenamento do Território e Urbanismo)
LCM Land Cover Map
LCMGB Land Cover Map of Great Britain LCMUK United Kingdom Land Cover Map LGN Land Use Database of The Netherlands LiDAR Light Detection And Ranging
LULC Land Use and Land Cover
MAD Multivariate Alteration Detection
MAOT Environment and Territorial Management Ministry (Ministério do Ambiente e do Ordenamento do Território)
MSS Multispectral Scanning System MURBANDY
/ MOLAND
Monitoring Urban Dynamics/ Monitoring Land Use Changes
NASA National Aeronautics and Space Administration NDG Number of Different Grey-levels
nDSM normalized DSM
NDVI Normalized Difference Vegetation Index NIIRS National Imagery Interpretability Rating Scale
NIR Near-Infrared
NLUD National Land Use Database
NOAA National Oceanic and Atmospheric Administration NUTS Nomenclature of Territorial Units for Statistics
OOTU Monitoring Centre for Spatial Planning and Urbanism (Observatório do Ordenamento do Território e Urbanismo)
Pan Panchromatic
PCA Principal Component Analysis PCS Principal Component Substitution PDM Master Plan (Plano Director Municipal) PIF Pseudo-Invariant Features
PMOT Municipal Plans (Planos Municipais de Ordenamento do Território) PNPOT National Program for Planning and Territorial Management
(Programa Nacional de Planeamento e Ordenamento do Território) PP Design Plan (Plano de Pormenor)
ProCARTA Produção de Cartografia Topográfica Oficial a Escalas Grandes PROGIP Support Program on Computer Management of Municipal Plans PROSIG Support Program for the Creation of Local Nodes of SNIG PROT Regional Plans (Plano Regional de Ordenamento do Território) PU Urban Plan (Plano de Urbanização)
PVGIS Photovoltaic Geographical Information System
PWL PieceWise Linear
RAN National Agricultural Reserve (Reserva Agrícola Nacional) REN National Ecological Reserve (Reserva Ecológica Nacional)
REOT-M Status Report of City Planning (Relatório do Estado do Ordenamento do Território)
RFC Rational Function Coefficient RFM Rational Function Model RGB Red, Green, and Blue
RJIGT Judicial Regime of the Territorial Management Instruments (Regime Júridico dos Instrumentos Territoriais de Gestão)
SAR Synthetic Aperture Radar SMA Spectral Mixture Analysis
SNIG National Infrastructure for Geographical Information (Sistema Nacional de Informação Geográfica)
SNIT National System of Territorial Information (Serviço Nacional de Informação Territorial)
SPIDER Improving SPatial Information extraction for local and regional DEcision makers using very high resolution Remotely sensed data SPOT Satellite Pour l'Observation de la Terre
STRM Shuttle Radar Topography Mission TIN Triangulated Irregular Network
TM Thematic Mapper
TPL Thin-PLate
UDR Urban Dynamics Research
UK United Kingdon
URL Uniform Resource Locator USA United Sates of America
USGS United States Geological Survey
VHR Very-High Resolution
INTRODUCTION
Land Planning is a highly complex process aiming at a conceptual anticipation of future situations, through regulating and enforcing land use. Developing strategic orientations that induce future activities requires knowledge of the physical urban environment, and how it changes over time. These questions are inherently spatial in nature, but relevant geographic information is rarely available with the necessary detail (spatial, and temporal), making difficult the process of forming an opinion and subsequent decision-making.
Earth Observation (EO) is an independent data source, publicly available, which can help collect updated information at different levels of detail. However, images are
data not information, meaning that an image processing methodology must be selected and applied in order to transform image data into information pertinent for land planners. In similar contexts, such methodology should be replicable, leading to consistent and comparable products.
Remote sensing images, besides their mapping capabilities, can also be used in analytical situations. Urban planners need information on phenomena like the city‘s spatial arrangement, the available green area per capita, where traffic congestions can be improved, the dynamic evolution of the building construction activity, the implementation of regional/local strategies, the identification of spatial and temporal patterns of urban sprawl over long or short time periods, among many others. Remote sensing has the distinctive capability of providing a comprehensive set of tools for characterizing the Earth‘s surface, enabling production of specific-products for decision-makers.
repeating the classification process in subsequent time-periods is much favored. Nevertheless, land use mapping is an expensive process, and its cost is also dependent on the effort to classify with more or less detail the objects of interest. From a land planning perspective, it is worthwhile to investigate different levels of information abstraction regarding scale, class detail or minimum mapping unit, that allow characterizing the most common situations land planners have to deal with. Based on that identification, it is possible to orient the land use mapping towards different applications that require specific products. The identification of the processes and the characteristics that must be monitored will directly influence the effort and the time spent for land mapping and, consequently, the mapping cost.
The thesis was developed under the framework of the project GeoSAT – Methodologies to extract large scale GEOgraphical information from very high resolution SATellite images, funded by the Foundation for Science and Technology. The research project, that took place between 2008 and 2010, involved the Lisbon City Hall, and aimed at developing methods to expedite the production of geographic information for municipal planning and land monitoring. The project and the thesis work were hosted by e-GEO – Geography and Regional Planning Research Centre, from the New University of Lisbon. The centre has a long tradition in both theoretical and policy-oriented research on urban and regional development, being remote sensing one of the fields of interest and competence.
In the thesis context, some of the concepts used do not have yet a standard definition, requiring an initial clarification. The main data source about the Earths‘ surface used in this work is Very-High Resolution (VHR) images. The term VHR is used for images with spatial resolution equal or greater than 1 m. Furthermore, two terms are used as synonyms – feature and object. An image object is a group of pixels in a map. The pixels are grouped into meaningful objects based on homogeneity criteria according to their attributes, such as shape, color and relative position to other objects.
OVERALL RESEARCH OBJECTIVES
Land use information is a key factor in the spatial planning system. Knowledge regarding its extension, pattern, and modification over time, is the core of physical planning. Remote sensing data is the elected source of information about the Earth‘s surface, and the semi-automatic methodologies most suitable for extracting that information are the subjects of this thesis.
The thesis deals with the links between the following domains: land planning, geographic information science, remote sensing, land use, and land use mapping. The main objective is to develop methods for automatic extraction of geo-spatial information from aerial or satellite images, to be used for municipal planning. Evaluation of different land products, having distinct levels of detail, is performed, and presented as case studies.
A distinction between cartographic and analytical applications is made. For cartographic purposes, the geographic element that the municipalities most require information about is Buildings. The present framework, used to map buildings at the municipal level, is analyzed, and an alternative based on remote sensing data is proposed. In this situation, careful attention is paid to the correct identification and delimitation of the elements of interest (i.e., buildings), using positional, geometric and thematic accuracy indices. Regarding analytical applications, different situations that demand land use information, with different levels of detail, are presented. The attention in these cases is not on the compliance with map specifications, but rather to derive quantitative information, with known quality, based on VHR data that can be used in different decision-making tasks.
Based on the above discussion, the research objectives can be summarized as follows:
To contribute to solving the needs for updated land information;
To investigate which Territorial Management Instruments and which planning processes intended for the municipal scale, require geographic data, and how remote sensing can be used to provide such information;
To assess the needs of Portuguese municipalities regarding geographic information. A characterization of how the geo-data is valued and used in a municipal department allows inferring knowledge about what are the main concerns regarding these data. Furthermore, knowing what are the most used geographic elements and respective scales, as well as the required update period, can help in designing remote sensing-based products;
To provide a semi-automatic methodology for extracting geographic information, that allows a good balance between performance (quality vs. time), cost, and user-friendliness, since these constitute important criteria for adoption by a municipality department;
To analyze the constraints between map-scale issues and the detail of the information extracted for a certain application;
To propose a new approach for explicitly incorporating quantitative mapping standards in the quality assessment of large-scale elements extracted from VHR satellite imagery;
To identify and delimit urban changes using VHR geographic data, thus providing the basis for fast and effective visualization, a key element of building a land monitoring system based on EO data.
RELEVANCE AND CONTRIBUTIONS
activities for possible disasters like earthquake or flooding, all require expedite production of digital maps at large-scale.
Using remote sensing data to produce maps, based on semi-automatic methods, that comply with the thematic detail and the positional quality of the large scales used in the municipal planning (e.g., 1:10 000 and higher), is still a challenge. In this thesis, classification of remote sensing data is not proposed as an alternative process for replacing the present cartographic framework, which produces very detailed information, for many themes, and with very high quality. In fact there are still limitations concerning the effectiveness of full automatic methods, especially the ones aimed to be applied over a complex landscape containing many different classes of objects, also with different spectral characteristics. These methods should not be expected to deliver final products, but to facilitate image analysis and interpretation, in a more or less interactive workflow.
The contribution of the work presented here is rather the coexistence of two levels of information in the municipal Geographic Information System (GIS): a 1st level of official topographic cartography produced at least every 10 years with conventional and more accurate methods, and a 2nd level with less detailed thematic and geographic information but with a higher temporal resolution, with known accuracy specifications, from processing of mono VHR satellite images. Such level of information can be used for indicating places were potential changes have occurred and must be investigated by a technician that will decide upon its veracity, or to allow extracting quantitative/qualitative information about the evolution of land use patterns over time, or to supply other relevant data with geographic representation.
THESIS ORGANIZATION AND OUTLINE
presents the theoretical framework that supports the design and implementation of the applications that will be developed later as case studies.
Chapters 5 and 6 are the core part of this dissertation. Chapter 5 presents the land planning system in Portugal, and characterizes the geographic information necessary to implement it. Furthermore, the need for updated geographic information at the municipal level is assessed through a survey and the results are discussed. Chapter 6 presents four case studies to demonstrate the usefulness of geographic information extracted form VHR imagery, for cartographic and analytical applications, at the municipal level.
1. CONCEPTUAL FOUNDATIONS OF URBAN LANDSCAPE ANALYSIS BASED ON REMOTE SENSING DATA
The purpose of the present thesis is to study LULC mapping in urban areas, using VHR imagery data. Through LULC mapping, we can measure the extent and distribution of thematic classes, examine the interaction between those classes, identify suitable places for certain activities, detect changes, and plan for the future. Furthermore, LULC maps serve as basic data sets for the production of more complex information on other topics such as municipal plans for land management, or studies on environment impacts of new infrastructures like railroads or highways.
LULC mapping is generally done by processing imagery obtained from remote sensing instruments, like aerial photographs or satellite images. Traditionally, the cartographic framework is based on the visual analysis of aerial photographs, (Herold et al., 2003a). Alternatively, semi-automatic algorithms for digital image classification, together with visual analysis, can also be used for LULC mapping. The choice of aerial photographs for large scale mapping production is directly related to their high spatial resolution. Moreover, the satellite images have only recently begun to emerge as an alternative data source, due to technologic advances that allow capturing images with higher spatial resolutions.
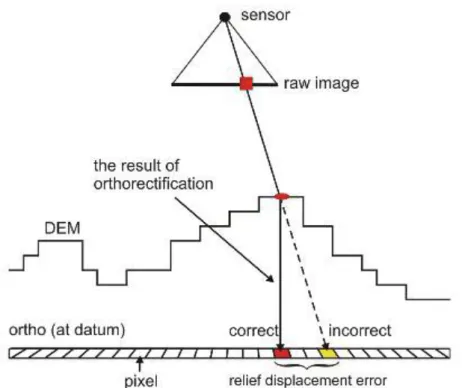
However, despite the emergence of new sensors with improved spatial characteristics and the rapid development of new digital image processing techniques, there is a time lag between the presentation of research results among the scientific community and its implementation by government agencies (Netzband et al., 2007). Furthermore, although high spatial resolution generally allows improved discrimination of urban elements, the effects of relief displacement, shadows from tall structures and other distortions can complicate the information extraction from VHR images of urban areas with tall buildings or significant relief.
The following issues should then be taken into account when evaluating the usefulness of EO images for urban mapping (Donnay et al., 2001):
What are the characteristic properties of urban objects that allow identifying and classifying them in the image data set?
Are the current methodologies for collecting thematic information from EO images appropriate to extract this kind of objects?
This chapter debates the concepts and techniques that characterize the detection and interpretation of urban elements in VHR remote sensing data. The following sections characterize the object of study - urban object - in its multiple facets. On one side, the spatial, temporal and spectral characteristics of the urban objects are formalized as well as its dynamics. On the other hand, it is described how the geographic information can be structured and analyzed in a GIS. Finally, an historical review of the contribution of remote sensing data in the study of urban elements is presented and the question of the adequacy and relevancy of the imagery analysis to study the urban scale is discussed. The last section presents the LULC maps available in Portugal, and analyses the national mapping projects, considering the data source for land information, the nomenclature, the methodologies used for mapping, and the technical specifications.
1.1 URBAN ENVIRONMENT
Although intuitively the identification of an urban area is a relatively easy task, its formalization is not. Indeed, there is no universal method for identification of urban areas (Toit and Cilliers, 2010). This concept tends to vary from country to country and is generally defined based on historical, political, cultural and demographic characteristics. For example, Peru defines an urban area based on the density of buildings (structures by area) while Japan identifies a region as urban based on the total number of inhabitants, and the United States uses the population density (Weeks et al., 2003). In Portugal, the population density is also adopted as the parameter that differentiates urban areas from rural ones.
The urban environment is a physical representation of human activities and as such is likely to be measured. There are a number of data sources that can be used to describe the variability, allowing the quantification of the urban environment. Examples are the census data (which identifies buildings and their uses), cadastral maps (that show properties subject to different taxes), or even maps of urban infrastructure such as water, sewer lines or high voltage power lines.
Alternative data sources are the images collected by remote sensing systems that allow inferring the urban element through the analysis of the spectral and spatial characteristics recorded. However, the images are "virtual" representations of the city, because the pixels quantify the surface status of the bodies through the coding of the intensity of the electromagnetic signal, and do not qualify the elements that compose the city. The intensity of the signal is encoded into digital levels which correspond to urban physical elements (buildings, streets, vegetation, water, etc.) having very different functions.
The next sections describe how remote sensing can be used to observe, estimate quantify and monitor changes over urban areas.
1.1.1TEMPORAL CONSIDERATIONS
When studying urban phenomena, it is necessary to assess what time, or time period, is more appropriate for analysis. This depends on the dynamics to be identified. Jensen and Cowen (1999) identified three types of temporal resolution when analyzing urban environments:
The first type relates to the dynamic characteristics of the processes of change in urban areas. If the goal is to monitor works on public roads, then the period of analysis may be a few months. However, if you want to monitor a process of urbanization, then the period of analysis may be a few years;
The second type of temporal resolution is the revisit range of urban space for data collection. This feature varies depending on the data source. If the selected source is satellite images, the temporal resolution varies from satellite to satellite, going from daily capture (QuickBird) to within three days (IKONOS-2) or longer periods. If the source is aerial photography, planning the aerial flight has an associated cost that must be taken into account. Furthermore, the need for field survey, also influence the frequency of data collection;
The third type of temporal resolution is related with the needs of planners and land managers. For the local level, it may be necessary to have updated information, e.g., on an annual basis, while on regional or national levels that requirement can be reduced to 5 years or a decade (e.g., definition of regional plans, updating cadastral information).
1.1.2SPECTRAL CONSIDERATIONS
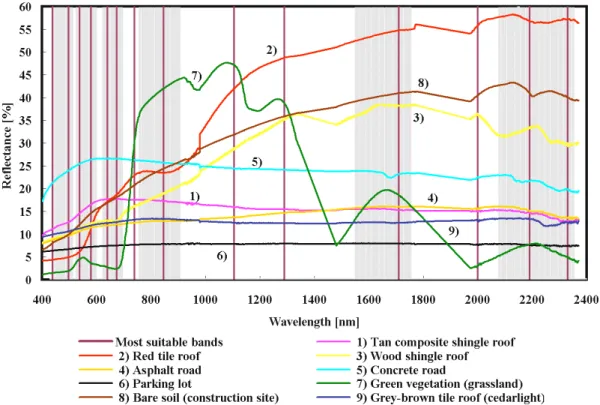
On the other hand, if the extraction method is imagery classification, than the spectral dimension is also very significant (Herold et al., 2003b). In fact, while high spectral resolution is not a rigid request for urban mapping; there are however, portions of the electromagnetic spectrum especially useful to extract certain types of urban cover. The identification of buildings is best achieved in real color or panchromatic images, while the identification of urban areas with green cover (e.g., leisure parks or single-family residences) is best accomplished by examining the visible and infrared regions of the spectrum.
To isolate the spectral signature of an urban object is relatively straightforward. But to consider only the spectral signature for feature extraction is much more difficult. There are several reasons for this fact. First, urban elements of the same LULC class (e.g., roofs), but having different angles, may have different levels of spectral reflectance (Figure 1). A roof of slate with zero degrees of tilt has a reflectance three times greater than the same roof of slate with a thirty degree tilt. The diffuse reflectance is therefore strongly influenced by the surface roughness of urban objects.
Wavelenght - nm Wavelenght - nm
Figure 1. Measures of reflectance of roofs typical of Spain and Southwest of France
Figure 2. Example spectra of typical urban land cover from the Santa Barbara urban spectral library (source: Herold et al., 2003b)
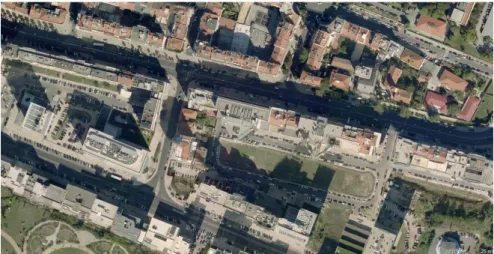
Figure 3. Example of a typical urban landscape in Lisbon city
Figure 4. Spectra of concrete surface, green vegetation and concrete surface shaded by tree from the Santa Barbara ASD urban spectral library (source: Herold et al., 2003b)
Figure 5. Shadowing effect in a dense urban area, located in Lisbon city
1.1.3SPATIAL CONSIDERATIONS
A photo-interpreter uses features such as tone, color, texture, shape, size, orientation, pattern, shadow, location and context of objects in urban areas to identify and assign a class (Jensen, 2005). The elements of geometric interpretation of image (shape, size, orientation, pattern and shadow) are particularly useful in VHR data. A general rule concerning the spatial resolution, based on the Shannon‘s theory of information, is the need for a minimum of four spatial observations (i.e., pixels) within an urban object to identify it. In other words, the spatial resolution of a sensor should be half the diameter of the smallest object of interest. For example, the identification of a terrace with a 5 m size requires an image with resolution greater than or equal to 2.5 m (Jensen and Cowen, 1999).
Welch (1982) identified the spatial resolution of remote sensing data as the most important factor for the study of urban areas, and suggested resolutions in the order of 5 to 10 m as being indicated to characterize urban environments. While in the 1980s/1990s this limitation existed in fact for satellite images, with the new generation of space-based sensors capturing images at resolutions up to 0.41 m (GeoEye-1), this restriction no longer subsists. However, how can one know what spatial resolution to use for a specific application? One way to assess the level of interpretation of an image is to use the Civil National Imagery Interpretability Rating Scale (NIIRS) developed and maintained by the American Committee on Imagery Resolution Assessments and Reporting Standards. NIIRS characterizes the usefulness of images for intelligence purposes. NIIRS uses a 10 level scale, with several interpretation tasks or criteria at each level. These criteria indicate the amount of information that can then be extracted from an image, at a given interpretation level (Irvine, 2003).
bands merged with the panchromatic image) due to enhanced spatial resolution. For comparison, a Satellite Pour l'Observation de la Terre (SPOT) image of the same area, with the same characteristics (multispectral, panchromatic and pansharp bands) but with 20 m of spatial resolution, was also analyzed, having completed only the first and second levels of NIIRS.
The company Emap International (Nale, 2002) also made an assessment of QuickBird imagery (panchromatic and multispectral bands) and characterized its interpretation into NIIRS levels 5/6. Those levels indicate that, for example, electric or telephone poles (level 5), or individuals when not in group (level 6), can be identified.
Originating in landscape ecology, spatial metrics can be employed to measure the heterogeneity of landscapes at different spatial scales based on categorical patches or elements. These are defined as quantitative indices that describe the structure and pattern of a landscape, and were developed based on the Shannon‘s theory of information and the fractal geometry. The landscape description is based on the concept of patch. A patch is then defined as the basic element in a landscape. A landscape does not contain a single patch mosaic but rather a hierarchy of patch mosaics across a range of scales. Therefore, patch boundaries are only meaningful when referenced to a particular scale. A spatial metric can then quantify the spatial heterogeneity of individual patches, all patches of the same class or the entire landscape as a collection of patches (Herold et al., 2003a).
Herold et al. (2003a) conducted a study where 22 metrics were tested in order to characterize the urban environment with IKONOS images covering 170 km of the coast of Santa Barbara, California, United States of America (USA). The authors concluded that building configuration was best characterized by area coverage, the regularity of the spatial arrangement (Nearest Neighbor metrics), the dominance of one large building structure (largest patch index), and the spatial heterogeneity of the individual building objects (edge density). Contagion, as a measure of the overall spatial heterogeneity of a land-use region, provided another important land-use discriminator.
Table 1. Examples of landscape metrics used in urban studies
Metric Description
Percentage of Landscape Sum of area of a given class (m2) divided by the total area and multiplied by 100 (to convert to a percentage)
Patch density Number of patches of a given class divided by total
landscape area
Mean patch size Average size of patches of a given class
Edge density Sum of length (m) of all edge segments in the landscape,
divided by the total area of the landscape (m2) and multiplied by 10,000 (to convert to hectares)
Largest patch index Area (m2) of the largest patch of a given class, divided
by the total landscape area (m2) and multiplied by 100 (to convert to a percentage)
Nearest Neighbor distance Distance (m) to the Nearest Neighbor patch of the same
type, based on shortest edge-to-edge distance
Fractal dimension Twice the logarithm of patch perimeter (m) divided by
the logarithm of patch area (m2)
Shape index Patch perimeter (m) divided by the square root of patch
area (m2), adjusted by a constant to adjust for a circular standard (vector) or square standard (raster).
Cohesion Standard Perimeter-area ratio
Contagion Equals 1 plus the sum of the proportional abundance of
each patch type multiplied by number of adjacencies between cells of that patch type and all other patch types, multiplied by the logarithm of the same quantity, summed over each patch type; divided by 2 times the logarithm of the number of patch types; multiplied by 100 (to convert to a percentage).
Measures the probability that a cell of a patch is adjacent to another cell of a patch from the same class
Patch richness Number of different patch types present within the
1.1.4URBAN CHANGE DYNAMICS
Information derived from remote sensing can potentially give a synoptic, consistent and instantaneous view of the surface at one, or more scales. Through the combination of such views, changes in the urban status can be detected, making urban remote sensing a valuable contribution to research in urban geography and planning. Mapping land use change provides a historical perspective and an assessment of the spatial patterns, rates, correlation, trends, and impacts of that change.
When characterizing urban dynamics, two key elements must be considered: the available space in which the process of growth occurs, and the period during which this development takes place (Batty et al., 1999). There are thus two ways to address the urban dynamics: the temporal and spatial dynamics.
The temporal dynamics can be characterized as fast, medium or slow, depending on the time frame of occurrence of the territory‘s transformation. Temporal urban databases have immediate applications in monitoring urban sprawl, watershed analysis, environmental assessment, hydrologic modeling, land surface degradation, and developing predictive modeling techniques to better forecast future areas of urban growth.
The spatial dynamics can occur in two ways. On one hand, there may be the occupation of new territories, e.g., formerly rural areas are converted to new urban uses. On the other hand, there may be a more intensive occupation of a site, while maintaining the same land use, e.g., changing from a residential area of low-density to a higher-density one. Any of these changes leads to a dynamic history of urban expansion or intensification, respectively.
1.2 CONTRIBUTION OF REMOTE SENSING DATA TO STUDY THE URBAN CONTEXT
1.2.1AERIAL AND SPACEBORNE IMAGES
Remote sensing is the observation of the elements in the surface (land and ocean) and atmosphere, from a distance, using sensors onboard airborne or spaceborne platforms. The difference between the images captured from these two platforms is in their physical collection. In fact, today one can choose to use images collected by frame-based aerial cameras, Charge Coupled Device (CCD) digital cameras, thermal cameras, LiDAR, laser scanner, pushbroom scanners or by Synthetic Aperture Radar (SAR). In this section we will focus our attention in analogue and digital cameras.
Aerial photographs are obtained by airborne sensors. Of fundamental importance to the quality of aerial photographs is the camera used to obtain the images. Two broad types of airborne cameras are used: based and digital cameras. In analogue film-cameras, the collection of information occurs through a chemical reaction that occurs in the photographic emulsion. With photography, there is the possibility to vary the type of lens. The goal is to choose different focal distances depending on the mission. Thus it is possible to vary the acquisition scale while maintaining the flight height or vary the height of the flight maintaining the scale. The films used in land cover mapping campaigns are generally sensitive to the visible and near infrared regions of the electromagnetic spectrum. Alternatively, digital cameras can also be used: the image acquisition is done by charge-coupled devices (CCD sensors), and the spectral and spatial resolutions are characteristics of the camera (sensor) and not the film. In digital images, the recorded reflectance is stored digitally instead of on film. But typically, panchromatic or color digital pictures are obtained.
households. The authors concluded that there was a linear relationship between density and the average value of homes, the average value of hire contracts, the average family income and the average number of rooms per unit. Lo (1979) studied the usefulness of aerial photographs of historic dates to assess the patterns of distribution of illegal neighborhoods and quantify changes in Kai Tak, Hong Kong. Lo (1989) estimated the population in Rhode Island, USA, using census data to extract the houses from aerial photos.
However, in most applications with aerial photography, information is obtained through visual analysis done by specialized technicians. This technique requires much training and experience and is not necessarily replicable from place to place and from time to time. Also, human interpretations are subjective, and are vulnerable to inconsistency and error. As a result, there is a need for new approaches to reduce or eliminate these difficulties associated with traditional aerial photograph analysis (Morgan et al., 2010).
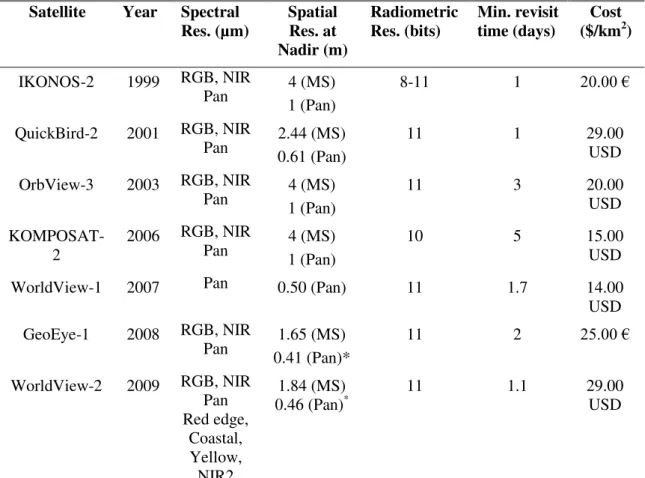
more pixels wrongly classified (Toll, 1985, Martin et al., 1988). These events led to the development of sensors more accurate than those of the second generation. This third generation of sensors took advantage of the end of the Cold War that favored the de-classification of military technology (e.g., images from the 1960s to 1980s, captured by the Corona spy satellite were released). Also, from a space borne perspective, this became possible in 1994, when the United States government made a decision to allow commercial companies to market high-spatial resolution satellite remote sensing data for civil applications (Glackin, 1998). In particular, the IKONOS-2 satellite (Space Imaging Inc.), launched in 1999 with 4 m resolution in multispectral mode and 1 m in panchromatic mode, and the QuickBird-2 satellite (DigitalGlobe Inc.), launched in 2001 with 2.44 m resolution in the multispectral mode and 0.61 m in the panchromatic mode, allowed the scientific community to explore more detailed mapping procedures. These new sensors for EO now meet the recommendations of Welch (1982) concerning required resolutions of the order of 5 m, or less, for urban studies.
1.2.2TECHNICAL CONSIDERATIONS
urban context as its spatial scale allows a more detailed mapping of individual elements when compared with that obtained with medium-resolution images (Thomas et al. 2003).
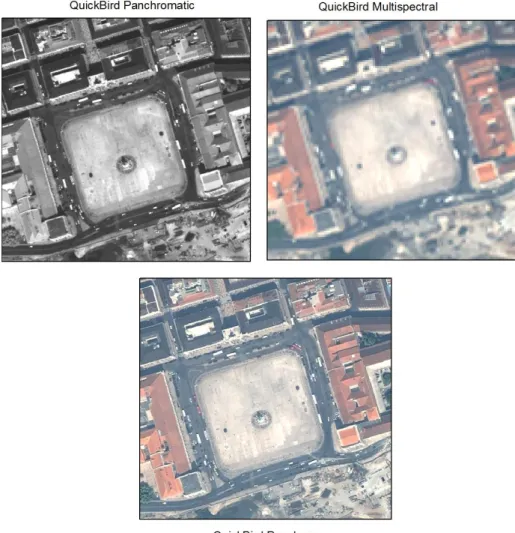
Figure 6. Information content variation due to different spatial resolutions
Paradoxically, this increase in spatial resolution did not produce maps with higher levels of quality (Barnsley and Barr, 2000). Indeed, initial studies performed on images with medium-resolution, with traditional multispectral classifiers (i.e., at the pixel level), in urban areas, produced maps with low accuracy (Forster, 1985; Toll, 1985; Martin et al., 1988). The explanation for this fact lies in the "noise" introduced by the increase in resolution, i.e., many areas that would be uniform in images of previous sensors become spectrally heterogeneous in higher spatial resolution images. The low performance of the images in the urban studies contributed to the "mistrust" and the skepticism with which the majority of planners look at this data source (Donnay et al., 2001).
In fact, in that type of classification, those pixels corresponding to the houses will be classified as urban areas and those pixels corresponding to the gardens will be classified as vegetation. This example shows how complex is the extraction of thematic information in urban areas, given the mixture of artificial and natural elements. Then, a higher level of structural information plays a key role in the LULC classification. To facilitate the understanding and identification of spatial patterns and/or spatial arrangement of artificial elements, additional spatial indicators have to be extracted from images.
While visual analysis continues to be widely used, there was a large investment in developing methods for automatic classification of VHR images. In fact, VHR imagery, like aerial images, have been available for the general public for decades, but with the commercial availability of VHR satellite images (e.g., IKONOS-2 satellite in 1999, and QuickBird in 2001), the imagery prices went down and a mass market emerged. This situation favored the development of new integrated methodologies (e.g., GEographic Object Base Image Analysis – GEOBIA) and new application fields, which had previously been the domain of airborne remote sensing and could now be tackled by satellite remote sensing (Moeller and Blaschke, 2006; Blaschke, 2010). However, methodologies such as segmentation, edge-detection or feature extraction had already been applied in remote sensing image analysis for decades (Blaschke, 2010).
The GEOBIA then emerged as a new alternative to the pixel-based classifiers. Although sometimes there may be objects with the size of one pixel, the applications typically seek to identify elements that are composed of multiple pixels such as roads, buildings, crops, etc. These applications require the classification of groups of contiguous pixels that are a part of an element. This leads to a new concept of classification, where pixels are grouped into objects based on information available from spectral, textural, contextual and spatial domains (Blaschke and Strobl, 2001).
on-and 3) the availability of powerful, off-the-shelf software that bridges image processing and GIS functionalities in an object-based environment, have made the GEOBIA an area of research possible (Blaschke, 2010).
1.2.3URBAN REMOTE SENSING APPLICATIONS
Remote sensing data is widely used when geographic information is required. Areas of application include forestry, agriculture, climatology, oceanography, geomorphology, etc. When it comes to the urban environment, the applications described in the literature can be grouped, according to their purpose, in mapping processes or quantification processes.
The following lines of investigation address the most common applications of remote sensing in urban context, whose main goal is to classify and map the surface:
Identify and classify land use and land cover (Herold et al., 2002; Caprioli and Tarantino, 2003; Misakova et al., 2006);
Land cover change detection (Goetz et al., 2003; Bailloeul et al., 2005, Bianchin and Bravin, 2004);
Urban green area mapping (Irani and Galvin, 2002; Mathieu et al., 2007, Zhang and Feng, 2005);
Site suitability analysis (e.g., roads, dumps, communication networks) (Ramalingam and Santhakumar, 2000; King and O‘Hara, 2002; Giap et al., 2003).
The following studies can be representative of those applications whose final goal is to quantify the properties of the surface:
Mapping sealed areas for runoff estimation (Trauth et al., 2001; Bauer et al., 2004; Sawaya et al., 2003);
Analyzing flood risk and damage assessment due to natural catastrophes (Taubenböck et al., 2006; Van der Sande et al., 2003; Sakamoto et al., 2004);
Calculating taxes or subsides based on field structures (Argerich, 2004; European Commission, 2005; Carlee and Wolff, 2005; Jain, 2008);
Evaluating urban sprawling (Herold et al., 2001; Viet et al., 2006; Moeller, 2005; Jat et al., 2008);
Verifying legislation compliance (Karathanassi et al., 2003, Purdy, 2009)
Several research projects/programs, that use remote sensing data for urban applications, are described in the literature. Based on its relevance, the following projects stand out:
SPIDER Project (Improving SPatial Information extraction for local and regional DEcision makers using very high resolution Remotely sensed data), funded by the Belgian Science policy, between 2002 and 2005. The project aimed at improving spatial information extraction for local and regional authorities using VHR data, and to develop prototype versions of products with added-value that fulfill some of the actual information needs, as expressed by Belgian authorities. The projects achievements included: 1) a report based on a survey made to the representatives of local and regional authorities, for the assessment on their needs in geographic information; 2) a workflow for building Digital Surface Models and orthoimages from IKONOS data; 3) semi-automatic strategies to extract land cover classes in urban context form QuickBird images; and 4) mapping techniques for land cover extraction based on high and very-high resolution data combination (http://www.vub.ac.be/spider/);
MURBANDY/ MOLAND Project (Monitoring Urban Dynamics/ Monitoring Land Use Changes), financially supported by the European Commission (EC) and the Joint Research Centre (JRC), was initiated in 1998 with the aim of providing a spatial planning tool that could be used for assessing, monitoring and modeling the development of urban and peri-urban environments. Until now, the MOLAND methodology was applied to an extensive network of cities and regions, covering a total of 50 000 km2 (http://moland.jrc.it/);
EURMET Project (Urban Sprawl of Major Cities in South West Europe), funded by the EC, between the period 2003-2006, aimed at characterizing the peri-urban areas of 10 European cities, using context information and spatial structure (http://www.interreg-sudoe.org/);
comparisons. The first phase (2003-2005), called GMES Urban Services, was intended to demonstrate a portfolio of products derived from satellite imagery and other sources in cooperation with a group of users (cities and regional authorities). Among others, large scale land use maps, land use change maps and monitoring of urban planning, were contemplated. Phase two (2005-2007), called GSE-Land, addressed among others, the European Urban Atlas. This mapping service offers a collection of land use maps of the main urban areas in the European Union (EU) with more than 100.000 inhabitants. It offers reliable and comparable urban planning information delivered through GMES. More than 300 maps of major cities will be available by 2011. The Urban Atlas has potential applications in several fields, including a deeper understanding of climate change, and offers a sound basis for calculating spatial statistic and the revision of urban plans. The methodology used to extract information included image segmentation, classification and visual interpretation (http://www.gmes-gseland.info/);
UDR program (Urban Dynamics Research), funded by the United States Geological Survey (USGS) studies the landscape transformations induced by the growth of metropolitan regions over time, in the USA. Retrospective urban land use databases, that reflect several decades of change, were produced using sources such as historical maps, aerial photographs, and Landsat satellite data. These databases were then used to analyze the effects of urbanization on the landscape, and to model urban growth and land use change under alternative growth scenarios. The databases developed by the UDR program contain interpretations of urban extent, transportation routes, water features, and other important land uses, for use in GIS. Digital animations are available to help visualize the temporal patterns inherent in the data, as well as land use change models and further documentation (http://landcover.usgs.gov/);
characterized trough land cover classification, done at the pixel level by an expert system. Based on these land cover maps, metrics were extracted to allow global comparison of all cities. For the 100 cities, the effects of urbanization were compared, and standardized urban remote sensing data sets were made available for the international community. This included temperature, vegetation, land classification, and social data. More recently, the program was redefined, and a greater amount of remote sensing data was contemplated (Moderate Resolution Imaging Spectroradiometer - MODIS, Landsat, aerial photography, etc.) to characterize and model the urban development trends and the resilience to natural environmental threats. The main results of the project to date include the development of knowledge-based and object-oriented LULC classification algorithms that are generally applicable to all urban centers (http://100cities.asu.edu/).
Based on the projects mentioned above, one notes a growing interest in using satellite images with spatial resolutions compatible with the study of urban areas. These images seem to be replacing aerial photographs as a source of information in applications whose purpose is the classification of land surface by visual analysis (e.g., Project MURBANDY/MOLAND). On the other hand, automatic processing is emerging as an alternative to the manual process (e.g., Project EURMET).
1.3 THEMATIC LAND USE AND LAND COVER MAPS IN PORTUGAL
There are many sources of information on LULC in Portugal, varying in scale, nomenclature, date, and data source. This section is intended to summarize the most important cartographic sources available in mainland Portugal, identifying products at national and regional levels, and some maps produced under research projects.
small (< 1:100 000) (e.g., National Forest Inventory) or because the nomenclature does not describe in detail the urban environments (e.g., Land Cover Map 1995 for Algarve). It is also excluded from this analysis, the cartography produced in the framework of the Master Plan (Plano Director Municipal– PDM), given the great variability existing in the 308 municipalities.
The CLC map was produced for mainland Portugal, in the framework of the European project CORINE. The CLC reports the inventory on land cover, at a scale of 1:100 000, using 44 classes at level 3 of the CORINE nomenclature. The technical characteristics are: vector model, with minimum unit of 25 ha and minimum spacing between lines of 100 m. The CLC methodology is based on visual analysis of satellite imagery, using ancillary information. The first version dates from the 1990‘s. In 1999, the European Environment Agency (EEA) and the JRC launched the IMAGE and CORINE Land Cover 2000 (I&CLC2000) project with the main goal of updating to 2000, the existing CLC mapping and to collect information on the land cover changes in Europe that took place between the two dates (1990-2000). The change detection process and the mapping of the land cover changes was carried out by means of image comparison, using computer assisted image interpretation tools. Among the 44 classes available in CLC‘s more detailed level, 11 correspond to classes of urban land use and land cover. The Overall Accuracy of the thematic mapping CLC2000 for Portugal, on the 3rd level of nomenclature, was 83% with a confidence interval of 80.47 to 85.20 (Painho et al., 2005). Presently, three CLC maps are available for Portugal: CLC1990, CLC2000 and CLC2006. Furthermore, there is also two Land Cover Changes, over the period 1990-2000, and 2000-2006, with a minimum mapping unit change set to 5 ha.
posteriori classification system, while allowing greater adaptation of the nomenclature to the reality, leads to a high number of classes. It presents 78 classes of LULC that can be combined with additional information (e.g., forest density) to produce a classification code for each homogeneous zone. The legend provides a variety of combinations between different types of coverage, totaling more than 800 different classes. Still, 33 classes of urban LULC in the 5th level were identified. However, in 1998, only 50% of
the territory was covered, and more recently were released more mapped areas, including those covering the municipalities of Cascais and Sintra. As for the values of accuracy, there is no reference to the quality of this map. Nowadays, a new version - the 2007 version (COS2007) – is being produced, based on orthoimages, derived from aerial coverage produced by the Forest Institute (Direcção Geral de Recursos Florestais
- DGRF) and IGP for 2004, 2005 and 2006. It is expected this new version for the end of 2011. This new version no longer includes the discrimination of the cover degree, and thus is limited to 192 classes in the most disaggregated level, i.e., it changed for an
a priori classification. The urban use is represented by the level 1 class "Artificial areas" and is divided into 33 subclasses, at level 5.
A Land Cover Map for the District of Évora was produced by the Association of Municipalities of the District of Évora, using the 2004 orthophotos from DGRF/IGP. The mapping process was based on visual analysis at a 1:10 000 scale and minimum unit of 0.5 ha. The nomenclature resulted from an adaptation of the CLC nomenclature for the map scale. The most disaggregated level provides nearly 95 urban classes (Guiomar et al., 2006).
The Urban Atlas contains information derived by visual interpretation mainly of EO data with support by other ancillary data, for the cities of Coimbra, Braga, Lisbon, Setúbal, Aveiro and Faro. The urban classes are available with a minimum unit of 0.25 ha, 1 ha for other classes (agriculture, forests or semi-natural areas, wetland and water), and minimum spacing between lines of 10 m, at 1:10 000 scale. For the six Portuguese cities, a map for 2007 is available. The EO data used was from the Advanced Land Observing Satellite (ALOS) sensor, with 2.5 m resolution, and the map had an Overall Accuracy of 85.2% for the city of Lisbon (Meirich, 2008). Furthermore, any data model of the Urban Atlas is, in a higher level of aggregation, compatible with the CLC.
The EURMET project produced two maps for Portugal: one for the Metropolitan Area of Lisbon and another for the Metropolitan Area of Oporto. The maps were produced by object oriented analysis of SPOT 5 images, from 2004, according to a model compatible with the CLC nomenclature. The nomenclature was sub-divided into four levels of detail, being identified, in the 4th level, 10 categories of urban LULC. Global estimates of accuracy in the first level, for all cities, are of 70% compliance (Albert, 2005).
The MURBANDY/MOLAND cartography includes the city of Oporto, the Peninsula of Setúbal and part of the Algarve region (between Vila Real de St. António and Albufeira). For each area, a LULC map was produced, with a minimum unit of 1 ha for urban areas and up to 3 ha for rural areas, at 1:25 000 scale, for the reference year (1997 for Setúbal and Oporto and 1998 for the Algarve) and for historical dates. The proposed nomenclature was based on the CLC nomenclature, with a more detailed fourth level for artificial areas that identified 10 categories of urban LULC. All maps were obtained by visual analysis of aerial photographs and orthophotos and one high spatial resolution panchromatic image of the Indian satellite IRS-1C, with 5.8 m resolution (Caetano et al., 1999). However, the MURBANDY cartography has no associated quality information.
Since the object of study is the use of geographic information for local applications, the LULC maps included in the PDM‘s framework, although not within the scope of national program or investigation project, are also presented in this section.
March 2, which mentioned that classes should be defined based on the dominant use: ―built-up‖, ―urban‖, ―industrial activity‖, ―extractive industrial activity‖, ―agriculture‖, ―forestry‖, ―cultural and natural‖, and ―vacant land‖ for future infrastructures. This decree was later repealed by the Law on Spatial Planning and Urbanism (Law 48/98, August 11) and the Decree Law 380/99, September 22. The land was then classified into ―urban‖ and ―rural‖. The urban land includes ―urbanized areas‖, ―land set aside‖ for construction and ―land allocated to the ecological structure‖, while the rural land includes ―forest‖ and ―agricultural areas‖, the ―mining areas‖, the ―industrial activities‖, the ―natural spaces‖ and ―infrastructure‖ that do not involve classification as urban land. This new classification appears in the 2nd generation of PDMs that is now being completed.