Diversity of Saccharomyces cerevisiae strains isolated of the spontaneous
fermentation of cachaça from northeastern Brazil
Diversidade de linhagens de Saccharomyces cerevisiae isoladas de fermentações
espontâneas de cachaça do nordeste Brasileiro
DOI:10.34117/bjdv5n11-348
Recebimento dos originais: 07/10/2019 Aceitação para publicação: 28/11/2019
Alice Ferreira-D’Silva
Doutora em Microbiologia pela Universidade Federal de Minas Gerais. Instituição: Universidade Estadual de Feira de Santana.
Endereço: Programa de Pós-Graduação em Biotecnologia, Avenida Transnordestina, s/n, Novo Horizonte, Feira de Santana, BA, 44036900, Brazil.
E-mail: aliceferreiradsilva@gmail.com
Fernanda Badotti
Doutora em Microbiologia pela Universidade Federal de Minas Gerais. Instituição: Centro Federal de Educação Tecnológica de Minas Gerais.
Endereço: Av. Amazonas, 5.253, Nova Suiça, Belo Horizonte, MG, 30421-169, Brazil. E-mail: fbadotti@cefetmg.br
Carla Santos Ribeiro Pinheiro
Doutora em Biotecnologia pela Universidade Estadual de Feira de Santana. Instituição: Universidade Estadual de Feira de Santana.
Endereço: Programa de Pós-Graduação em Biotecnologia, Avenida Transnordestina, s/n, Novo Horizonte, Feira de Santana, BA, 44036900, Brazil.
E-mail: crlribeiro@gmail.com
Cleber Miranda Gonçalves
Doutor em Biotecnologia pela Universidade Estadual de Feira de Santana. Instituição: Universidade Estadual de Feira de Santana.
Endereço: Programa de Pós-Graduação em Biotecnologia, Avenida Transnordestina, s/n, Novo Horizonte, Feira de Santana, BA, 44036-900, Brazil.
E-mail: cleber.miranda@ifs.edu.br
Frederic Mendes Hughes
Doutor em Ecologia, Conservação e Manejo da Vida Silvestre pela Universidade Federal de Minas Gerais.
Instituição: National Institute of the Atlantic Forest – INMA Endereço: Av. José Ruschi, Santa Teresa, ES, 29650-000, Brazil.
E-mail: fredericmhughes@gmail.com
Doutor em Microbiologia pela Universidade Federal do Rio de Janeiro. Instituição: Universidade Federal de Minas Gerais.
Endereço: Departamento de Microbiologia, Instituto de Ciências Biológicas, C.P. 486, Belo Horizonte, MG, 31270-901, Brazil.
E-mail: carlrosa@icb.ufmg.br
Aristóteles Góes-Neto
Doutor em Botânica pela Universidade Federal do Rio Grande do Sul. Instituição: Universidade Estadual de Feira de Santana.
Endereço: Programa de Pós-Graduação em Biotecnologia, Avenida Transnordestina, s/n, Novo Horizonte, Feira de Santana, BA, 44036-900, Brazil.
E-mail: arigoesneto@icb.ufmg.br
Ana Paula Trovatti Uetanabaro
Doutora em Ciência de Alimentos pela Universidade Estadual de Campinas. Instituição: Universidade Estadual de Santa Cruz.
Endereço: Programa de Pós-Graduação em Biologia e Biotecnologia de Microrganismos, Departamento de Ciências Biológicas, Campus Soane Nazaré de Andrade, Rod. Jorge Amado, Km
16 - Salobrinho, Ilhéus - BA, 45662-900, Brazil. E-mail: aptuetanabaro@gmail.com
ABSTRACT
Cachaça is a beverage obtained by distilling fermented sugar cane juice. The state of Bahia in northeastern Brazil is the second-largest producer of traditional cachaça, and this region has the potential to improve the quality and quantity of its beverage production. The aim of this study was to analyze the genetic diversity of Saccharomyces cerevisiae populations isolated from must in six distilleries in Bahia using mitochondrial DNA restriction fragment length polymorphism (mtDNA-RFLP). Among the three hundred and thirty S. cerevisiae strains isolated, mtDNA-RFLP analysis identified a total of 30 molecular patterns. Analysis of molecular variance (AMOVA) revealed that the greatest genetic variation was found among, rather than within, the populations. Population structure analyses showed the presence of three distinct gene pools, thereby corroborating the AMOVA results. This study represents an important contribution to better understanding the molecular characterization and genetic variability of S. cerevisiae strains during the fermentation of cachaça. The dominant molecular patterns identified here may be used to select S. cerevisiae strains that could improve the quality and volume of traditional cachaça production in Bahia.
Keywords: traditional cachaça, Saccharomyces cerevisiae, molecular characterization,
mtDNA-RLPF
RESUMO
A cachaça é uma bebida obtida pela destilação do suco de cana de açúcar fermentado. O estado da Bahia, no nordeste do Brasil, é o segundo maior produtor de cachaça tradicional, e essa região tem potencial para melhorar a qualidade e a quantidade de sua produção de bebidas. O objetivo deste estudo foi analisar a diversidade genética de populações de Saccharomyces cerevisiae isoladas de mosto em seis destilarias da Bahia, utilizando polimorfismo de comprimento de fragmento de restrição de DNA mitocondrial (mtDNA-RFLP). Entre as trezentas e trinta cepas de S. cerevisiae isoladas, a análise do mtDNA-RFLP identificou um total de 30 padrões moleculares. A análise de variância molecular (AMOVA) revelou que a maior variação genética foi encontrada entre as populações, e não dentro delas. As análises da estrutura populacional mostraram a presença de três conjuntos genéticos distintos, corroborando os resultados da AMOVA. Este estudo representa uma contribuição importante para o melhor entendimento da caracterização molecular e variabilidade
genética de linhagens de S. cerevisiae durante a fermentação da cachaça. Os padrões moleculares dominantes identificados aqui podem ser usados para selecionar linhagens de S. cerevisiae que possam melhorar a qualidade e o volume da produção tradicional de cachaça na Bahia.
Palavras-chave: cachaça tradicional, Saccharomyces cerevisiae, caracterização molecular,
mtDNA-RLPF
1 INTRODUÇÃO
According to Brazilian legislation, normative instruction number 13 of 29 June 2005, cachaça is a beverage with an alcoholic content of between 38 and 48 %, and it is made by distilling the must from fermented sugar cane juice in copper alembics. Brazil produces approximately 1.3 billion liters of industrial and traditional cachaça per year. The state of Bahia in northeastern Brazil is currently the second-largest producer of traditional cachaça. Bahia’s market produces approximately 1.8 million liters of small-scale, craft-produced cachaça. It is estimated that around 300 small rural establishments are involved in the production of sugar cane derivatives (molasses, unprocessed brown sugar, and cachaça), employing approximately 60,000 people. Although current production is less than two million liters, the total production capacity of the state is 3.5 million liters per year (http://www.sicm.ba.gov.br).
Traditional distilleries in Brazil produce the beverage by spontaneous fermentation or, less frequently, using baker’s yeast. The natural starter culture is prepared by various methods, including developing the fermentative microbiota in the sugar cane juice alone or mixing the sugar cane juice with crushed corn and rice or soy meal. This process occurs inside the fermentation vat and can last from 5 to 20 days (until the yeast population is sufficient to initiate the fermentative cycle). Fresh sugar cane juice diluted to 16° Brix is added to this natural starter culture, and after 18-30 hours, 4/5 of the fermented must is distilled in copper alembics, and fresh sugar cane juice is added to start a new fermentation cycle (eg. Pataro et al. 2000, 2002, Badotti et al. 2010,Barbosa et al. 2016).
The traditional alcoholic fermentation process for cachaça production involves many different yeast species with an overwhelming prevalence of S. cerevisiae. Different indigenous S.
cerevisiae strains grow in the vat during the production period, and each of these strains may
contribute to the quality of the cachaça(eg. Pataro et al., 2000; Gomes et al., 2007, Barbosa et al. 2016, Araujo et al. 2018).
The high genotypic diversity of microbes present during the cachaça fermentation season strongly indicates the need to differentiate S. cerevisiae strains. Molecular polymorphic analyses is essential to characterize individuals within a species. Mitochondrial DNA restriction analysis (mtDNA-RFLP) has been extensively used to characterize and differentiate indigenous S. cerevisiae strains(eg. Badotti et al., 2010, Barbosa et al. 2018). The main objectives of this study were to
determine the diversity of S. cerevisiae strains present in cachaça distilleries located in northeastern Brazil by mtDNA-RFLP.
2 MATERIALS AND METHODS
Isolation and physiological identification of Saccharomyces cerevisiae strains
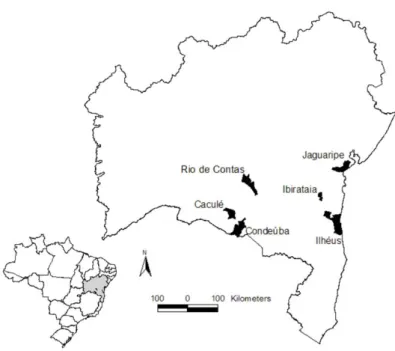
The S. cerevisiae strains were isolated from must in six cachaça distilleries in the state of Bahia, Brazil (Figure 1). The distillery 1 is localized in Ibirataia (39° 40' 20" W and 13° 56' 48" S), the distillery 2 in Jaguaripe (38° 53’ 45`` W and 13° 06' 47" S), the distillery 3 in Ilhéus city (39° 11' 36" W and 14° 52' 59" S), the distillery 4 in Condeúba (41° 58' 19" W and 14° 54' 09" S), the distillery 5 in Caculé (42° 13' 23" W and 14° 30' 02" S) and the distillery 6 in Rio de Contas city (41° 48' 46" W and 13° 35' 11" S). The samples were collected at every 2° Brix decrease from the beginning of spontaneous fermentation until the end of the cycle. The initial sugar concentration in the fermentation process varied from 10o to 23o Brix in the distilleries studied. The concentration of soluble solids (oBrix) was measured using a saccharimeter. Serial 10-fold dilutions were aseptically spread in triplicate onto SCY agar (10 % sugar cane juice, 0.1 % yeast extract, 2 % agar and 0.01 % chloramphenicol). The plates were incubated at room temperature (25 + 3o C) for 2 days. Plates containing 30 to 300 colonies were examined, and five isolates of the most prevalent morphotype were isolated and purified on the basis of cultural characteristics. When possible, at least three colonies of the other morphotypes were also selected for further analysis.
S. cerevisiae isolates were purified using modified Sabouraud agar (2 % glucose, 0.5 % yeast
extract, 1 % peptone and 2 % agar). For cryopreservation, the pure cultures were inoculated in GYMP medium (2 % glucose, 0.5 % yeast extract, 1 % malt extract, and 0.2 % sodium phosphate) at 28 °C under agitation (200 rev.min-1). After 24 hours (h) incubation, 15 % sterile glycerol was added, and the tubes were stored at -85 °C. The S. cerevisiae strains were identified using physiological characters and taxonomic keys by Kurtzman et al. (2011). The isolates were deposited in the Culture Collection of Microorganisms of Bahia (CCMB / UEFS, Bahia, Brazil).
Figure 1. Map of the state of Bahia showing the regions (cities) where must samples were collected.
2.2 MITOCHONDRIAL DNA RESTRICTION ANALYSIS (MTDNA-RFLP)
Mitochondrial DNA (mtDNA) was isolated as described by Querol et al. (1992) with some modifications (Comi et al., 2000). The mtDNA was digested using the HinfI restriction endonuclease (Invitrogen, Life technologies, USA), and the fragments were separated by agarose gel electrophoresis (1.5 % in TBE buffer), stained with ethidium bromide, visualized under UV light, and photographed.
2.3 ANALYSIS OF DIVERSITY OF THE S. CEREVISIAE POPULATIONS
The frequency of the molecular patterns was calculated as the percentage of patterns found relative to the number of colonies analyzed(Querol et al., 1994) for each collection period (°Brix). Abundance was assessed by the number of molecular patterns identified at each distillery. The molecular patterns were processed using the Gelcompar II software, version 5.0 (Applied Maths NV, Sint-Martens-Latem, Belgium) to normalize the bands to the molecular marker (1 Kb Plus DNA Ladder™; Invitrogen, Life technologies, USA). Data were scored for the presence (1) or absence (0) of bands using a binary matrix. The number of bands (N), the number of exclusive bands (NLE), and the proportion of polymorphic bands (P) were measured using GenAlex version 6.1 software(Peakall and Smouse, 2006), assuming Hardy-Weinberg equilibrium, as previously described Lynch and Milligan(1994). Analysis of molecular variance (AMOVA) (Excoffier et al., 1992) was performed with 999 permutations using the GenAlex software (Peakall and Smouse, 2006).
The presence/absence matrix were built for the multivariate analyses, using the unweighted pair group method with arithmetic mean and the Jaccard similarity index using the vegan package (Oksanen et al. 2013) in R 3.0.2 (R Development Core Team 2008).
3 RESULTS
From the six distilleries studied, 358 yeast strains were isolated and identified based on physiological tests; 330 were identified as S. cerevisiae, and 28 isolates were designated as
non-Saccharomyces yeasts and then not included in this work. The mtDNA profiles of all 330 S. cerevisiae
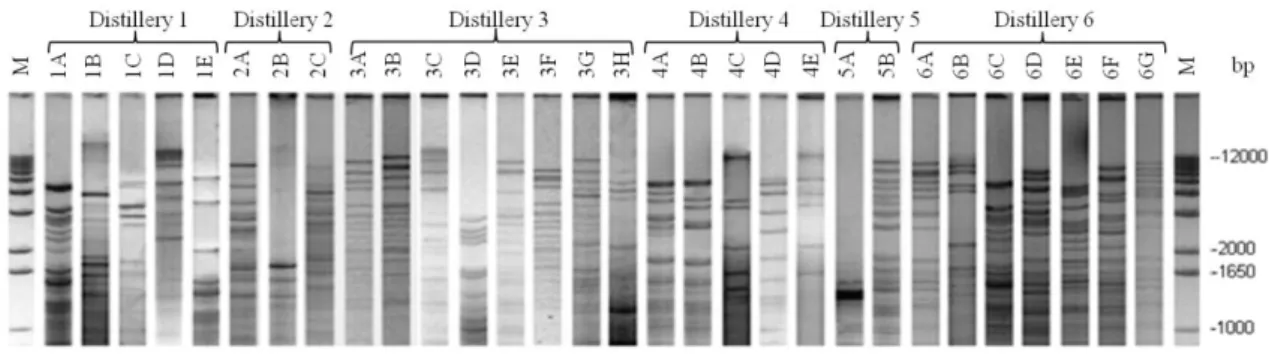
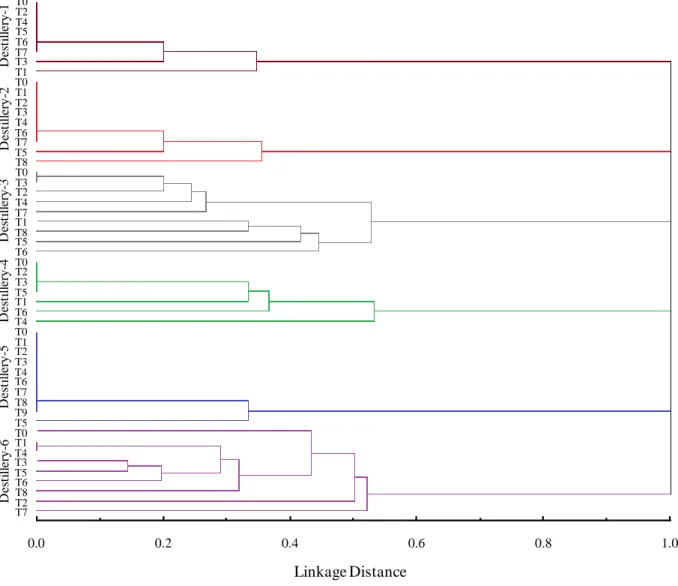
isolates were characterized. The distilleries showed the presence of at least one dominant molecular pattern throughout the fermentation cycle. A total of 30 different molecular patterns were found (Figure 2), and varying over time during the fermentation process, highlighting distillery 6 and 3 (Figure 3, Table 1). The molecular patterns were exclusive to each distillery. The greatest richness was found in distilleries 3 and 6, which exhibited eight and seven mtDNA patterns, respectively (Figure 2 and 4). The concentrations of soluble solids (° Brix) was very similar among distilleries, but with higher initial values in distillery 6 than the general average. In addition, the temperatures (°C) in the distillery 5 were above that observed for other distilleries at all time intervals, and the smallest variation was observed in distillery 4 (Figure 4). Our comparison between the study distilleries, performed with a presence/absence matrix, revealed no molecular similarities (Figure 3). Distilleries 1 and 4 showed five different molecular patterns, and the lowest diversity was found in distilleries 2 and 5 with three and two molecular patterns, respectively. Table 1 shows the frequencies of the molecular mtDNA patterns obtained for the S. cerevisiae isolates from the six distilleries studied. A total of 40 bands, of which only three were exclusive, were identified from all of the S.
cerevisiae strains. Distilleries 3 (Ilhéus) and 6 (Rio de Contas) showed the greatest number of bands
(34 and 33, respectively), representing 77.5 % of polymorphic bands, followed by distillery 1 (Ibirataia) with 28 bands and 62.5 % of polymorphic bands. The yeast population from distillery 2 showed 24 bands (47.5 % of polymorphic bands), and distilleries 4 and 5 showed 18 and 19 bands, respectively, representing 35 % of bands polymorphism.
Figure 2. Different mtDNA-RFLP patterns of the Saccharomyces cerevisiae strains present in spontaneous
fermentative cycles from the six cachaça distilleries studied. Lanes 1 and 32: 1 kb ladder; the numbers on the right indicate the molecular weights (bp) of the DNA fragments. The codes on the top
represent the mtDNA patterns found in each distillery. The dominant molecular patterns were 1A, 1E, 2A, 2C, 3A, 3B, 4A, 5A, 6A, 6C and 6D.
Table 1. Frequencies of the molecular patterns obtained from the mtDNA-RFLP analysis of the S. cerevisiae
strains isolated from six cachaça distilleries in northeastern Brazil at different stages of the fermentation cycle. Concentrations of soluble solids (° Brix), times, temperatures of the sugar cane must and number of
isolates are indicated.
Distillery 1 T0 T1 T2 T3 T4 T5 T6 T7 T8 Brix (°) 13 11 9.5 7 5 3.5 2 0 - Time (h) 0 0.58 1.40 2.40 4.00 5.10 5.56 8.00 Temperature (°C) 21 24 27 28 30 34 35 34 - Number of isolates 7 6 7 8 7 4 7 10 Pattern 1A1 7. 4 3.7 9.2 7.4 5.5 5.5 7.4 12.9 - Pattern 1B1 0 1.8 0 0 0 0 0 0 - Pattern 1C1 0 1.8 0 0 0 0 0 0 - Pattern 1D1 0 0 0 1.8 0 0 0 0 - Pattern 1E2 5. 5 3.7 3.7 5.5 7.4 1.8 3.7 5.5 - Distillery 2 T0 T1 T2 T3 T4 T5 T6 T7 T8 Brix (°) 14 11 9 8 6 5 2 0 - Time (h) 0 10.0 0 20.0 0 30.0 0 40.0 0 50.0 0 68.0 5 82.2 5 Temperature (°C) 27 28 28 30 30 31 30 31 -
Number of isolates 5 8 4 7 6 7 5 10 Pattern 2A1 5. 7 9.6 5.7 5.7 5.7 7.6 5.7 13.4 - Pattern 2B1 0 0 0 0 0 1.9 0 0 - Pattern 2C2 3. 8 5.7 1.9 7.6 5.7 3.8 3.8 5.7 - Distillery 3 T0 T1 T2 T3 T4 T5 T6 T7 T8 Brix (°) 13 11 9 7 5 3 1.6 0 - Time (h) 0 1.30 4.00 5.50 8.15 10.4 4 12.5 0 15.2 5 - Temperature (°C) 24 26 27 29 31 33 33 34 - Number of isolates 3 9 8 4 4 7 4 10 Pattern 3A1,2 2. 5 12.5 7.5 5 5 12.5 5 15 - Pattern 3B1,2 5 0 2.5 5 2.5 0 0 2.5 - Pattern 3C1 0 0 0 0 0 2.5 0 0 - Pattern 3D1 0 0 0 0 0 0 2.5 0 - Pattern 3E1 0 0 0 0 0 0 0 2.5 - Pattern 3F2 0 2.5 0 0 0 0 0 0 - Pattern 3G2 0 0 5 0 0 0 0 0 - Pattern 3H2 0 0 0 0 2.5 0 0 0 - Distillery 4 T0 T1 T2 T3 T4 T5 T6 T7 T8 Brix (°) 10 8 6 4 2 0 - - - Time (h) 0 12.0 0 22.4 8 33.1 6 47.5 6 73.1 1 - - - Temperature (°C) 25 27 28 29 29 28 - - - Number of isolates 7 8 10 7 5 18 Pattern 4A1,2 13 13.2 18.8 13.2 5.6 28.3 - - - Pattern 4B1 0 1.8 0 0 0 0 - - -
Pattern 4C1 0 0 0 0 1.8 0 - - - Pattern 4D1 0 0 0 0 1.8 0 - - - Pattern 4E1 0 0 0 0 0 1.8 - - - Distillery 5 T0 T1 T2 T3 T4 T5 T6 T7 T8 Brix (°) 16 14 12 10 8 6 4 2 0 Time (h) 0 1.43 2.47 3.03 4.00 4.43 5.02 5.53 6.20 Temperature (°C) 24 31 33 35 37 38 38 39 38 Number of isolates 7 6 5 7 6 5 6 6 10 Pattern 5A1,2 12 10.3 8.6 12 10.3 6.8 8.6 29.3 10 Pattern 5B1 0 0 0 0 0 0 1.7 0 0 Distillery 6 T0 T1 T2 T3 T4 T5 T6 T7 T8 Brix (°) 23 20 17 14 11 8 5 2 0 Time (h) 0 6.55 10.5 5 14.0 5 19.4 5 26.0 5 35.2 8 53.2 5 73.1 5 Temperature (°C) 24 29 31 32 33 33 33 30 28 Number of isolates 7 6 7 5 7 6 7 6 9 Pattern 6A1,2 6. 6 6.6 6.6 5 8.3 1.6 3.3 10 1.6 Pattern 6B1 1. 6 0 0 0 0 0 0 0 1.6 Pattern 6C1,2 1. 6 3.3 1.6 1.6 3.3 3.3 1.6 0 0 Pattern 6D1,2 0 0 1.6 1.6 0 1.6 1.6 0 0 Pattern 6E1 0 0 0 0 0 3.3 0 0 0 Pattern 6F1,2 0 0 1.6 0 0 0 5 0 0 Pattern 6G2 1. 6 0 0 0 0 0 0 0 0 1
mtDNA patterns obtained from colonies with different morphotypes. 2
The genetic divergence among and within populations was also analyzed using the AMOVA. We observed greater genetic variation (P < 0.001) among populations from different distilleries (71 %) rather than within them (29 %).
Figure 3. Dendrogram of cluster analysis using the Jaccard similarity index and the unweighted pair group
method with arithmetic mean of the Saccharomyces cerevisiae strains isolated of the spontaneous fermentation of cachaça from northeastern Brazil.
Figure 4. Comparison among the medians of the concentrations of soluble solids (° Brix), temperatures (°C), and richness of Saccharomyces cerevisiae strains isolated from sugar cane must, in six distilleries from northeastern Brazil. Dotted line represents the median of all distilleries. Right side indicates factor trend over
time (T0 to T9). D es ti ll er y -1 D es ti ll er y -2 D es ti ll er y -3 D es ti ll er y -4 D es ti ll er y -5 D es ti ll er y -6 T0 T2 T4 T5 T6 T7 T3 T1 T0 T1 T2 T3 T4 T6 T7 T5 T8 T0 T3 T2 T4 T7 T1 T8 T5 T6 T0 T2 T3 T5 T1 T6 T4 T0 T1 T2 T3 T4 T6 T7 T8 T9 T5 T0 T1 T4 T3 T5 T6 T8 T2 T7 0.0 0.2 0.4 0.6 0.8 1.0 Linkage Distance
4 DISCUSSION
In this study, the presence of 30 molecular patterns for S. cerevisiae strains was observed during the fermentation cycle in six distilleries using the mtDNA-RFLP technique. Colonies with different dominant morphotypes showed the same molecular patterns in most distilleries, similar to the observed by Araujo et al. (2007). These results demonstrate that criteria based only on morphological characterization are inadequate for distinguishing S. cerevisiae strains. Furthermore, the presence of different molecular patterns for strains of dominant morphotypes was observed in most of the distilleries (1, 2, 3 and 6), reinforcing that mtDNA-RFLP analysis is a useful technique to study the diversity of S. cerevisiae populations in cachaça fermentations.
The 30 molecular patterns detected for the S. cerevisiae populations revealed a high diversity among the strains in the microenvironments studied. Among the molecular patterns detected, one or two were found with high frequency in all of the distilleries, indicating that these strains are able to drive the fermentation process. Therefore, studies focused on the physiological and adaptive
T0 T9 T9 T0 T0 T9
characteristics of these strains could significantly contribute to improving the fermentation process of northeastern Brazil’s cachaça producers. Badotti et al. (2010) obtained similar results in a study evaluating S. cerevisiae strains from different cachaça-producing areas in Brazil; in that study, specific S. cerevisiae population from each area presented mtDNA patterns that were not found in other regions.
Studies examining populations of S. cerevisiae in wine fermentation also demonstrated that certain molecular patterns dominate (Guillamón et al., 1996; Esteve-Zarzoso et al., 2000). These studies found that S. cerevisiae yeast strains are highly adapted to specific climate and substrate conditions. In S. cerevisiae populations from cachaça, stress factors, including high temperature, high sugar concentration at the beginning of fermentation and high ethanol concentration at the end of fermentation (which could induce mutagenic effects on mtDNA), seem to be the relevant factors determining the population structure (Pataro et al. 2000, Boulton and Quain, 2001, Badotti et al., 2010, Barbosa et al., 2016).
Finally, the dominant molecular patterns identified here could be used for further studies aimed at selecting specific S. cerevisiae strains that are well adapted to each cachaça-producing region. These selected strains could be used as starter strains to improve the quality of cachaça in their specific regions.
ACKNOWLEDGEMENTS
This work was supported by the Fundação de Amparo à Pesquisa do Estado da Bahia (FAPESB) and Conselho Nacional de Desenvolvimento Científico e Tecnológico (CNPq). Alice Ferreira da Silva received master scholarship by the Fundação de Amparo à Pesquisa do Estado da Bahia (BOL 1046/2007) and Frederic Mendes Hughes was financially supported by Conselho Nacional de Desenvolvimento Científico e Tecnológico (Grant CNPq 302300/2019-8). The authors thank Dr. Bruno Motta Oliveira for technical support.
CONFLICT OF INTEREST STATEMENT
The authors declare no financial or commercial conflicts of interest.
REFERENCES
Araújo TM, Souza MT, Diniz RHS, Yamakawa CK, Soares LB, Lenczak JL, de Castro Oliveira JV, Goldman GH, Barbosa EA, Campos ACS and Castro IM, Brandão R L. (2018) Cachaça yeast strains:
alternative starters to produce beer and bioethanol. Antonie van Leeuwenhoek. 111(10):1749-66. doi:10.1007/s10482-018-1063-3
Araújo RAC, Gomes, FCO, Moreira ESA, Cisalpino PS, Rosa CA. (2007) Monitoring
Saccharomyces cerevisiae populations by mtDNA restriction analysis and other molecular typing
methods during spontaneous fermentation for production of the artisanal cachaça. Braz J Microbiol. 38: 217-223.
Barbosa EA, Souza MT, Diniz RHS, Godoy-Santos F, Faria-Oliveira F, Correa LFM, Alvarez F,
Coutrim MX, Afonso RJDCF, Castro IDM, Brandão RL. (2016). Quality improvement and
geographical indication of cachaça (Brazilian spirit) by using locally selected yeast strains. Journal of Applied Microbiology, 121(4), 1038–1051. doi:10.1111/jam.13216
Badotti F, Belloch C, Rosa CA, Barrio E, Querol, A. (2010) Physiological and molecular characterisation of Saccharomyces cerevisiae cachaça strains isolated from different geographic regions in Brazil. World J. Microbiol. Biotechnol. 26:579-587.
Boulton C, Quain D. (2001) Brewing Yeast and Fermentation. Blackwell Science, Oxford.
Comi G, Maifreni M, Manzano M, Lagazio C, Cocolin L. (2000) Mitochondrial DNA restriction enzyme analysis and evaluation of the enological characteristics of Saccharomyces cerevisiae strains isolated from grapes of the wine-producing area of Collio (Italy). Int. J. Food Microbiol. 58: 117– 121.
Core R Team. (2013) R development core team. RA Lang Environ Stat Comput 55: 275–286 Cruz CD. (2008) Programa Genes: diversidade genética. UFV, Viçosa.
Esteve-Zarzoso B, Gostíncar A, Bobet R, Uruburu F, Querol A. (2000) Selection and molecular characterization of wine yeasts isolated from ‘El Penedès’ area (Spain). Food Microbiol. 17: 553-562.
Excoffier L, Smouse PE, Quattro JM. (1992) Analysis of molecular variance inferred for metric distances among DNA haplotypes: application to human mitochondrial DNA restriction data. Genetics 131: 479-491.
Gomes FCO, Silva CLC, Marini MM, Oliveira ES, Rosa CA. (2007) Use of selected indigenous
Saccharomyces cerevisiae strains for the production of the traditional cachaça in Brazil. J. Appl.
Microbiol 103: 2438–2447.
Guillamón JM, Barrio E, Querol A. (1996) Characterization of wine yeast strains of the
Saccharomyces Genus on the basis of molecular markers: relationships between genetic distance and
geographic or ecological origin. Syst. Appl. Microbiol. 19: 122-132.
Lynch M, Milligan BG. (1994) Analysis of population genetic structure with RAPD markers. Mol. Ecol. 3: 91-99.
Oksanen J, Blanchet FG, Kindt R, Legendre P, Minchin PR, O’hara R, Simpson GL, Solymos P, Stevens MHH, Wagner H. (2013) Package ‘vegan’. Community ecology package, version 2(9). Pataro C, Guerra JB, Petrillo-Peixoto ML, Mendonça-Hagler LC, Linardi VR, Rosa CA. (2000) Yeast communities and genetic polymorphism of Saccharomyces cerevisiae strains associated with artisanal fermentation in Brazil. J. Appl. Microbiol. 88: 1-9.
Pataro C, Guerra JB, Gomes FCO, Neves MJ, Pimentel PF, Rosa CA. (2002) Trehalose accumulation, invertase invertase activity and physiological characteristics of yeasts isolated from 24H fermentative cycles during the production of artisanal Brazilian cachaça. Braz J Microbiol. 33: 202-208.
Peakall R, Smouse PE. (2006) Genalex 6: genetic analysis in Excel. Population genetic software for teaching and research. Mol. Ecol. Notes 6: 288-295.
Querol A, Barrio E, Huerta T, Ramon D. (1992) Molecular monitoring of wine fermentations conducted by active dry yeasts strains. Appl. Environ. Microbiol. 58: 2948-2593.
Querol A, Barrio E, Ramon D. (1994) Population dynamics of natural Saccharomyces strains during wine fermentation. Int. J. Food Microbiol. 21: 315-323.