Analyzing the strength of ties of Retweet in health
domain
Leila Weitzel1,3, Paulo Quaresma2 José Palazzo M. De Oliveira3 1Universidadde Federal do Pará. Campus Universitário de Marabá, Brasil.
2Departamento de Informática. Universidade de Évora, Portugal. [email protected]
3 Instituto de Informática, Universidade Federal do Rio Grande do Sul, Brasil. [email protected]
Abstract. Social Network (SN) is created whenever people interact with other
people. Online SN gained considerable popularity in the last years such as Fa-cebook, Twitter and etc Twitter is SN and microblogging service that creates some interesting social network structures - follow relationships. Users follow someone mostly because they share common interests and they may exchange messages called tweets. If a user post a tweet, if their follower like it they repost it or retweet it. In this context, we aim to explore and study the topological structure of user‟s retweet network, as well, new scaling measures based on strength of retweet ties. The findings suggested that relations of “friendship” are important but not enough to find out how important users are. We uncovered other some principles that must be studied like, homophily phenomenon. Ho-mophily explores properties of social network relationships, i.e. the preference for associating with individuals of the same background. Last but not least, it is worth emphasizing that we uncovered a weak correlation between Degree Cen-trality and Betweenness CenCen-trality (49 percent) in Retweet-network and strong correlation between Degree and Betweenness centrality in Follower-network (89 percent). These find suggests that retweet network may have some fractal properties.
Keywords: Social Network Analysis, Twitter, Scaling nodes.
1 Introduction
Human beings have been part of social networks since our earliest days. We are born and live in a world of connections. Social Network is created whenever people interact, directly or indirectly, with other people. Social Networks are groups of indi-viduals who share a commonality; they are connected by ties, or links. These links can characterize any type of relationship, e.g., friendship, authorship, etc.
Computer technologies used to create and to support social networks are relatively new. The recent proliferation of Internet Social Media applications and mobile devic-es has made social connections more accdevic-essible than ever before. Online Social Net-works, such as Facebook, MySpace and Twitter, gained considerable popularity and grown at an unprecedented rate in the last few years [1]. Twitter is a social
network-ing and also a micro-bloggnetwork-ing service. It creates several interestnetwork-ing social network structures. The most obvious network is the one created by the “follows” and “is
fol-lowed by” relationships. The main goal of Twitter is to allow users to communicate
and stay connected through the exchange of short messages, called tweets. A user posts a tweet, if other users like it, they repost it or retweet or just RT, and by a process of virality, a large number of users can be potentially reached by a particular message. The Twitter‟s RT capabilities can be itself useful in discovering potential relationships. Based on this context, we aim to explore and study the topological structure of user‟s RT network, and we propose new scaling measures based on strength of RT ties.
The outline of this paper is as follows: Section 2 we present some related works; Section 3 we explain the research methodology, data extraction technique and net-work modelling approach; Section 4 we provide a statistical analysis of dataset and graph analysis; and the last Section we discuss the results.
2. Related Works
One common type of social analysis is the identification of communities of users with similar interests, and within such communities the identification of the most “influential” users. Efforts have been made to measure the influence and ranking users by both their importance as hubs within their community and by the quality and topical relevance of their post. Some of these efforts are: [2–19]. Most of these re-searches are based on: follower, tweet and mention count, co-follower rate (ratio between follower and following), frequency of tweets/updates, who your followers follow, topical authorities. Centrality measures such as Indegree/Outdegree, Eigen Vector, Betweenness, Closeness, PageRank [20] and others have been used to eva-luate node importance too. It must be stressed that, all these works are concentrated only on Twitter relationship, i.e., follow relationship; none of them deals with any sort of RT relationship.
3 Research Methodology
3.1 Background
Twitter let people to follow other users without approval, any user can follow you and you do not have to follow back. Thus, their ties are asymmetric and the directio-nality of edges are important (i.e. who is following whom) [2]. Twitter users follow someone, mostly because they are interested in the topics the user publishes in tweets, and they follow back because they find they share similar topic interest. These posts are brief (up to 140 characters) and can be written or received with a variety of com-puting devices, including cell phones. Twitter, as well as other social networks, is usually modeled as a graph G = (V, A) which consists of a set V of vertices (or nodes) representing user accounts and a set A of arcs (or links or ties) that connect
vertices representing relationships (follow relationship). Each link is an ordered pair of distinct nodes. For further details see the book “Social Network Analysis: Methods and Applications”, by Wasserman and Faust, is perhaps the most widely used refer-ence book for structural analysts[22]. The book presents a review of network analysis methods and an overview of the field.
When Twitter users are logged in, they can see a stream of tweets posted by their followers. Hence, if they like it, they can RT it, i.e., is to repeat/quote someone‟s tweet. The RTs posts are marked with characters RT or via @ + “screenname” in the beginning of message, we extracted either both replay tweets and mention.
“RT @TheNaturalNews: #Alzheimer's patients treated by playing internet
games: http://t.co/dSAmzTv”
“@IRememberBetter: Singing & the Brain: reflections on human capacity 4
mu-sic; pilot study of group singing w/ #Alzheimer's http://t.co/0NZXoVU #ArtAlz”
We regarded that RT mechanism may work to increase user network in this way: a user A post an interesting “Tweet”, you like this post and then forwarding to your network. Your followers or other user from your network discover and maybe follow the user who “Tweet”, or perchance, they forward to their own network. These can potentially increasing the size and reach of user´s “Tweet” network.
3.2 Data Extraction and Modeling
We extracted the RT from 152 browsed Twitter’s users; in accordance with self Twitter browse interest, in our case we selected health subject. The mining was done during March and April 2011. We crawled about 200 RT per user (this equivalent to about six month of “tweeting” ) totaling 4350 RT. Reference [12] demonstrated that the median number of tweets per user stay between 100 and 1000, emphasizing that maximum tweet values are closely related to the celebrities (actors, singers, pop/rock band, politicians, etc). The authors [12] proved that the majority of users who have fewer than 10 followers never tweeted or did just once and thus the median stay at 1 tweet per user. Seen this way, our sample data of RT is perfectly valid. At the end of crawling, we had a user-RT database of who replayed whom, the relationship between them and the text of retweet. At this point, we could build the network. The
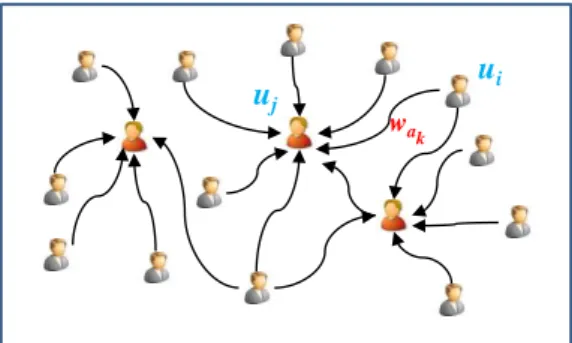
RT-network was modeled as a direct graph (Figure 1) where each node (total-ling 1237 nodes) represents the users and each edge represents RT relationship (totalling 1409 edges), i.e., an edge from to stands that user “RETWEET” user . These edges ak between nodes are weighted according the equa-tion 1.
(1)
Where is the retweet count for uj, and is the maximum number of retweet of user j. The parameter is a sort of discount rate representing Twitter rela-tionships (follower, following, reciprocally connected and when relarela-tionships - follow-er or following - are absent between usfollow-ers). Using this notation, if an individual is a “follower” of , then 0.07 and if he/she is “following” then 0.14, if he/she is both follower and following then 0.15 and if the relationship is absent then 0.64. The parameter intends to discount the weight of the FOLLOW phenomenon,
since many celebrities and mass media have hundreds of thousands of followers. These values were computed according to ratio data sample.
Fig. 1. Twitter RT network basic topology.
3.3 Scaling Method
F-measure is generally accepted at Information Retrieval as evaluation perfor-mance methods and by far the most widely used. It has been past more than 15 years since the measure was first introduced by van Rijsbergen [23]. He states, the F-measure (F) combines Recall1 (R) and Precision2 (P) in the following form:
2+1 P R 2P+R 1+ 2 2 R+ 1 P where 0 + (1)
Where is a parameter that controls a balance between P and R. When = 1 F comes to equivalent to the harmonic mean of P and R. If > 1, F becomes more re-call-oriented and if < 1, it becomes more precision oriented F0 = P.
Each of network analysis metrics evidences a class of issue. For instance, Bet-weenness Centrality represents a node that occurs in many shortest paths among other nodes; this node is called “gatekeeper” between groups node. On the other hand, Closeness Centrality is the inverse of Average Distance (geodesic distance). Close-ness reveals how long it takes information to spread from one node to others. Eigen Centrality measure takes into account Hub Centrality (out links) and Authority Cen-trality (in links). According Bonacich [21], “Eigenvector CenCen-trality can also be seen as a weighted sum of not only direct connections but indirect connections of every length. Thus, it takes into account the entire pattern in the network. These measures are especially sensitive to situations in which a high degree position is connected to many low degree or vice-versa.” Thus, at this point, we describe our approach. Let (Rank)i be the linear combination of metrics with associated weight defined by:
1 Definition: The ratio of relevant items retrieved to all relevant items in a file [i.e., collection], or the probability given that an item is relevant [that] it will be retrieved R = (retrieved rele-vant) [24].
2 Definition: The ratio of relevant items retrieved to all items retrieved, or the probability given that an item is retrieved [that] it will be relevant P = (relevant retrieved) [24].
u
iwak
Rank
(2)
Where the parameters are the “control balance” and used in the same way as in F-measure and xi a set of measures: BC is Betweenness
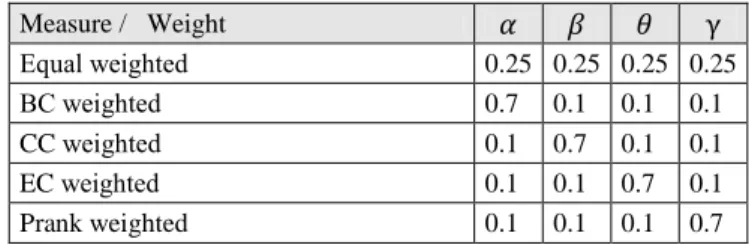
Centrality, CC is Closeness Centrality, EC is Eigen Vector Centrality, and PRANK is the PageRank [20]. We propose a set of strategic guidelines. The first proposition is that the measures have same weight (0.25), afterward each of measures is balanced according do Table 1.
Table 1. Weighted parameter: five rank approaches
Measure / Weight Equal weighted 0.25 0.25 0.25 0.25 BC weighted 0.7 0.1 0.1 0.1 CC weighted 0.1 0.7 0.1 0.1 EC weighted 0.1 0.1 0.7 0.1 Prank weighted 0.1 0.1 0.1 0.7
4 Graph Analysis
An exploratory data analysis was performed to provide an overview of the availa-ble dataset. The data examination process addresses two segments: (1) a graphical examination and normality testing and (2) ranked lists analysis.
Of all 100 extracted users, only 39% did not retweet; parcels of them, 28% are mass media (newspapers, magazines, television channels and etc). This suggests that they are “traditional information provider” therefore, is expected that they not replay. We performed a “Kurtosis Normality test” and the sample passed at 95% confidence level, which allows us to state that no significant departure from normality was found. The sample of RT has a mean of 3.035 and standard deviation of 15.23. Approximate-ly 65% had onApproximate-ly one RT, the remaining was split between 2 and 523 retweets. The Density is low, i.e., do not have a dense “in” and “out” ties to one another. In contrast, a higher density score reflects more ties, which is generally interpreted as more coor-dinate network with more opportunities for sharing of information among nodes. This indicates that maybe exist potentials relationships. Conversely, Fragmentation shows that nodes are highly connected, as pointed out in Table 2 by Isolate Count Measure. The Transitivity represents the idea: "if friends of my friends are my friends", it is not quite the reality at RT network. That can be confirmed by low value of transitivity measure, see Table 2.
Table 2. RT graph-level measures.
Measures [min =0; max =1] Values
Density 0.0009
Efficiency (the degree to which each component in a network contains the minimum
links possible to keep it connected.) 0.063
Isolate Count (The number of isolate nodes in a unimodel network) 0.000 Transitivity (The percentage of link pairs {(i,j), (j,k)} in the network such that (i,k) is
also a link in the network.) 0.070
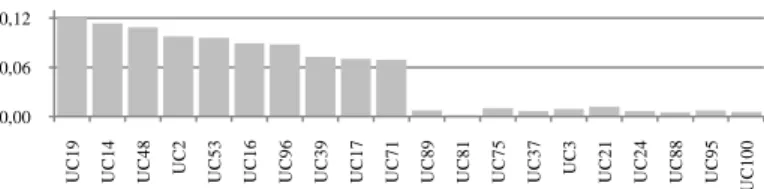
We associate each position (the top 20) with a value following this approach: the first top position received 20 points, the second position nineteen, and successively decrease one unity until the last one, that received one point. Then, we compute the sum of all nodes individually for each rank approaches in Table 1 and the results of the recurring top 20 are displayed in Figure 2.
Fig. 2. Bar chart of recurring top 20 nodes.
Rather than evaluating the values calculated directly, we compute the Kendall Tau τ Correlation and Spearman-Rho Rank test Rho ρ for the five approaches rank. The Kendall Tau ( ) Correlation and Spearman-Rho Rank test (Rho = ) are the two most commonly used nonparametric measures of association for two random va-riables [24]. The correlation is significant at the 0.01 level (2-tailed) and displayed in Table 3. It is interesting to notice that all rank approaches have just same correlation and show strong positive correlation.
Table 3. Correlation matrix.
Weighted Equal Weighted BC Weighted CC Weighted EC Weighted PRANK
Kendall's tau_b Equal Weighted 100,00% 99,90% 99,90% 99,90% 99,90% BC Weighted 99,90% 100,00% 99,90% 99,90% 99,80% CC Weighted 100,00% 99,90% 100,00% 99,90% 99,90% EC Weighted 100,00% 99,90% 99,90% 100,00% 99,90% PRANK Weighted 99,90% 99,80% 99,90% 99,99% 99,90% Spearman's rho Equal Weighted 99,90% 99,90% 99,90% 99,90% 99,90% BC Weighted 99,90% 100,00% 99,90% 99,90% 99,90% CC Weighted 99,90% 99,90% 100,00% 99,90% 99,90% EC Weighted 99,90% 99,90% 99,90% 99,90% 99,90% PRANK Weighted 99,90% 99,90% 99,90% 99,90% 99,90% 0,00 0,06 0,12 UC1 9 UC1 4 UC4 8 UC 2 UC5 3 UC1 6 UC9 6 UC3 9 UC1 7 UC7 1 UC8 9 UC8 1 UC7 5 UC3 7 UC 3 UC2 1 UC2 4 UC8 8 UC9 5 UC 100
The Table 4 shows the profile of top10 node according the Equal weighted rank approach. They are mainly Public Health Agencies at USA. Considering some inaccu-racy about time registration, it can be seen that all of them are situated at Eastern Time (US and Canada).
Table 4. Top 10 rank nodes for Equal weighted rank approach.
ID Followed Followers Tweets Time
Joined Twitter
Date UC12 180 457 328 Eastern Time (US & Canada) 07/10/2009
UC16 28 6900 226 Quito 22/06/2010
UC14 31 116129 511 Eastern Time (US & Canada) 24/07/2008 UC17 82 1259595 414 Eastern Time (US & Canada) 28/01/2009 UC19 78 27599 797 Eastern Time (US & Canada) 21/05/2010
UC39 269 111390 1341 Quito 09/08/2007
UC48 2303 124803 2975 Eastern Time (US & Canada) 26/03/2009
UC53 92 88600 599 Quito 05/06/2009
UC71 95 4789 524 Eastern Time (US & Canada) 19/03/2009 UC96 1095 174651 2217 Eastern Time (US & Canada) 30/05/2007
5 Discussion
We proposed a new social network topological structure based on RT weighted ties to rank user influence named RT-network. We have analyzed the power of retweeting and we also have presented a new methodology to rank nodes based on control weighted parameters. The method was anchored in F-measure to control the weight balance. The experimental results offered an important insight of the relationships among Twitter users. The findings suggested that relations of “friendship” i.e., users that have reciprocal relationship) are important but not enough to find out how impor-tant nodes are. We uncovered other some principles that must be studied like, homo-phily phenomenon. Homohomo-phily explores properties of social network relationships, i.e. the preference for associating with individuals of the same background. Last but not least, it is worth emphasizing that we uncovered a weak correlation between De-gree Centrality and Betweenness Centrality (49 percent) in RT-network and strong correlation between Degree and Betweenness centrality in Follower-network (89 percent). References [25], show that the correlation between Degree and Betweenness Centrality of nodes is much weaker in fractal network models compared to non-fractal models. In this way, in future work we will be conduct an in-depth assessment of fractal properties in order to figure out fractal properties such as self-similarity and how to calculate their fractal dimension.
References
[1] W. Kim, O. Jeong, e S. W. Lee, “On social Web sites”, Information Systems, vol. 35, no. 2, p. 215-236, abr. 2010.
[2] P. Balkundi e M. Kilduff, “The ties that lead: A social network approach to leadership”, The Leadership Quarterly, vol. 16, no. 6, p. 941-961, dez. 2005.
[3] J. Bar-Ilan e B. C. Peritz, “A method for measuring the evolution of a topic on the Web: The case of „informetrics‟”, Journal of the American Society for Information Science and Technology, vol. 60, no. 9, p. 1730-1740, 2009.
[4] Bongwon Suh, Lichan Hong, P. Pirolli, e E. H. Chi, “Want to be Retweeted? Large Scale Analytics on Factors Impacting Retweet in Twitter Network”, in Social Computing (Social-Com), 2010 IEEE Second International Conference on, 2010, p. 177-184.
[5] D. Boyd, S. Golder, e G. Lotan, “Tweet, Tweet, Retweet: Conversational Aspects of Ret-weeting on Twitter”, in Hawaii International Conference on System Sciences, Los Alamitos, CA, USA, 2010, vol. 0, p. 1–10.
[6] M. Cha, H. Haddadi, e P. K. Gummadi, “Measuring User Influence in Twitter: The Million Follower Fallacy”, in International Conference on Weblogs and Social Media, 2010. [7] D. Gayo-Avello, “Detecting Important Nodes to Community Structure Using the Spectrum
of the Graph”, Cornell University Library, 06-abr-2010.
[8] D. Gayo-Avello, “Nepotistic relationships in twitter and their impact on rank prestige algo-rithms”, Arxiv preprint arXiv:1004.0816, 2010.
[9] D. Gruhl, R. Guha, D. Liben-Nowell, e A. Tomkins, “Information diffusion through blog-space”, in Proceedings of the 13th international conference on World Wide Web, New York, NY, USA, 2004, p. 491-501.
[10] M. Nagarajan, H. Purohit, e A. Sheth, “A Qualitative Examination of Topical Tweet and Retweet Practices”, in ICWSM 2010, Washington, DC, 2010.
[11] F. Nagle e L. Singh, “Can Friends Be Trusted? Exploring Privacy in Online Social Net-works”, in 2009 International Conference on Advances in Social Network Analysis and Min-ing, Athens, Greece, 2009, p. 312-315.
[12] A. Pal e S. Counts, “Identifying topical authorities in microblogs”, in Proceedings of the fourth ACM international conference on Web search and data mining, Hong Kong, China, 2011, p. 45-54.
[13] D. M. Romero, W. Galuba, S. Asur, e B. A. Huberman, “Influence and passivity in social media”, in Proceedings of the 20th international conference companion on World wide web - WWW ’11, Hyderabad, India, 2011, p. 113.
[14] T. Sakaki e Y. Matsuo, “How to Become Famous in the Microblog World”, 2010, 2010. [15] D. Sousa, L. Sarmento, e E. Mendes Rodrigues, “Characterization of the twitter @replies
network”, in Proceedings of the 2nd international workshop on Search and mining user-generated contents - SMUC ’10, Toronto, ON, Canada, 2010, p. 63.
[16] M. J. Welch, U. Schonfeld, D. He, e J. Cho, “Topical semantics of twitter links”, in Pro-ceedings of the fourth ACM international conference on Web search and data mining, Hong Kong, China, 2011, p. 327-336.
[17] Y. Yamaguchi, T. Takahashi, T. Amagasa, e H. Kitagawa, “TURank: Twitter User Rank-ing Based on User-Tweet Graph Analysis”, in Web Information Systems EngineerRank-ing – WISE 2010, vol. 6488, Springer Berlin / Heidelberg, 2010, p. 240-253.
[18] S. Ye e S. Wu, “Measuring Message Propagation and Social Influence on Twitter.com”, in Social Informatics, vol. 6430, Springer Berlin / Heidelberg, 2010, p. 216-231.
[19] H. Kwak, C. Lee, H. Park, e S. Moon, “What is Twitter, a social network or a news me-dia?”, in Proceedings of the 19th international conference on World wide web, Raleigh, North Carolina, USA, 2010, p. 591-600.
[20] L. Page, S. Brin, R. Motwani, e T. Winograd, “The PageRank Citation Ranking: Bringing Order to the Web.”, Stanford InfoLab, Technical Report, 1999.
[21] P. Bonacich, “Some unique properties of eigenvector centrality”, Social Networks, vol. 29, no. 4, p. 555-564, out. 2007.
[22] S. Wasserman, Social network analysis : methods and applications., Reprint. Cambridge: Cambridge University Press, 1999.
[23] C. J. van Rijsbergen, Information retrieval, 2o ed. London: Butterworths, 1979. [24] T. Saracevic, “Evaluation of evaluation in information retrieval”, in Proceedings of the
18th annual international ACM SIGIR conference on Research and development in informa-tion retrieval, Seattle, Washington, United States, 1995, p. 138-146.