Evaluation of phenolic compounds and antioxidant activity of blueberries
and modelization by artificial neural networks
RAQUEL P. F. GUINÉ1,2,3*, SUSANA MATOS1, FERNANDO GONÇALVES1,2, DANIELA T. V. A. COSTA4, MATEUS MENDES5
1
Dep. Indústrias Alimentares, ESAV, Instituto Politécnico de Viseu, Portugal. 2
CI&DETS/ESAV, Instituto Politécnico de Viseu, Portugal. 3
CERNAS, Instituto Politécnico de Coimbra, Portugal. 4
Dep. Ecologia e Agricultura Sustentável, ESAV, Instituto Politécnico de Viseu, Portugal. 5
Instituto de Sistema e Robótica, FCTUC-DEEC, Universidade de Coimbra, Portugal.
The study aimed at evaluating the influence of different production conditions, conservation and extraction procedures on the total phenolic compounds and antioxidant activity of blueberries by DPPH and ABTS methods. The production factors considered were origin, altitude of the farm location and age of the bushes. The conservation conditions considered were freezing as opposed to the fresh product. The extraction procedures included two different solvents and two orders of extraction. The data analysis was carried out by training artificial neural networks to model the data and extract information from the model.
* Adress correspondence to:
Professor Raquel P. F. Guiné, Quinta da Alagoa. Estrada de Nelas. Ranhados. 3500-606 Viseu. Portugal. E-mail: raquelguine@esav.ipv.pt
Published article. Citation:
Guiné RPF, Matos S, Gonçalves FJ, Costa D, Mendes M. (2018) Evaluation of phenolic compounds and antioxidant activity of blueberries and modelization by artificial neural networks. International Journal of Fruit Science, 18(2), 199-214.
The results obtained revealed that the type of extract and the order of extraction influenced the concentrations of phenolic compounds as well as the antioxidant activity of the different samples studied. Also the origin of the farms from where the blueberries were harvested significantly influence those properties, showing that the blueberries from Oliveira do Hospital had less phenolic compounds and lower antioxidant activity. Also older bushes at higher altitudes seem to produce berries richer in these properties. Regarding conservation, no influence was observed for phenols but a slight influence could be detected for antioxidant activity.
KEYWORDS Antioxidant activity; ANN modeling; Extraction; Production conditions; Storage; Total phenols.
INTRODUCTION
Blueberries (Vaccinium spp) are greatly appreciated and widely consumed around the world in view of their high contents in phenolic compounds, including anthocyanins, flavonols, chlorogenic acid and procyanidins (Koca and Karadeniz, 2009). Blueberries have demonstrated a diversity benefits for humans such as antidiabetic, antimicrobial, antiproliferative, memory loss preventive, urinary disease protecting, apoptotic, liver protective, lowering blood cholesterol, lifespan-prolonging or anti-inflammatory activities, preventing vision problems, delaying ageing, cancer preventive, atherosclerosis preventive and cardioprotective properties (Shi et al., 2008; Prior et al., 2009; Adams et al., 2010; Wu et al., 2010; Zielinska et al., 2015; Chen et al., 2015). In addition to these biological activities, its powerful antioxidant activity is certainly one of the characteristics that have contributed for the popularity of this small berry in the past decades (Wu et al., 2004; Wolfe et al., 2008;
Zhou et al., 2014b), being used as sources of natural antioxidants and in a variety of applications for preventing chronic diseases and nervous system disorders (Youdim et al., 2000; Stoner et al., 2008). Due to of the numerous health benefits associated to blueberry consumption, besides their unique taste, and nutritional value, the worldwide production and consumption have increased rapidly in the past years, so that they have become the second most important soft fruit species after strawberry (Giongo et al., 2013).
However, blueberries are significantly perishable and susceptible to rapid spoilage (Cantín et al., 2012), and the postharvest life is very short when stored at ambient temperature due to the susceptibility to microbial spoilage, mechanical damage or loss of moisture and nutrients (Hancock et al., 2008). Duan et al. (2011) indicates for fresh blueberries a shelf life between 1 and 8 weeks, but this is significantly variable according to the maturity stage, harvest technique, presence of fruit disease or storage conditions. The transfer of the fruits from producer to final consumer generally requires 5 to 10 days, and, hence, cold storage is mandatory to maintain quality (Zhou et al., 2014b). Zhou et al. (2014a) showed that low-temperature storage (including freezing) can delay senescence as well as help to preserve fruit quality. Hence this procedure may be used to successfully extend the postharvest life of blueberry. Still, long term storage can gradually affect fruit quality. Furthermore, the quality can be greatly compromised when the stored fruits are subsequently moved to ambient temperature.
Many factors affect the blueberries production and yield, as well as the fruits’ characteristics. Irrigation, for example, is a determinant factor in the growth and production of blueberry. This is because the root system of this plant is superficial, quite confined, with a small amount of root hairs, and all these contribute for to the restriction in the water uptake capacity (Holzapfel et al., 2004) The blueberry is very dependent on a low temperature
environment, this being a critical factor that limits its growth and survival and, hence, conditioning its geographical distribution (Folta and Kole, 2011; Die and Rowland, 2014). Artificial neural networks (ANN) have been used in the past for modelling many processes in food engineering and food chemistry. Guiné et al. (2015b) produced an ANN model to predict the antioxidant activity and the content of phenolic compounds in bananas submitted to different drying treatments. Cabrera and Prieto (2010) applied ANN modeling to describe the antioxidant activity in essential oils. Xi et al. (2013) used ANN to model the ultrahigh pressure extraction of green tea polyphenols. Vats and Negi (2013) optimized by ANN modeling the release of polyphenols and sugars from pine fallen foliage, in the development of bioprocesses. Gutés et al. (2005) applied artificial neural network analysis for the determination of phenolic compounds.
The present work’s goal was to model by artificial neural networks the effect of different production and conservation conditions, as well as extraction procedures, on the phenolic compounds and antioxidant activity of blueberries from cultivar Bluecrop. The production factors considered were origin, altitude of the farm location and age of the bushes, and the conservation was under freezing as opposed to the fresh product. The extraction procedures included two different solvents and different orders of the extraction.
MATERIALS AND METHODS
Harvesting and conservation
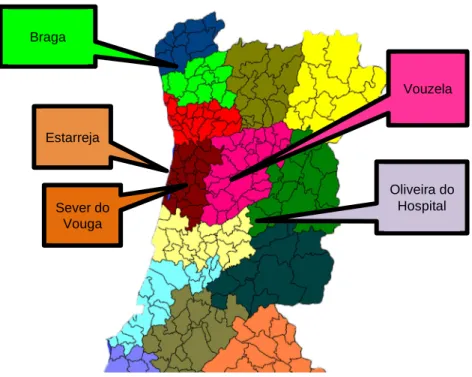
To carry out this study were used blueberries Vaccinium corymbosum L., from cultivar Bluecrop grown in conventional production mode in five different farms in Portugal located in different parts of the North-Centre region (Figure 1). The production conditions in each farm are as shown in Table 1. The fruits were manually harvested in a maturation state
corresponding to commercialization (Figure 2). The analyses were made right after harvest in the fresh fruits and also after 6 months of storage under freezing at a temperature of -20 ºC.
Figure 1 – Location of the farms from where the blueberries were harvested.
Table 1 - Production conditions of the blueberries.
Location of the farm Altitude of the farm (m)
Age of the bushes (years)
Harvesting date (day/month)
Sever do Vouga 463 20 11 / July
Estarreja 45 3 2 / June
Oliveira do Hospital 510 21 24 / June
Vouzela 450 3 22 / July Braga 125 28 2 / July Vouzela Oliveira do Hospital Sever do Vouga Estarreja Braga
Figure 2 – Blueberries harvested at commercial maturation stage.
Chemical analysis
The phenolic compounds were extracted with methanol and with acetone solutions, and in each case the sample was left for 1 hour in an ultrasonic bath at room temperature. The extracts obtained were then used to quantify the phenolic composition and the antioxidant activity. The total phenolic content in the fruit extracts was determined by the Folin– Ciocalteu method according to Gonçalves et al. (2012). The antioxidant activity was determined by DPPH (2,2-diphenyl-1-picrylhydrazyl) (Brand-Williams et al., 1995) method and also by the ABTS (2,2′-azino-bis(3-ethylbenzthiazoline-6-sulphonic acid)) method (Miller et al., 1993) .
Statistical analysis
All values are presented as mean plus corresponding standard deviation based on the different replicas made. Furthermore, to evaluate if there were statically significant differences between samples, was used ANOVA with post-hoc Tukey test for multiple comparisons. The
statistical treatment was done using software IBM SPSS, version 24, and the level of significance considered was 5% (p <0.05).
Modeling by ANN
ANNs are an interconnected association of artificial neurons. The input for each neuron can be one or more variables with their corresponding weights, and the output is a function of the weighted inputs. Neurons learn by adjusting the weights of the input variables, in such a way that the error between the neuron’s expected output and the measured output value is minimized. The weights learnt by the neural network during training are an indication of the relevance of each variable for the whole system. The analysis of the weights gives a wealth of information about the contribution of each input to the final output (Guiné et al., 2015d).
Data encoding and modeling
The ANN used was a feed-forward model, created using Matlab™1 fitnet function, which is designed for data fitting of datasets such as the ones used in the present work. Sigmoidal transfer function, which is a universal approximator, was used in the hidden layer, with a linear transfer function in the output layer (Guiné et al., 2015d). Training is based on Levenberg-Marquartd method and the Mean Squared Error (MSE) method for performance assessment, as in fitnet function default configuration.
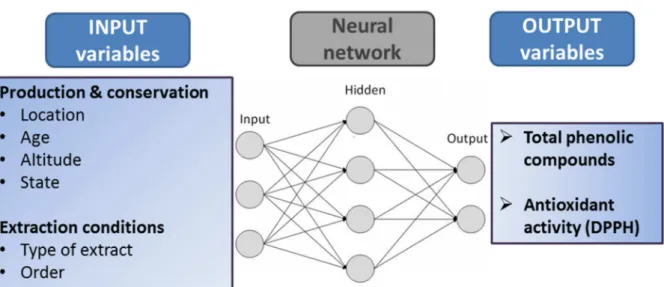
Since neural networks use inductive reasoning, in general more samples produce better models and more confidence in the result. In the present work, the dataset contained 121 experimental results. Figure 3 shows the input and output variables to consider in the ANN modelling and Table 2 summarises the input variables, which were split into a total of 12
variables for better neural network fitting and analysis. Age and altitude of the farm were floating point numbers normalised in the interval [0, 1]. Li, Si and Ei were Boolean values.
Figure 3 – Input and output variables to consider in the ANN analysis.
Table 2. Encoding of the input variables.
Input # Input Variable Description
1-5 L1-L5 Location (Sever do Vouga, Estarreja, Oliveira do Hospital, Vouzela, Braga)
6 A Age of the bushes [0, 1]
7 H Altitude of the farm [0, 1] 8, 9 S1, S2 State (Fresh, Frozen)
10, 11 E1, E2 Type of extract used (Methanol, Acetone) 12 O Order of the extract (First, Second)
To facilitate the process of training the neural networks and analysis of the results, each output variable was processed separately. Each network had just one hidden layer with one input neuron and one output neuron. For each run, the Matlab script randomly selected approximately 70 % of the samples for the train subset, 15 % for the validation subset and the remainder samples were used for the test subset.
RESULTS AND DISCUSSION
Total phenolic compounds
Figure 4 shows the total phenolic compounds evaluated in the blueberries from Sever do Vouga, according to type of solvent used for the extraction, order of extraction and state (fresh as opposed to frozen for a period of 6 months). The results show that the first extraction with methanol is by far the most effective in recovering phenolic compounds from the sample, accounting for 59% of all the phenols extracted. The following extraction with methanol is not so effective, allowing obtaining just 11% of the total phenols extracted. The first extraction with acetone is again more effective than the second, but comparing to methanol it is much lower, 21% and 9%, respectively for the first and second extractions. This reveals that the phenolic compounds present in the blueberries were mainly polar, and hence their higher affinity for the polar solvent (methanol). The type of solvent has proved to influence the extraction of the phenolic compounds, including for the different solubilities according to polarity of the molecules of the solvents and the phenolic compounds (Guiné et al., 2015b). While methanol shows a good efficiency in extracting lower molecular weight polyphenols, the higher molecular weight compounds are better extracted with aqueous acetone (Guiné et al., 2015b).
Figure 4 – Phenolic compounds by extract in the blueberries from Sever do Vouga (Bars with the same letter are not significantly different (p<0.05)).
Figure 5 shows the same results for the samples collected in Oliveira do Hospital, Vouzela, Estarreja and Braga. The first extraction with methanol always accounts for the highest percentage of phenolic compounds, for all sample origins and both in the fresh and frozen blueberries. Following is the 3rd extract, which is the first with the solvent acetone. The relative importance of the 2nd and 4th extracts is low, for these extract a very low amount of phenolic compounds. This trend has been observed previously for blueberries and pears (Guiné et al., 2015a; b).
As to the different origins, it stands out the sample from Oliveira do hospital, with the lowest quantity of phenols, as comparing to all others. Factors that may be responsible for these differences could be: cultural practices (irrigation method, quantity of water available, treatments applied) or climatic differences (intensity of UV radiation, daily temperature range, or the difference between the minimum and maximum temperatures during the day) (Dragović-Uzelac et al., 2010; Eichholz et al., 2011; Granelli et al., 2012)
Figure 5 – Phenolic compounds by extract in the blueberries from Oliveira do Hospital, Vouzela, Estarreja and Braga (Bars with the same letter are not significantly different (p<0.05)).
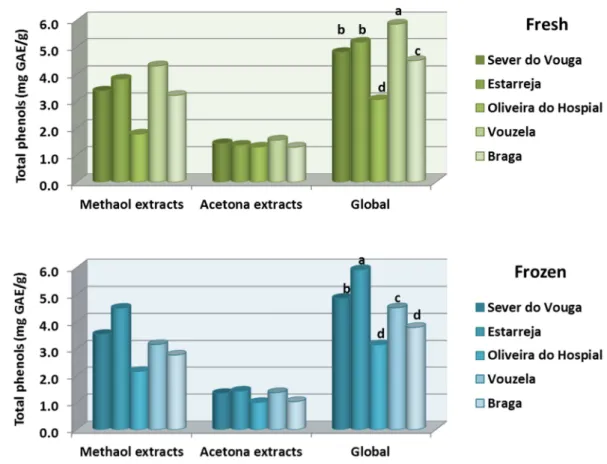
Figure 6 presents for all samples the sum of the phenolic compounds extracted with methanol or with acetone, and then the global value (which includes both solvents). The graphs show that methanol is more efficient in extracting the phenols from the blueberries, accounting for more than twice those extracted with acetone, and this trend is valid for both samples, fresh or frozen. The phenolic compounds comprise a polar part, constituted by one or more hydroxyl groups, which is attached to the aromatic ring (non-polar). This structure allows distinguishing phenols according to their polarity, which naturally influences the efficiency of their extraction depending on the nature of the solvent used (Meneses et al., 2013).
Figure 6 – Total Phenolic compounds in the blueberries for all origins (Bars with the same letter are not significantly different (p<0.05)).
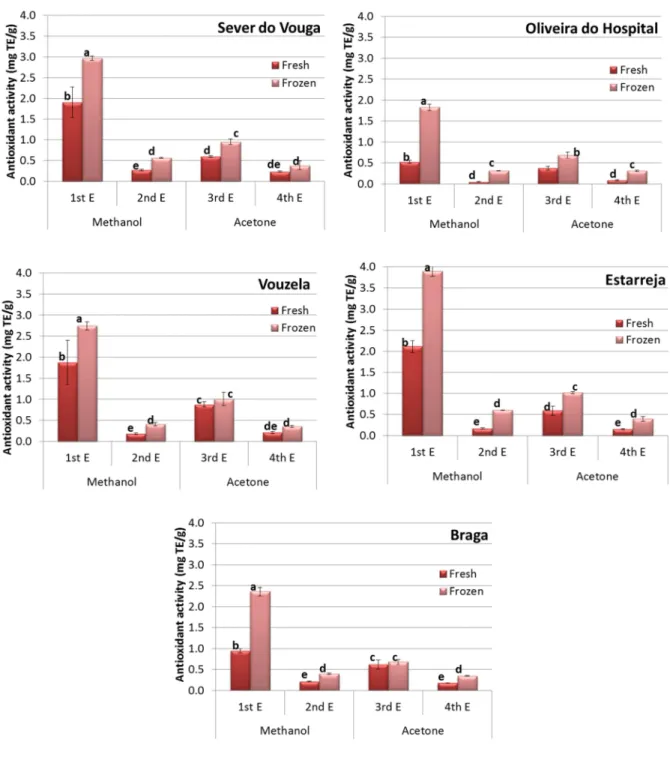
Antioxidant activity
The graphs in Figure 7 present the antioxidant activity determined by DPPH method. The results show that the antioxidant activity is higher in the first extract with methanol for all sample origins, followed by that in the 3rd extract (the first with acetone). This result is in accordance with that of the phenolic compounds, since it is expected that phenols have a large contribution for the antioxidant activity. Again the blueberries from Oliveira do Hospital show the lowest antioxidant activity quantified from all origins. It has been observed that phenolic compounds are intimately related to the antioxidant activity in fruits and other plant materials, and therefore it is expected that a lower amount of phenolics may be
associated with a lower antioxidant capacity (Santos et al., 2014; Guiné et al., 2014; Gonçalves et al., 2015; Guiné et al., 2015c; a)
Figure 7 – Antioxidant activity (DPPH) in the blueberries quantified in the different extracts (Bars with the same letter are not significantly different (p<0.05)).
The results for the antioxidant activity in Figure 8 confirm that the methanol extracts exhibit higher antioxidant capacity as compared to the acetone extracts, both in fresh and after freezing. Furthermore, a consistent trend was observed for the antioxidant activity to be higher when the blueberries were kept frozen for a period of 6 months than the fresh sample.
Figure 8 – Antioxidant activity (DPPH) in the blueberries from different origins (Bars with the same letter are not significantly different (p<0.05)).
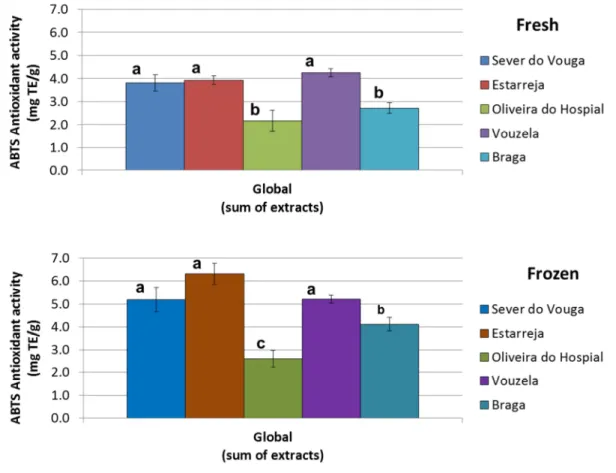
Figure 9 shows the results obtained for antioxidant activity through the ABTS method, but globally, i.e., considering the sum of all four extracts. The trend observed for ABTS results is similar to that previously seen for DPPH, so that the blueberruies from Olievira do Hospital
present the lowest antioxidant activity, either fresh or frozen. Furthermore, with the freezing operation the antioxidant activity tends to increase.
Figure 9 – Antioxidant activity (ABTS) in the blueberries quantified in the different extracts (Bars with the same letter are not significantly different (p<0.05)).
Figure 10 shows that, although the results obtained with both methods are different in values, there is a strong correlation between both methods, with determination coefficients of 0.9653 and 0.9343 for the frozen and fresh samples, respectively.
Figure 10 – Correlations between antioxidant activities determined through ABTS and DPPH methods.
ANN modeling
The neural networks used learn by adjusting weights and bias of connections, so those weights and bias reflect the contribution of the inputs to predict the output. The bias, being constants, are not relevant to the present analysis.
Experimental results
Many different experiments were performed for each output variable. The result of the learning process depends on some random values, such as the initial weights and bias of each neural connection and the samples selected for the test and validation sets. Therefore, the final results obtained can be different between experiments. The best neural network models will produce the best correlations between values predicted by the neural network and the experimental values measured in the laboratory. For better confidence in the analysis,
different experiments were performed in the present study, and the results shown are the average of five selected experiments. Training each model in Matlab took, on average, less than 16 epochs, and required, on average, less than 0.3 seconds, as measured using Matlab tic - toc commands.
Table 3 summarizes some performance parameters of the models. The correlation factors R are greater than 0.98 for the whole dataset, and the Mean Squared Errors (MSE) are very low. Therefore, the models are in general very reliable for the dataset.
Table 3 – Performance of the ANN models used to predict TP and DPPH, assessed as correlation factor R and MSE.
TP DPPH
Model performance measures
R
Train subset 0.989 0.991 Test subset 0.987 0.935 All dataset 0.988 0.995
Table 4 shows the weights measured for each input variable, normalized in the interval [-1, 1] to facilitate the analysis. The sign of a weight is important to show whether the corresponding variable influences the result positively or negatively. The absolute value predicts how important the variable is in the context. Variables with low absolute values will be almost irrelevant to the output.
Table 4 – Input weights for each variable.
TP DPPH
Input weight for each input (average of 5) Location 1 - Sever do Vouga 0.060 0.067 2 - Estarreja 0.256 0.255 3 - Oliveira Hospital 0.099 0.121 4 - Vouzela 0.371 0.403 5 - Braga 0.333 0.312 Origin Bushes' age 0.244 0.244 Altitude 0.244 0.246 State Fresh 0.253 0.203 Frozen 0.286 0.343 Extraction Methanol 0.494 0.451 Acetone 0.059 0.069 Extract order -1.000 -0.926
Analysis of the input neurons’ weights
Table 4. It is clear from the chart that both TP and DPPH behave in a similar way. The inputs that are important for one variable affect the other in a very similar proportion.
Figure 11 – Input weights for each variable.
Not surprisingly, the order of the extract is the most important predictor. The second extraction always retrieves much less phenolic contents or antioxidants than the first extraction, and the neural weights reflect that by showing a large negative weight to the order of the extract. The type of solvent used is the second best predictor. Methanol has a normalized weight above 0.45 for both variables, showing that when methanol is used the amount of phenolic contents and antioxidants extracted will be higher, while the use of acetone shows an almost negligible contribution.
The chart also illustrates very clearly the importance of the farm location. Vouzela and Braga, followed by Estarreja, were given significant weights, always above 0.25. On the other hand, the models are almost totally indifferent to Oliveira do Hospital and Sever do Vouga, which receive weights less than 0.13 for both variables.
The role of altitude of the farm is also illustrated, as well as the bushes’ ages. Both variables seem to play marginal roles, but they have an equal contribution to the amounts of TP and DPPH measured. Since altitude, in meters, and age, in years, are mapped in the interval [0, 1]
in the input, the models point that older bushes at higher altitudes are most likely to produce berries richer in phenolic compounds and antioxidants.
As for the conservation methods, the models concur that freezing should preserve at least more DPPH – the latter is more likely to be found in frozen samples than in fresh samples. The state Frozen is actually the fourth most important predictor for DPPH, and fifth for TP.
CONCLUSIONS
The quantity of phenolic compounds present in different samples of blueberries was measured, as well as the antioxidant capacity, being also the results evaluated by neural network models.
The results indicated that the type of extract and the order of extraction greatly influenced the phenolic compounds and the antioxidant activity, with methanol showing better extraction capacity than acetone and the first extraction showing higher efficiency as compared to the second. Also the cultivation place influenced these properties, so that the blueberries from Oliveira do Hospital presented lower phenolic contents and lower antioxidant activity. Furthermore, a small correlation was found showing that older bushes at higher altitudes produced berries richer in phenols and antioxidants. With regard to conservation, no influence was observed for phenols but a slight influence could be detected for antioxidant activity.
LITERATURE CITED
Adams, L.S., S. Phung, N. Yee, N.P. Seeram, L. Li, and S. Chen. 2010. Blueberry phytochemicals inhibit growth and metastatic potential of MDA-MB-231 breast cancer cells through modulation of the phosphatidylinositol 3-kinase pathway. Cancer Res. 70(9): 3594–3605.
Brand-Williams, W., M.E. Cuvelier, and C. Berset. 1995. Use of a free radical method to evaluate antioxidant activity. LWT - Food Science and Technology 28(1): 25–30.
Cabrera, A.C., and J.M. Prieto. 2010. Application of artificial neural networks to the prediction of the antioxidant activity of essential oils in two experimental in vitro models. Food Chemistry 118(1): 141–146.
Cantín, C.M., I.S. Minas, V. Goulas, M. Jiménez, G.A. Manganaris, T.J. Michailides, and C.H. Crisosto. 2012. Sulfur dioxide fumigation alone or in combination with CO2-enriched atmosphere extends the market life of highbush blueberry fruit. Postharvest Biology and Technology 67: 84–91.
Chen, H., S. Cao, X. Fang, H. Mu, H. Yang, X. Wang, Q. Xu, and H. Gao. 2015. Changes in fruit firmness, cell wall composition and cell wall degrading enzymes in postharvest blueberries during storage. Scientia Horticulturae 188: 44–48.
Die, J.V., and L.J. Rowland. 2014. Elucidating cold acclimation pathway in blueberry by transcriptome profiling. Environmental and Experimental Botany 106: 87–98.
Dragović-Uzelac, V., Z. Savić, A. Brala, B. Levaj, D.B. Kovačević, and A. Biško. 2010. Evaluation of Phenolic Content and Antioxidant Capacity of Blueberry Cultivars (Vaccinium corymbosum L.) Grown in the Northwest Croatia. Food Technology and Biotechnology 48(2): 214–221.
Duan, J., R. Wu, B.C. Strik, and Y. Zhao. 2011. Effect of edible coatings on the quality of fresh blueberries (Duke and Elliott) under commercial storage conditions. Postharvest Biology and Technology 59(1): 71–79.
Eichholz, I., S. Huyskens-Keil, A. Keller, D. Ulrich, L.W. Kroh, and S. Rohn. 2011. UV-B-induced changes of volatile metabolites and phenolic compounds in blueberries (Vaccinium corymbosum L.). Food Chemistry 126(1): 60–64.
Folta, K.M., and C. Kole. 2011. Genetics, Genomics and Breeding of Berries. CRC Press, EUA.
Giongo, L., P. Poncetta, P. Loretti, and F. Costa. 2013. Texture profiling of blueberries (Vaccinium spp.) during fruit development, ripening and storage. Postharvest Biology and Technology 76: 34–39.
Gonçalves, C., R.P.F. Guiné, D.V.T.A. Costa, and F.J. Gonçalves. 2015. Evaluation of Bioactive Phenols in Blueberries from Different Cultivars. International Journal of Biological, Food, Veterinary and Agricultural Engineering 9(4): 281–284.
Gonçalves, F.J., S.M. Rocha, and M.A. Coimbra. 2012. Study of the retention capacity of anthocyanins by wine polymeric material. Food Chem 134(2): 957–963.
Granelli, G., L. Mariani, S. Parisi, T. Eccher, V. Ughini, R. Lo Scalzo, M. Buccheri, and G. Cortellino. 2012. Influence of Genotype , Location and Year Factors on Quality and Health Promoting Compounds of Rubus Fruits. Acta Horticulturae 926: 697–704. Guiné, R., M.J. Barroca, F. Gonçalves, M. Alves, S. Oliveira, and P. Correia. 2015a. Effect of
Drying on Total Phenolic Compounds, Antioxidant Activity, and Kinetics Decay in Pears. International Journal of Fruit Science 15(2): 173–186.
Guiné, R.P.F., M.J. Barroca, F.J. Gonçalves, M. Alves, S. Oliveira, and M. Mendes. 2015b. Artificial neural network modelling of the antioxidant activity and phenolic compounds of bananas submitted to different drying treatments. Food Chemistry 168: 454–459.
Guiné, R.P.F., S. Matos, D.V.T.A. Costa, and F. Gonçalves. 2015c. Statisical analysis of the factors that influence the properties of blueberries from cultivar bluecrop. International Journal of Biological, Biomolecular, Agricultural, Food and Biotechnological Engineering 9(10): 917–922.
Guiné, R.P.F., S. Matos, F. Gonçalves, D.V.T.A. Costa, and M. Mendes. 2015d. Modeling of the phenolic compounds and antioxidant activity of blueberries by artificial neural networks for data mining. p. 10 pp. In Proceeding of the ICEUBI2015. Covilhã, Portugal.
Guiné, R.P.F., S.M.A. Soutinho, and F.J. Gonçalves. 2014. Phenolic compounds and antioxidant activity in red fruits produced in organic farming. Croatian Journal of Food Science and Technology 6(1): 15–26.
Gutés, A., F. Céspedes, S. Alegret, and M. del Valle. 2005. Determination of phenolic compounds by a polyphenol oxidase amperometric biosensor and artificial neural network analysis. Biosensors and Bioelectronics 20(8): 1668–1673.
Hancock, J., P. Callow, S. Serçe, E. Hanson, and R. Beaudry. 2008. Effect of Cultivar, Controlled Atmosphere Storage, and Fruit Ripeness on the Long-term Storage of Highbush Blueberries. HortTechnology 18(2): 199–205.
Holzapfel, E.A., R.F. Hepp, and M.A. Mariño. 2004. Effect of irrigation on fruit production in blueberry. Agricultural Water Management 67(3): 173–184.
Koca, I., and B. Karadeniz. 2009. Antioxidant properties of blackberry and blueberry fruits grown in the Black Sea Region of Turkey. Scientia Horticulturae 121(4): 447–450. Meneses, N.G.T., S. Martins, J.A. Teixeira, and S.I. Mussatto. 2013. Influence of extraction
solvents on the recovery of antioxidant phenolic compounds from brewer’s spent grains. Separation and Purification Technology 108: 152–158.
Miller, N.J., C. Rice-Evans, M.J. Davies, V. Gopinathan, and A. Milner. 1993. A novel method for measuring antioxidant capacity and its application to monitoring the antioxidant status in premature neonates. Clin. Sci. 84(4): 407–412.
Prior, R.L., X. Wu, L. Gu, T. Hager, A. Hager, S. Wilkes, and L. Howard. 2009. Purified berry anthocyanins but not whole berries normalize lipid parameters in mice fed an obesogenic high fat diet. Mol Nutr Food Res 53(11): 1406–1418.
Santos, S.C.R.V.L., R.P.F. Guiné, and A. Barros. 2014. Effect of drying temperatures on the phenolic composition and antioxidant activity of pears of Rocha variety (Pyrus communis L.). Food Measure 8(2): 105–112.
Shi, J., Z. Pan, T.H. McHugh, D. Wood, E. Hirschberg, and D. Olson. 2008. Drying and quality characteristics of fresh and sugar-infused blueberries dried with infrared radiation heating. LWT - Food Science and Technology 41(10): 1962–1972.
Stoner, G.D., L.-S. Wang, and B.C. Casto. 2008. Laboratory and clinical studies of cancer chemoprevention by antioxidants in berries. Carcinogenesis 29(9): 1665–1674.
Vats, S., and S. Negi. 2013. Use of artificial neural network (ANN) for the development of bioprocess using Pinus roxburghii fallen foliages for the release of polyphenols and reducing sugars. Bioresour. Technol. 140: 392–398.
Wolfe, K.L., X. Kang, X. He, M. Dong, Q. Zhang, and R.H. Liu. 2008. Cellular antioxidant activity of common fruits. J. Agric. Food Chem. 56(18): 8418–8426.
Wu, X., G.R. Beecher, J.M. Holden, D.B. Haytowitz, S.E. Gebhardt, and R.L. Prior. 2004. Lipophilic and hydrophilic antioxidant capacities of common foods in the United States. J. Agric. Food Chem. 52(12): 4026–4037.
Wu, X., J. Kang, C. Xie, R. Burris, M.E. Ferguson, T.M. Badger, and S. Nagarajan. 2010. Dietary blueberries attenuate atherosclerosis in apolipoprotein E-deficient mice by upregulating antioxidant enzyme expression. J. Nutr. 140(9): 1628–1632.
Xi, J., Y. Xue, Y. Xu, and Y. Shen. 2013. Artificial neural network modeling and optimization of ultrahigh pressure extraction of green tea polyphenols. Food Chemistry 141(1): 320–326.
Youdim, K.A., B. Shukitt-Hale, A. Martin, H. Wang, N. Denisova, P.C. Bickford, and J.A. Joseph. 2000. Short-Term Dietary Supplementation of Blueberry Polyphenolics: Beneficial Effects on Aging Brain Performance and Peripheral Tissue Function. Nutritional Neuroscience 3(6): 383–397.
Zhou, Q., C. Ma, S. Cheng, B. Wei, X. Liu, and S. Ji. 2014a. Changes in antioxidative metabolism accompanying pitting development in stored blueberry fruit. Postharvest Biology and Technology 88: 88–95.
Zhou, Q., C. Zhang, S. Cheng, B. Wei, X. Liu, and S. Ji. 2014b. Changes in energy metabolism accompanying pitting in blueberries stored at low temperature. Food Chemistry 164: 493–501.
Zielinska, M., P. Sadowski, and W. Błaszczak. 2015. Freezing/thawing and microwave-assisted drying of blueberries (Vaccinium corymbosum L.). LWT - Food Science and Technology 62(1, Part 2): 555–563.