Ana Teresa Lourenço Santos
Licenciada em Ciências da Engenharia Química e Bioquimica
EVALUATION OF UV SPECTROPHOTOMETRY
FOR ESTIMATION OF NITRITE AND NITRATE
IN NITRIFIED URINE
Dissertação para obtenção do Grau de Mestre em
Engenharia Química e Bioquímica
Orientadores: Kris Villez, Doutor, EAWAG
Alma Mašić
, Doutora, EAWAG
Co-orientadora: Maria Ascensão Reis, Professora Doutora,
FCT/UNL
Júri:
Presidente: Professora Doutora Isabel Maria de Figueiredo Ligeiro da Fonseca, FCT-UNL
Arguente: Doutor Adrian Michael Oehmen, FCT-UNL
Vogal: Doutor Kris Roger Elie Villez, EAWAG
Ana Teresa Lourenço Santos
Licenciada em Ciências da Engenharia Química e Bioquimica
EVALUATION OF UV SPECTROPHOTOMETRY
FOR ESTIMATION OF NITRITE AND NITRATE IN
NITRIFIED URINE
Dissertação apresentada à Faculdade de Ciências e Tecnologia da Universidade Nova de Lisboa para obtenção do Grau de Mestre em Engenharia Química e Bioquímica
EVALUATION OF UV SPECTROPHOTOMETRY FOR ESTIMATION
OF NITRITE AND NITRATE IN NITRIFIED URINE
Copyright @ Ana Teresa Lourenço Santos, Faculdade de Ciências e Tecnologia, Universidade Nova de Lisboa
ACKNOWLEDGEMENTS
I would like to express my sincere appreciation to everyone who contributed to the development of this thesis.
In the first place I would like to express my gratitude to my supervisors, Doctor Kris Villez and
Doctor Alma Mašić, for promoting truly stimulating discussions and giving me valuable suggestions which have helped steering this work. Also for their inspiration, encouragement and invaluable guidance throughout my work.
I am especially indebted to Professor Maria Ascensão Reis, my co-supervisor and course coordinator, for the opportunity I was given and for her encouragement and constant support.
My sincere gratitude also goes to everyone within Eawag, for receiving me in such a kind way. Working in Eawag has been an extraordinary adventure: the work, the daily challenges, the sharing and especially the people. Special thanks to Alexandra Fumasoli and Bettina Sterkele, for their invaluable help and all the sharing of ideas.
A very special thank you goes to Annette Remele, Manuel Krähenbühl, David Weissbrodt and Anita Wittmer, my office mates, for all affection, constant help during my stay at Eawag to make me feel welcomed and for providing me with an enjoyable working atmosphere.
I would like to thank to my laboratory colleagues Ann-Kathrin, Philippe, Jonathan and Tony for their charisma and fun energy. I was really fortunate to rely on them during my long days at the laboratory.
I am grateful to Claudia Bänninger and Karin Rottermann for their assistance in the laboratory and Arianne Eberhardt for all the bureaucratic support.
A special thanks to my friends, especially to Diana Gaspar, Cátia Silva and Vítor Cardoso for their unconditional support and for being always present, even from far.
i ABSTRACT
Water is a limited resource for which demand is growing. Contaminated water from inadequate wastewater treatment provides one of the greatest health challenges as it restricts development and increases poverty in emerging and developing countries. Therefore, the connection between wastewater and human health is linked to access to sanitation and to human waste disposal. Adequate sanitation is expected to create a barrier between disposed human excreta and sources of drinking water. Different approaches to wastewater management are required for different geographical regions and different stages of economic governance depending on the capacity to manage wastewater. Effective wastewater management can contribute to overcome the challenges of water scarcity.
Separate collection of human urine at its source is one promising approach that strongly reduces the economic and load demands on wastewater treatment plants (WWTP). Treatment of source-separated urine appears as a sanitation system that is affordable, produces a valuable fertiliser, reduces pollution of water resources and promotes health. However, the technical realisation of urine separation still faces challenges. Biological hydrolysis of urea causes a strong increase of ammonia and pH. Under these conditions ammonia volatilises which can cause odour problems and significant nitrogen losses.
The above problems can be avoided by urine stabilisation. Biological nitrification is a suitable process for stabilisation of urine. Urine is a highly concentrated nutrient solution which can lead to strong inhibition effects during bacterial nitrification. This can further lead to process instabilities. The major cause of instability is accumulation of the inhibitory intermediate compound nitrite, which could lead to process breakdown. Enhanced on-line nitrite monitoring can be applied in biological source-separated urine nitrification reactors as a sustainable and efficient way to improve the reactor performance, avoiding reactor failures and eventual loss of biological activity. Spectrophotometry appears as a promising candidate for the development and application of on-line nitrite monitoring.
Spectroscopic methods together with chemometrics are presented in this work as a powerful tool for estimation of nitrite concentrations. Principal component regression (PCR) is applied for the estimation of nitrite concentrations using an immersible UV sensor and off-line spectra acquisition. The effect of particles and the effect of saturation, respectively, on the UV absorbance spectra are investigated. The analysis allows to conclude that (i) saturation has a substantial effect on nitrite estimation; (ii) particles appear to have less impact on nitrite estimation. In addition, improper mixing together with instabilities in the urine nitrification process appears to significantly reduce the performance of the estimation model.
iii RESUMO
A água é um recurso limitado para o qual a procura é crescente. A água contaminada proveniente de tratamento inadequado de águas residuais conduz a um dos maiores desafios ao nível da saúde, condicionado o desenvolvimento de países em vias de desenvolvimento. O vínculo entre águas residuais e saúde humana está directamente relacionado com o acesso a saneamento e com a eliminação de resíduos humanos. Espera-se que sistemas de saneamento adequados permitam a separação eficaz de dejectos humanos de correntes de águas limpas. Desta forma, são requeridas diferentes abordagens na gestão de águas residuais de acordo com diferentes áreas geográficas e respectivos níveis de desenvolvimento económico. A gestão eficaz de águas residuais pode contribuir para solucionar a problemática de escassez de água.
A separação diferenciada de urina humana surge como uma promissora abordagem no sentido de reduzir grandemente as exigências económicas e energéticas em estações de tratamento de águas residuais. O tratamento de urina diferenciada apresenta-se como um sistema de saneamento económicamente viável, que possibilita a produção de um fertilizante de grande valor, reduzindo ainda a poluição dos recursos hidricos e promovendo a saúde humana. No entanto, a técnica de separação diferenciada de urina enfrenta ainda alguns desafios. A hidrólise biológica da ureia causa um aumento notável de amónia e pH. Nestas condições ocorre volatilização da amónia o que pode originar problemas de odor e percas significativas de azoto. Os problemas referidos podem ser evitados através da estabilização da urina, sendo a nitrificação biológica um processo apropriado para a sua estabilização. Sendo a urina uma solução de nutrientes extremamente concentrada, podem ocorrer durante a nitrificação significativos efeitos de inibição. A principal causa de falhas no processo é a acumulação de nitrito (intermediário da reacção) que funciona como inibidor, o que pode levar ao colapso do processo. A monitorização on-line do nitrito pode ser aplicada em reactores de nitrificação de urina diferenciada como uma forma sustentável e eficiente para melhorar o desempenho do mesmo, evitando falhas e, eventualmente, a perda de atividade biológica. A espectrofotometria é uma técnica promissora para o desenvolvimento e aplicação da monitorização on-line de nitrito. Métodos espectroscópicos juntamente com métodos quemiométricos são apresentados neste trabalho como uma ferramenta valiosa para estimar as concentrações de nitrito. Uma regressão de componentes principais (PCR) é desenvolvida para estimar as concentrações de nitrito recorrendo a um sensor de UV imersível e a aquisição espectral off-line. Neste trabalho são investigados o efeito de partículas e o efeito de saturação no espectro de absorção UV. A análise permite concluir que (i) a saturação apresenta um efeito significativo na quantificação de nitrito; (ii) as partículas afiguram-se como tendo uma importância menor na quantificação de nitrito. Adicionalmente, agitação imprópria juntamente com instabilidades no processo de nitrificação de urina reduzem significativamente a eficiência do modelo.
v TABLE OF CONTENTS
ABSTRACT ... i
RESUMO ... iii
1 INTRODUCTION ... 1
1.1 BACKGROUND ... 1
1.2 OBJECTIVES ... 4
1.3 STRUCTURE OF THE THESIS ... 4
2 LITERATURE REVIEW ... 7
2.1 URINE SOURCE SEPARATION ... 7
2.2 BIOLOGICAL PROCESSES... 8
2.2.1 UREA HYDROLYSIS: UREOLYSIS ... 8
2.2.2 BIOLOGICAL NITRIFICATION ... 8
2.3 ULTRAVIOLET (UV) SPECTROSCOPY ... 9
2.4 CHEMOMETRICS ... 11
3 MATERIALS AND METHODS ... 15
3.1 RESEARCH STRATEGY ... 15
3.2 MATERIALS... 16
3.2.1 URINE SAMPLES ... 16
3.2.2 UV SPECTROMETER ... 16
3.2.3 REFERENCE TESTS: Hach-Lange Cuvette Tests ... 17
3.2.4 FILTERS ... 17
3.2.5 REAGENTS ... 18
3.3 EXPERIMENTAL PROCEDURE ... 19
3.3.1 PRIMARY SATURATION EFFECT EXPERIMENT ... 19
3.3.1.1 Sample Collection and Pre-treatment (Decantation) ... 19
3.3.1.2 Sample Dilutions ... 20
3.3.1.3 UV-Spectra Collection ... 21
3.3.1.4 Chemical Analysis: Ammonium, nitrite and nitrate determination ... 21
3.3.2 PARTICLES AND SATURATION EFFECT EXPERIMENT ... 22
3.3.2.1 Sample Collection and Pre-treatment (Decantation) ... 22
3.3.2.2 Sample Filtration ... 22
3.3.2.3 Sample Preparation/Dilution ... 23
3.3.2.4 Preparation of Nitrite Stock-Solutions ... 24
3.3.2.5 UV-Spectra Collection and Analysis ... 24
3.3.2.6 Chemical Analysis: Ammonium, nitrite and nitrate determination ... 25
3.4 MODELLING ... 26
3.4.1 PRIMARY SATURATION EFFECT EXPERIMENT ... 26
3.4.2 PARTICLES AND SATURATION EFFECT EXPERIMENT ... 27
3.4.2.1 Data Pre-Processing ... 27
3.4.2.2 PCA Calibration: Singular Value Decomposition (SVD) ... 28
3.4.2.3 PCA Application ... 28
3.4.2.5 Cross-validation ... 29
4 RESULTS AND DISCUSSION ... 31
4.1 AMMONIUM, NITRITE AND NITRATE DETERMINATION ... 31
4.2 PRIMARY EVALUATION ON SATURATION EFFECT ... 33
4.3 PARTICLES EFFECT AND SATURATION EFFECT EXPERIMENT ... 38
4.3.1 ESTIMATION OF NITRITE (NO2--N) CONCENTRATIONS ... 39
4.3.1.1 Case (1) - Micro Filtration (0.7 µm), Dilution (1:10) and NO2- stock-solution addition (5 ml) ... 39
4.3.1.2 CASE (2) –Non-Filtration, Dilution (1:10) and NO2- stock-solution addition (5 ml) ... 43
4.3.1.3 CASE (3) – Micro Filtration (0.7 µm), non-Dilution and NO2- stock-solution addition (5 ml) ... 46
4.3.1.4 Summary of Results for cases (1), (2) and (3) ... 49
4.3.1.5 CASE (1.1) - Micro Filtration (0.7 µm), Dilution (1:10) and NO2- stock-solution addition (5 ml) ... 50
4.3.1.6 CASE (2.1) –Non-Filtration, Dilution (1:10) and NO2- stock-solution addition (5 ml) ... 52
4.3.1.7 CASE (3.1) – Micro Filtration (0.7 µm), non-Dilution and NO2- stock-solution addition (5 ml) ... 54
4.3.1.8 Summary of Results for cases (1.1), (2.1) and (3.1) ... 57
4.3.2 ESTIMATION OF NITRATE (NO3--N) CONCENTRATIONS ... 58
4.3.2.1 CASE (1.1.1) - Micro Filtration (0.7 µm), Dilution (1:10) and NO2- stock-solution addition (5 ml) ... 58
5 CONCLUSIONS AND FUTURE DEVELOPMENTS ... 63
6 REFERENCES ... 67
APPENDIXES... 71
APPENDIX I. Matlab Code: Primary Saturation Effect Experiment... 71
APPENDIX II. Matlab Code: Particles and Saturation Effect Experiment ... 73
vii INDEX OF FIGURES
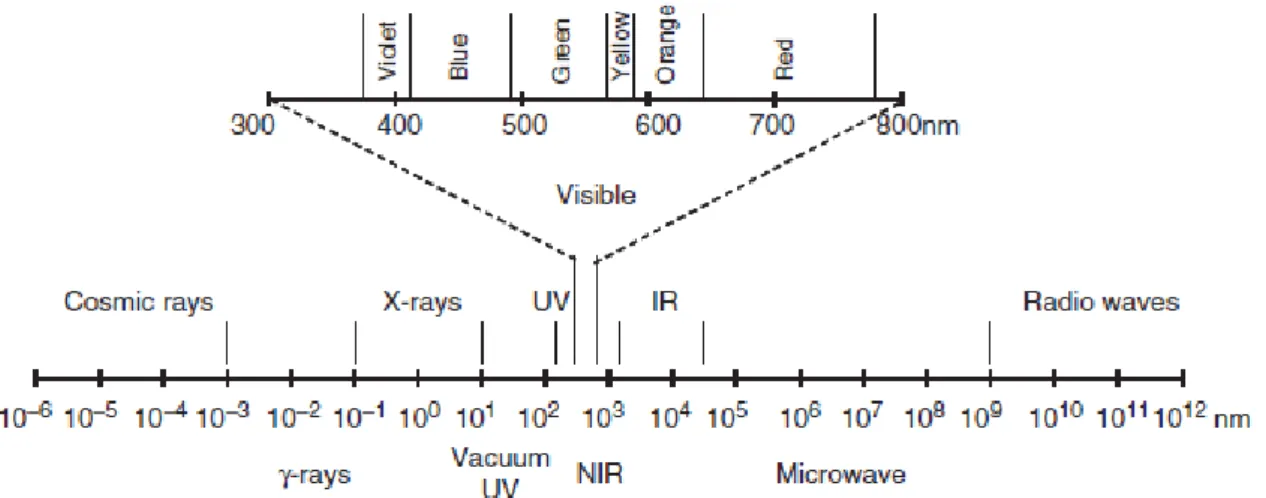
Figure 2.1. Electromagnetic spectrum (Thomas & Theraulaz, 2007) ... 10
Figure 3.1. s::can spectrometer probe - measuring section ... 16
Figure 3.2. Melitta® Coffee filter... 18
Figure 3.3. Schematic diagram of Saturation Effect Experiment ... 19
Figure 3.4. Sample Collection and Decantation steps: (a) Nitrification reactor; (b) Urine sampling (c) Urine plastic container; (d) Imhoff cones ... 20
Figure 3.5. Ammonium, nitrite and nitrate determination by means of Hach-Lange reference tests (a) Sample microfiltration; (b) Hach-Lange reference tests; (c) Hach DR2800 spectrophotometer ... 21
Figure 3.6. Schematic diagram of Particles Effect Experiment ... 22
Figure 3.7. Sample Filtration: (a) Coffee filtration and (b) Microfiltration ... 23
Figure 3.8. Non-diluted and 10x diluted samples ... 23
Figure 3.9. Data collection ... 24
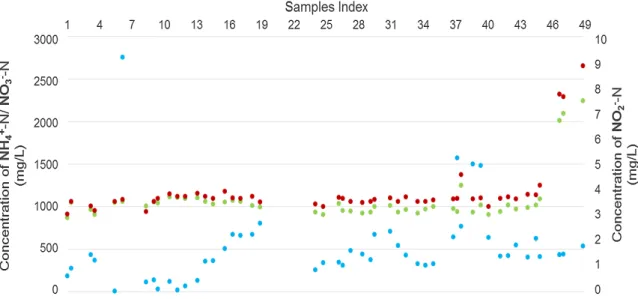
Figure 4.1. Measured ammonium, nitrite and nitrate concentrations in the collected samples, by means of reference tests ... 31
Figure 4.2. UV spectra for all the measured samples and for all applied dilutions ... 33
Figure 4.3. Absorbance for the chosen wavelengths (220, 225, 230, 235, 240 nm) as a function of Urine fraction for (a) data set 1 and (b) data set 2 ... 34
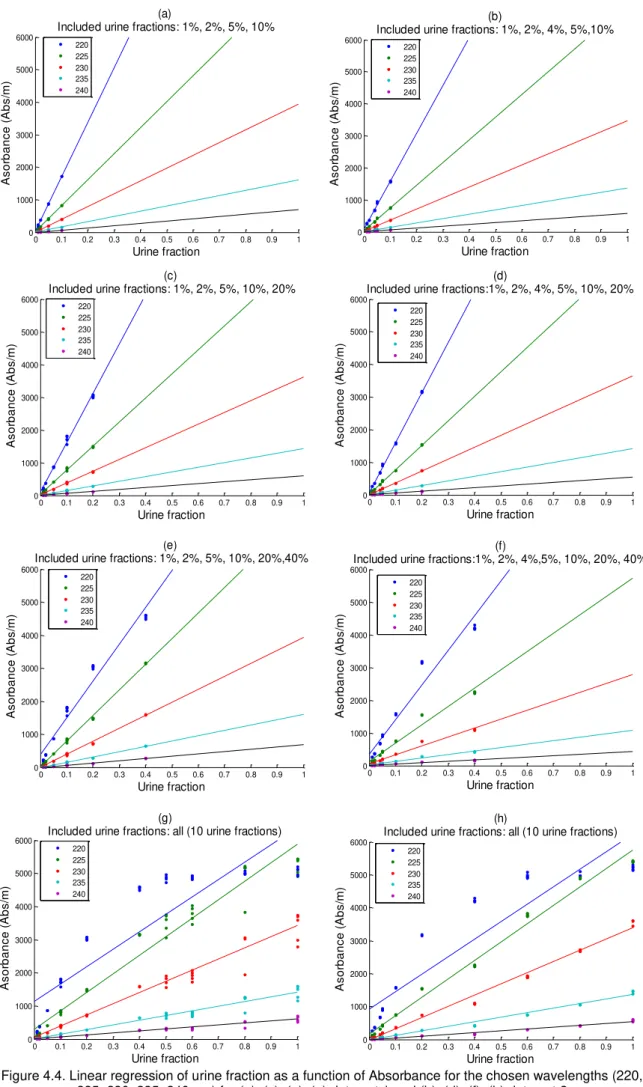
Figure 4.4. Linear regression of urine fraction as a function of Absorbance for the chosen wavelengths (220, 225, 230, 235, 240 nm) for (a), (c), (e), (g) data set 1 and (b), (d), (f), (h) data set 2 ... 35
Figure 4.5. (a)-(d) Predicted absorbances as function of measured absorbance, for the chosen wavelengths (220, 225, 230, 235, 240 nm) of data set 2 ... 36
Figure 4.6. (e)-(h) Prediction errors as function of measured absorbance, for the chosen wavelengths (220, 225, 230, 235, 240 nm) of data set 2 ... 37
Figure 4.7. Case 1. (a) UV absorbance spectra and (b) UV absorbance spectra centred, acquired for all the measured samples ... 39
Figure 4.8. Case 1. (a) Eigenvalues corresponding to the first 30 Principal Components; (b) Effect of original variables (loadings) upon 1st PC. ... 40
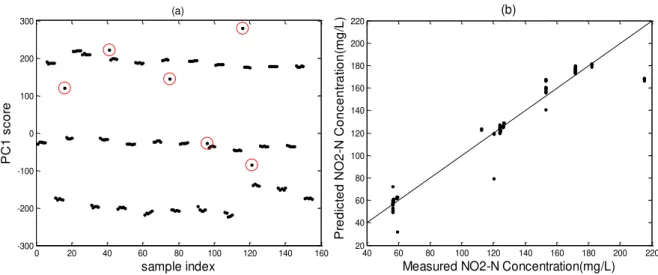
Figure 4.9. Case 1. (a) PC1 score as a function of sample index and (b) Nitrite Concentrations - predicted vs. measured with 1-PC model ... 41
Figure 4.10. Case1. (a) PC1 score as a function of sample index and (b) Nitrite Concentrations - predicted vs. measured with 1-PC model, after outliers removal ... 41
Figure 4.11. Case1. (a) SSR as a function of model dimensions for the validation data set; (b) Predicted Concentration as a function of Measured Concentration for the validation data set. . 42
Figure 4.12. Effect of original variables (loadings) upon 1st and 2nd PC for the calibration data set; (b) PC2 score as a function of sample index ... 43
Figure 4.13. Case 2. (a) Eigenvalues corresponding to the first 30 Principal Components; (b) Effect of original variables (loadings) upon 1st PC. ... 44
Figure 4.14. Case 2. (a) PC1 score as a function of sample index: (b) Nitrite Concentrations - predicted vs. measured with 1-PC model ... 44
Figure 4.15. Case 2. (a) PC1 score as a function of sample index and (b) Nitrite Concentrations - predicted vs. measured with 1-PC model, after outliers removal ... 45
Figure 4.16. Case 2. (a) SSR as a function of model dimensions for the validation data set; (b) Predicted Concentration as a function of Measured Concentration for the validation data set .. 45
Figure 4.17. Case 3. (a) Eigenvalues corresponding to the first 30 Principal Components; (b) Effect of original variables (loadings) upon 1st and 2nd PC ... 46
Figure 4.18. Case 3. (a) PC1 and (b) PC2 scores as a function of sample index ... 47
Figure 4.19. Case 3. Nitrite Concentrations - predicted vs. measured with 2-PCs model (a) before outlier removal and (b) after outlier removal ... 47
Figure 4.20. Case 3. (a) SSR as a function of model dimensions for the validation data set; (b) Predicted Concentration as a function of Measured Concentration for the validation data set .. 48
Figure 4.21. Case 1.1. (a) Eigenvalues corresponding to the first 30 Principal Components; (b) Effect of original variables (loadings) upon 1st PC. ... 50
Figure 4.22. Case 1.1. (a) PC1 score as a function of sample index and (b) Nitrite Concentrations - predicted vs. measured with 1-PC model, after outliers removal ... 51
ix INDEX OF TABLES
Table 3.1. Reference tests used for determination of ammonium, nitrite and nitrate
concentrations in the collected samples ... 17 Table 3.2. Glass microfiber filters used in experiments ... 17 Table 3.3. Sample dilutions applied for UV-spectra measurements ... 20 Table 3.4. Reference tests used for determination of ammonium, nitrite and nitrate
xi INDEX OF ACRONYMS
AOB Ammonia-Oxidising Bacteria
CV Cross Validation
EMR Electromagnetic Radiation HCO3- Carbonic Acid
HNO2 Nitrous Acid
LOOCV Leave-One-Out Cross Validation MBBR Moving Bed Biofilm Reactor NOB Nitrite-Oxidising Bacteria
NH3 Ammonia
NH4+ Ammonium
NO2- Nitrite
NO3- Nitrate
PCA Principal Component Analysis PCR Principal Component Regression PLS Partial Least Squares
SSR Sum of Squared Residuals
1 INTRODUCTION
1.1 BACKGROUND
The production of waste from human activities is inevitable. A significant part of this waste ends up as wastewater (Henze & Comeau, 2008). The primary aim of wastewater treatment is the removal of nutrients, organic matter and suspended solids contained in wastewater influent. This is usually carried out by using several unit processes, which include biological, chemical and physical treatment methods (Sedlak, 1991). Current treatment of wastewater presents several shortcomings throughout the treatment process, e.g. consumption of high amounts of resources, loss of valuable nutrients into water bodies and poor elimination of micropollutants (Udert et al., 2006). Furthermore, incomplete wastewater treatment contributes to eutrophication (Lienert & Larsen, 2009), caused by the water enrichment in nutrients, particularly phosphorus and nitrogen, which lead to great development of algae and consequent deterioration of water quality (Fernández et al., 2014). Thus, managing wastewater and the resources it contains is an important step towards ecologically sustainable development (Ganrot, 2005).
The importance of wastewater management is more striking in emerging and developing countries, which have inadequate infrastructure and resources to address wastewater management in an efficient and sustainable way. Therefore, providing adequate sanitation is a major challenge for these countries (Udert et al., 2006). Adapting centralized sanitation systems from industrialized countries to poorer and water scarce countries is nearly impossible as these systems require enormous capital investments and high amounts of water (Lienert & Larsen, 2009). Moreover, the typical wastewater treatment turns valuable resources into pollutants (Ganrot, 2005). Innovative approaches in wastewater management will generate significant returns, as addressing wastewater is a key step in reducing poverty and sustaining ecosystems (Corcoran et al., 2010). New technologies focus on the recovery of resources such as water, nutrients and energy instead of simply preventing pollution (Udert & Wächter, 2012). One very promising approach is the separation of wastewater streams and their specific treatment in decentralized reactors (Udert & Wächter, 2012). The separate collection and treatment of urine has attracted considerable attention in the engineering community in the last few years and has been seen as a viable option for enhancing the sustainability of wastewater management (Maurer et al., 2006).
Moreover, urine is a natural resource, which is available in all human societies, even in the poorest ones (Heinonen-Tanski et al., 2007).
Urine contains high amounts of nitrogen, phosphorus and potassium, which makes its use as a fertilizer in agriculture the most appropriate and obvious application (Maurer et al., 2006). Since fertilizers have a market value, separate collection and treatment of urine has the potential to motivate private business initiatives, which help to promote sanitation in emerging and developing countries (Udert & Wächter, 2012). In addition, urine treatment is also essential regarding the prevention of the release of micropollutants into the environment (Udert et al., 2006).
Apart from all the positive aspects of source-separated urine, some process aspects can be enhanced (Larsen & Gujer, 1996). Source-separated urine is a highly concentrated and unstable solution (Udert et al., 2003). Fresh urine contains salts, soluble organic matter and urea. During storage, urine undergoes microbial contamination. Urea, the main component of urine, decomposes quickly (hydrolysis) into ammonia (NH3) and carbonic acid (HCO3-). Ammonia is released into the bulk liquid and the pH increases strongly. At the same time, organic matter is degraded and malodorous compounds are produced (Maurer et al., 2006). After storage, urine contains a large amount of ammonia, which can volatilise and be lost during transport or application as fertilizer (Udert et al., 2003). This can be avoided by stabilisation of urine. Urine stabilisation can be performed by means of biological nitrification (Udert & Wächter, 2012). The urine stabilisation is essential to prevent both environmental pollution and negative effects on human health as well as to retain nitrogen in solution for later recovery (Udert et al., 2006). Biological nitrification is a microbial process by which reduced nitrogen compounds (primarily ammonia) are sequentially oxidized to nitrite (NO2-) and nitrate (NO3-), by ammonia oxidising bacteria (AOB) and nitrite oxidising bacteria (NOB), respectively. High concentrations in urine, mainly of salt, ammonia and nitrous acid (HNO2), can inhibit biological nitrification and make the process sensitive to instabilities. A major concern is accumulation of the inhibitory intermediate NO2-, since it can lead to process breakdown (VUNA, 2013). In a well-functioning biological nitrification reactor the NO2- concentration is normally very low. However, under special circumstances enrichment of nitrite can be caused by disturbances in the microbiological processes. Inhibition due to toxic substances or to unfavourable conditions for the nitrite oxidizer (NOB) are also reported in conventional wastewater treatment plants (WWTP) (Rieger et al., 2008).
absorbs UV light mostly at wavelengths below 250 nm. This absorption makes it possible to have a photometric determination without reagents by using a sensor positioned in the media (Drolc & Vrtovsek, 2010).
Although the peak absorbance wavelengths in the UV range are well known for nitrite, the urine nitrification system causes a number of interferences. Turbidity is the most important influence on in-situ absorption, typically occurring due to suspended solids causing light scattering and shading, which influences absorption over the entire spectrum (Langergraber, 2003). Sample filtration has been proposed to reduce turbidity (Pons et al., 2004). Interferences stemming from organic matter and other ions which absorb in the same wavelength range should also be taken into account (Rieger et al., 2008). All these interferences could lead to unreliable measurement results (Drolc & Vrtovsek, 2010).
Spectroscopic methods together with chemometrics are being presented as a powerful tool for process monitoring and control of biotechnological processes. They combine a “hard” part, for sensing, and a “soft” part, for data treatment (Pons et al., 2004). Models for on-line estimation address the problem of reconstructing the relationship existing between the process inputs (easy-to-measure variables) and the process outputs (hard-(easy-to-measure variables). Relationships regarding the input and output variables can be modelled by solving a regression problem. The simplest regression techniques assume the existence of a linear input-output relationship. For instance, they fit a linear model to reconstruct it by means of multivariate statistics (Haimi et al., 2013). The term multivariate calibration refers to the process of constructing a mathematical model that relates the absorbances of a set of known reference samples at more than one wavelength to a property of the sample such as a concentration or identity (Drolc & Vrtovsek, 2010).
Multivariate modelling can provide an interpretable description of how the inputs affect the outputs. When large numbers of inputs exist, multivariate statistical methods combine reduction techniques and linear regression to reduce the dimensionality of the modelling problem. This usually makes the model easier to understand and increases the quality of the produced estimates. Commonly used methods include principal component regression (PCR) and partial least square (PLS) regression (Haimi et al., 2013).
Principal components regression (PCR) is used when there is a large number of predictor variables and those predictors are highly correlated or even collinear. PCR constructs new predictor variables, known as components, as linear combinations of the original predictor variables (Maesschalck et al., 1999). This method can be used to make data easier to understand by extracting relevant information and modelling it. PCR is typically used to deal with large amounts of data, such as spectral data. It makes use of data directly collected from the process to build an empirical model, providing graphical tools that are easy to apply and to interpret, making them very useful for real-time control and monitoring (Aguado & Rosen, 2008).
1.2 OBJECTIVES
The main goal of this thesis is to develop a chemometric PCR model for estimation of nitrite concentrations in a nitrification reactor treating stored source-separated urine. Estimation of nitrite concentrations in the urine nitrification reactor is vital for the operation of the same, since it could avoid system failures and, potentially, a total system breakdown. A PCR model for estimation of nitrate concentrations is developed as well.
A number of important factors that could affect the performance of the sensor and the associated PCR model are investigated. These are the effect of particles, which can cause back-scattering, and the effect of saturation, which could make linear models impractical.
Ultimately, the proposed work is expected to contribute to biological urine nitrification process stabilization.
1.3 STRUCTURE OF THE THESIS
The thesis includes the following chapters and contents:
1. Introduction 2. Literature review 3. Materials and methods 4. Results and discussion
5. Conclusions and future developments 6. References
2 LITERATURE REVIEW
The most important concepts discussed in this thesis will be presented in the following paragraphs. In Section 2.1 a brief introduction to urine source separation technology is presented, followed by a description of the main biological processes involved in source-separated urine stabilisation (Section 2.2). Sections 2.3 and 2.4 introduce the UV spectroscopy fundamentals and chemometric principles by means of a review of the pertinent literature.
2.1 URINE SOURCE SEPARATION
Managing wastewater and the resources it contains is tremendously important for an ecologically sustainable development (Ganrot, 2005). Conventional wastewater treatment system functions well, at least in developed countries. However, this system always lags behind with respect to upcoming environmental problems (Corcoran et al., 2010). In addition, adapting the same system, which is extremely wasteful of water and energy, is nearly impossible in poor and arid countries. This impracticality leads to devastating consequences for human health (Lienert & Larsen, 2009). Nutrient losses to the environment can be strongly reduced if nutrients from wastewater are recycled, for instance for agricultural applications (Udert, 2002).
One promising alternative to the current mixing of waste streams is the separate collection and treatment of urine. Separate collection of urine allows to recover valuable nutrients such as nitrogen, phosphorous and potassium. Subsequently, by keeping urine out of the sewage system, wastewater treatment plants would reportedly receive 80 percent less nitrogen and 50 percent less phosphorous. Hence, the recovered nutrients can be used as fertiliser in agriculture (VUNA, 2013). An additional advantage of urine separation could be the elimination of micropollutants, mainly excreted with urine (Udert, 2002).
Urine source separation comes in several variations. The main principle is to always divert urine from faeces in the toilet bowl by a separate outlet. In urine-collecting systems the separated urine is directed to a collection tank with or without flushing water and stored for later transport to a treatment facility (Lienert & Larsen, 2009). Microbial urea hydrolysis occurs in the collection tank. The present work addresses a setting with water-flushed urine diverting NoMix-technology applied at Eawag, Switzerland. According to Lienert & Larsen, (2009), NoMix-technology is a promising innovation aiming at a decentralized approach in urban wastewater. Sweden is a pioneering country regarding the above technology, followed by other Northern and Central European countries and more recently Australia and China, where several urine-diverting toilets have been installed and successfully tested.
During urine storage both ammonia concentration and pH increase due to urea degradation. High pH values cause ammonia volatilisation leading to odour problems and nitrogen losses during handling of stored urine. Therefore, source-separated urine needs to be pre-treated in order to stabilise it. Urine stabilisation can be achieved by means of biological nitrification.
2.2 BIOLOGICAL PROCESSES
2.2.1 UREA HYDROLYSIS: UREOLYSIS
Microbial urea hydrolysis, ureolysis, corresponds to the degradation process of urea, the main component of urine (Udert, 2002). The enzyme urease, hydrolyses urea to ammonia and carbonate (Maurer et al., 2006). Carbonate decomposes spontaneously to carbonic acid and ammonia (Udert & Wächter, 2012). The overall reaction can be written as
CO(NH2)2+ 2 H2O
urease
→ 2NH3+ H2CO3 (2.1)
During urea degradation, ammonia (NH3) is released and the pH increases strongly (Udert et al., 2003). At the same time, anaerobic bacteria produce malodorous compounds, which are responsible for the characteristic strong smell of stored urine (Maurer et al., 2006). In addition, urea degradation is a very fast process. All urea is hydrolysed after little more than one day of retention time. Under these conditions large amounts of phosphate minerals precipitate, which can lead to pipe blockages (Udert, 2002).
Thus, urine stabilisation is essential to prevent both environmental pollution and negative effects on human health. In addition, it retains nitrogen in solution for later recovery (Udert et al., 2006). Biological nitrification is a method for preventing the ammonia volatilisation from stored urine (urine stabilisation) and will be discussed in detail in Section 2.2.2. In addition to the nitrogen stabilisation, the biological treatment of urine has further beneficial effects: 80% of the organic compounds (based on chemical oxygen demand) are degraded and the unpleasant odour is eliminated (Udert, 2002).
2.2.2 BIOLOGICAL NITRIFICATION
Nitrification is the biological oxidation of ammonia to nitrate with nitrite formation as an intermediate (Sedlak, 1991). The nitrification process is primarily accomplished by two groups of autotrophic nitrifying bacteria that can build organic molecules using energy obtained from nitrogen containing inorganic sources, in this case ammonia and nitrite (Bock & Wagner, 2006). In the first step of nitrification, ammonia-oxidising bacteria (AOB) oxidize ammonia to nitrite according to Equation 2.2.
NH3+32 O2→ NO2−+ 3H++ H2O (2.2)
Nitrosomonas is the most frequently identified genus associated with this step, although other genera, including Nitrosococcus and Nitrosospira can be present (EPA, 2002). In the second step of the process, nitrite-oxidising bacteria (NOB) oxidize nitrite to nitrate according to Equation 2.3.
Nitrobacter is the most frequently identified genus associated with this second step, although other genera, including Nitrospina, Nitrococcus and Nitrosospira can also autotrophically oxidize nitrite (EPA, 2002). Both groups of nitrifying bacteria are obligate aerobic organisms commonly found in terrestrial and aquatic environments. Their growth rates are controlled by substrate (ammonia and nitrite) concentrations, temperature, pH, light, oxygen concentrations and microbiological community composition (EPA, 2002).
Owing to stored urine alkalinity, nitrifying bacteria oxidise just half of the NH3 to non-volatile nitrate (NO3- ion). Ammonia-oxidising bacteria (AOB) convert ammonia to nitrite (NO2-), which is the substrate for the second group of bacteria, the nitrite-oxidising bacteria (NOB) that produces nitrate (NO3-). The remaining NH3 is converted to non-volatile ammonium (NH4+ ion), due to the release of protons (VUNA, 2013). Nevertheless, almost all ammonium can be oxidized to nitrate, by adding additional alkalinity. Additional alkalinity leads to an equilibrium shift (Udert & Wächter, 2012).
The activities of AOB and NOB are strongly dependent on the pH as the concentration of their substrates, NH3 (AOB) and HNO2 (NOB) are in a pH dependent equilibrium with their acid (NH4+) or base (NO2-) (Udert, 2002). As nitrite is an intermediate product of the two-step process of nitrification and the second step of nitrification is rather fast, the nitrite concentration in a steady biological nitrification is normally very low. Enrichment of nitrite in the system is a major concern and usually suggests that the microbiological process is disturbed/inhibited. Extreme events could lead to an increased influent to the nitrification reactor, increasing NH3 concentration and consequently pH values. Due to higher availability of NH3 at higher pH values, AOB activity increases immediately. NOB reacts too slowly to the rising nitrite concentration. As a consequence, nitrite keeps increasing and the HNO2 concentration approaches values that could cause complete NOB inhibition and lead to process breakdown (Udert & Wächter, 2012). Thus, it is imperative for the well-functioning of the biological nitrification process to monitor the nitrite concentrations.
2.3 ULTRAVIOLET (UV) SPECTROSCOPY
Among the potential candidates for the development and application of on-line measurements, spectroscopy is very promising, since it can be the basis for non-invasive and non-destructive measuring systems (Pons et al., 2004). The use of submersible equipment which can perform a spectra analysis directly in liquid media for determination of several parameters in the effluent of a conventional WWTP such as nitrite and nitrate, has been successfully applied using the UV spectra range 200-400 nm (Rieger et al., 2004).
Figure 2.1. Electromagnetic spectrum (Thomas & Theraulaz, 2007)
UV spectroscopy is the study of how a sample responds to ultraviolet light. When a beam of light passes through a substance or a solution, some of the light may be absorbed and the remainder transmitted through the sample. The most important principle in absorption analysis is the Lambert–Beer’s law (Upstone, 2000). This law states that, for a given ideal solution, there is a linear relation between absorption and concentration of a single determinant (Langergraber et al., 2003). Thus UV spectroscopic techniques used for quantifying purposes are based on the mentioned law. According to Lambert-Beer’s law, for a single wavelength and a single component, absorbance is a linear function of the concentration of the component and the following relation (Equation 2.4) is valid:
A = ε. b. c (2.4)
where A is the absorbance, ε is the molar absorptivity (mol-1.cm-1), which is constant for each chemical compound and for each wavelength, b is the path length of the cell in which the sample is contained (cm) and c is the concentration of the absorber (mol.dm-3).
Provided that ε and b are kept constant for a given set of experiments, a plot of the sample absorbance against the concentration of the absorbing substance should give a linear calibration curve going through the origin. In addition, Lambert–Beer’s law allows to change the path length to affect the absorbance. The path length can be increased or reduced when lower or higher limits are required, respectively. Alternatively, it is possible to reduce the absorbance by diluting the sample (Upstone, 2000).
to deal with superposition of numerous single substance absorbances, sometimes even with overlapping peaks, due to numerous dissolved and suspended compounds, which can lead to poor performance of the UV sensor. In urine, saturation and turbidity due to high nitrate concentrations and suspended particles, respectively, are additional factors influencing the measurement. The latter effects could be minimized by dilution and filtration, respectively. Previous studies of a saturation effect in a urine nitrification reactor have not been reported. An alternative method to reduce saturation is to decrease the path length of the sensor. However, for the studied case the applied path length (0.5 mm) cannot be minimized further.
2.4 CHEMOMETRICS
The term chemometrics was introduced in 1972 by Svante Wold and Bruce Kowalski and has its foundation as a discipline in chemistry. In chemometrics the main issue is to structure the chemical problem to a form that can be expressed as a mathematical relation, by means of a statistical–mathematical method (Otto, 2007). According to Svante Wold, a reasonable definition
of chemometrics is ‘How to get chemically relevant information out of measured chemical data,
how to represent and display this information, and how to get such information into data’ and the only reasonable way to extract and represent this chemical information is in terms of models (Wold, 1995).
Spectroscopic techniques can deliver a large amount of data when several spectra, with several wavelengths, are recorded in order to have as much information as possible related to a process. Considering bioprocess applications, the background complexity can complicate the direct identification of individual compounds. Therefore, data-reduction techniques such as chemometric tools are essential to rapidly extract the relevant information, presenting the data in a more clear way. Indirect chemometric models are used in wastewater for correlating the concentrations of the required parameters to spectral information.
Multivariate statistical methods of data analysis are applied to find patterns in data and to distinguish those patterns in the samples. Recognition of patterns is feasible with projection methods, such as principal component analysis (PCA) and principal component regression (PCR) (Otto, 2007). These tools are usually used to deal with large amounts of data, such as spectral data. Both methods can be used to make data more understandable by extracting relevant information. These methods make use of data directly collected from the process to build an empirical model which serves as reference of the desired process behaviour and against which new data can be compared. Additionally, they provide graphical tools that are easy to apply and to interpret (Aguado & Rosen, 2008).
Both the PCA and PCR models are linear. The unknown variables are linear functions of the known ones (Hyötyniemi, 2001). Linear models are simple and often provide an adequate and interpretable description of how the inputs affect the outputs. For prediction purposes they can sometimes outperform fancier non-linear models, especially in situations with a small number of training cases (Hastie et al., 2001).
& Rosen, 2008). The main purpose of principal component analysis (PCA) is to reduce the dimensionality of a data set consisting of a large number of interrelated variables to a considerably smaller number, while retaining as much as possible of the variation present in the data set (maximum variance). This reduction is achieved by transforming to a new set of variables, the principal components (PCs), which are uncorrelated and ordered so that the first few retain most of the variation present in all of the original variables (Jolliffe, 2002). PCA is a popular technique to find patterns in data of high dimension and expressing the data in such a way as to highlight their similarities and differences (Smith, 2002). PCA models can be computed efficiently by singular value decomposition (SVD).
3 MATERIALS AND METHODS
3.1 RESEARCH STRATEGY
In order to achieve the central objective of this thesis (defined in Section 1.2), the research strategy developed was divided in 2 main steps.
An evaluation of both particles and saturation effects in the UV absorbance spectra was performed. The evaluation of particles effect aims to clarify how strong the effect of particles is and whether a reasonable estimation of nitrite and nitrate concentrations remains feasible in the presence of particles. The target of the saturation effect experiment is to evaluate how the presence of saturation influences the estimation of nitrite and nitrate concentrations.
Prior to the evaluation of the effects of particles and saturation in the UV absorbance spectra, there is a need to find an ideal dilution – a particular dilution to ensure that no saturation is present. This ensures that the best conditions are met for the identification of a linear model. Thus, an experiment to characterize the saturation effect empirically was carried out. On the basis of this experiment, a dilution was selected which guarantees the absence of saturation.
Thus, the research strategy can be described in 2 main experiments:
I. Primary evaluation of saturation effect in the UV absorbance spectra on the collected spectra data through dilution experiments.
UV spectral measurements of diluted treated urine samples (10 different dilutions) were performed. The collected data were evaluated with linear models in order to determine a reference dilution for the following experiments. The main goal of this step was to find a dilution which guarantees that the saturation effect disappears.
II. Investigate the effect of particles and the effect of saturation in the UV absorbance spectra.
UV spectral measurements of treated urine samples, with 3 different types of filtration (0.7µm filter, coffee filter and unfiltered), diluted and non-diluted, with and without nitrite stock-solution addition, were performed. The applied dilution was based on the results of the previous experiment.
3.2 MATERIALS
3.2.1 URINE SAMPLES
The urine samples for the experiments are collected from the nitrification reactor in the Eawag main building (Forum Chriesbach). The stored source-separated urine, collected within the building, is pre-treated in the nitrification reactor in order to stabilise the urine. The reactor is a moving bed biofilm reactor (MBBR) with a volume of 120 L and Kaldnes® K1 biofilm carriers to support the growth of nitrifying bacteria. The Kaldnes® biofilm carriers are polyethylene tubes with a diameter of 9 mm and a length of 7 mm. Air is supplied by a bubble aeration system (Etter et al., 2013; Alexandra Fumasoli, personal communication, July 21, 2014).
3.2.2 UV SPECTROMETER
The spectro::lyserTM UV, a spectrometer probe manufactured by s::can, is a submersible spectrometer of 44 mm diameter and about 0.6 m length, capable of online measurements of UV absorption spectra directly in liquid media (in-situ), without sampling or sample treatment and without reagents. The sensor provides measurements of spectra in the wavelength region between 220 nm and 390 nm (171-dimensional spectra) and displays and/or communicates the result in real time. The measuring path is 0.5 mm which is unusual for UV spectrophotometry in wastewater processes. Figure 3.1 shows a picture of the applied sensor. A single measurement takes about 45 seconds (s::can, 2007; Langergraber et al., 2003).
The probe consists of three main components: the emitter, measuring cell and receiving unit, with a xenon flash lamp as a light source. The measuring section includes (1) optical measuring path, (2) cleaning nozzles and (3) fixtures for the measuring path (Figure 3.1). In the measuring path (1) the light passes through the space between the two measuring windows which is filled with the medium. A second light beam within the probe – compensation beam – is guided across an internal comparison section and performs as a reference.
3.2.3 REFERENCE TESTS: Hach-Lange Cuvette Tests
Hach-Lange cuvette tests are colorimetric tests that allow identification of the concentrations of the compounds of a sample, by means of barcoded cuvettes. A Hach DR2800 spectrophotometer is used to automatically identify the cuvette test from its barcode, rotating the cuvette and taking 10 measurements, eliminating outliers, and showing the measurement result in mg/l (HACH, 2012).
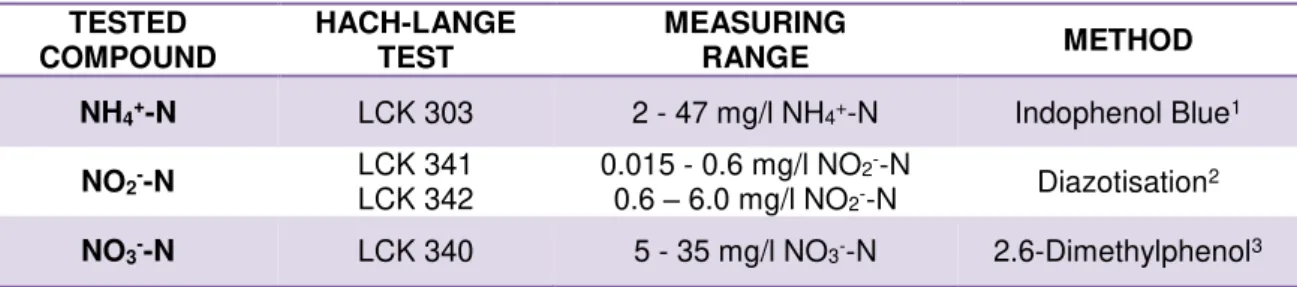
The Hach-Lange tests used are LCK 303, LCK 341/342 and LCK 340 for ammonia, nitrite and nitrate concentrations, respectively (Table 3.1).
Table 3.1. Reference tests used for determination of ammonium, nitrite and nitrate concentrations in the collected samples
TESTED COMPOUND
HACH-LANGE TEST
MEASURING
RANGE METHOD
NH4+-N LCK 303 2 - 47 mg/l NH4+-N Indophenol Blue1
NO2--N LCK 341
LCK 342
0.015 - 0.6 mg/l NO2--N
0.6 – 6.0 mg/l NO2--N Diazotisation2 NO3--N LCK 340 5 - 35 mg/l NO3--N 2.6-Dimethylphenol3
3.2.4 FILTERS
Glass Fiber Filters:
Glass fiber filters are widely applicable in many fields of laboratory use due to the exceptionally good resistance to most organic and inorganic solvents. They allow a fast filtration with simultaneous high particle retention and good loading capacity (Macherey-Nagel, 2014). The general characteristics of the used micro filters are presented in Table 3.2.
Table 3.2. Glass microfiber filters used in experiments
GLASS FIBER FILTER PAPER GRADES
AVERAGE RETENTION
CAPACITY
(μm)
WEIGHT (g.m-2)
DIAMETER (mm)
THICKNESS (mm)
FILTRATION SPEED
(s)
MN GF-1 0.7 55 90 0.3 12
MN GF-4 1.4 120 90 0.6 5
MN GF-5 0.4 85 47 0.4 80
1 Ammonium ions react at pH 12.6 with hypochlorite ions and salicylate ions in the presence of sodium nitroprusside as a catalyst to form indophenol blue
2 Ammonium ions react at pH 12.6 with hypochlorite ions and salicylate ions in the presence of sodium nitroprusside as a catalyst to form indophenol blue
Coffee Filters:
Melitta® Original Coffee Filters #4 and #6 made from natural brown paper with multi-layer filtration separated into 3 zones (Figure 3.2), each with a different number of perforations (Melitta®, 2014) are used to remove amajorityofthesuspendedparticles from the samples.
Figure 3.2. Melitta® Coffee filter
3.2.5 REAGENTS
Ethanol is of HPLC gradient grade, with a purity of ≥ 99.8%, according to the supplier (Sigma-Aldrich Chemie GmbH, Buchs, Switzerland). Sodium hydroxide (Sigma-(Sigma-Aldrich Chemie GmbH, Buchs, Switzerland) and Hydrochloric acid (Sigma-Aldrich Chemie GmbH, Buchs, Switzerland) are reagent grade of 50% and 37%, respectively. Sodium nitrite (Merck Millipore, Darmstadt, Germany) is of extra pure Ph Eur, USP. Detailed product information can be found under CAS number 7632-00-0. The laboratory water used in the study is provided by the Thermo Scientific™
3.3 EXPERIMENTAL PROCEDURE
In order to accomplish the central objective of this thesis (defined in Section 1.2), the research strategy (defined in Section 3.1) is divided in 2 main experiments and explained in detail in Sections 3.3.1 and 3.3.2.
3.3.1 PRIMARY SATURATION EFFECT EXPERIMENT
The goal of the first experiment is to determine a reference dilution for the following experiments and it is schematically represented in Figure 3.3. The experiment was carried out in the Eawag laboratory.
Figure 3.3. Schematic diagram of Saturation Effect Experiment
3.3.1.1 Sample Collection and Pre-treatment (Decantation)
By following this procedure, effects of improper mixing during spectral measurements can be minimized.
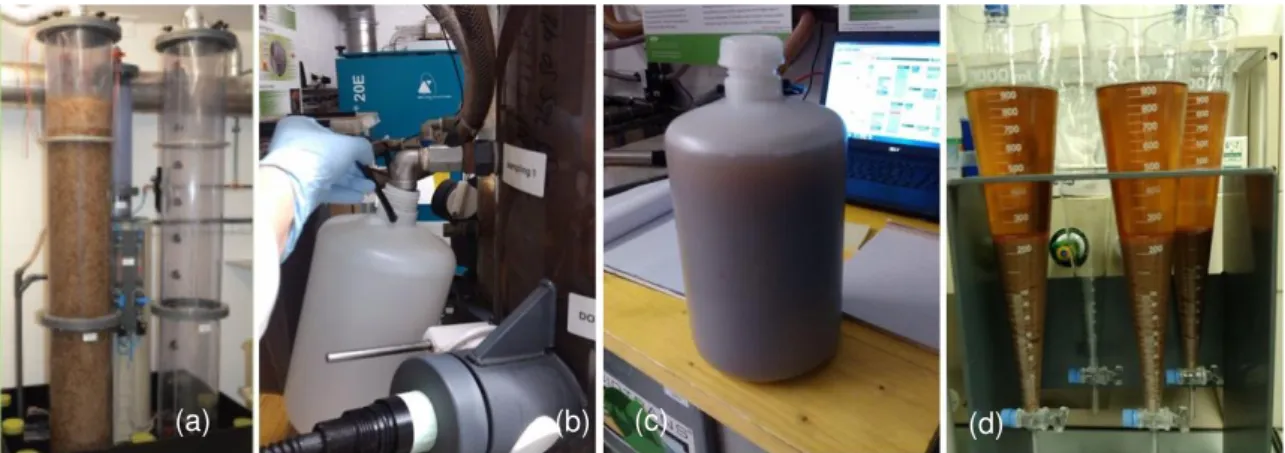
Figure 3.4. Sample Collection and Decantation steps: (a) Nitrification reactor; (b) Urine sampling (c) Urine plastic container; (d) Imhoff cones
3.3.1.2 Sample Dilutions
After the decantation step, several diluted samples are prepared from the supernatant. The dilutions used in each experiment are represented in Table 3.3.
Table 3.3. Sample dilutions applied for UV-spectra measurements
SAMPLE SAMPLE
DATE (dd.mm.yy)
SAMPLE DILUTION
VURINE
(ml)
VH2O
(ml)
VTOTAL
(ml)
URINE FRACTION
(%)
01 03.04.14 1:100 5 495 500 1
02 02.04.14 1:50 10 490 500 2
03 03.04.14 1:20 25 475 500 5
04a 02.04.14 1:10 50 450 500 10
04b 03.04.14 1:10 50 450 500 10
05 03.04.14 1:5 100 400 500 20
06 04.04.14 2:5 200 300 500 40
07 02.04.14 1:2 250 250 500 50
08 04.04.14 3:5 300 200 500 60
09 04.04.14 4:5 400 100 500 80
10 02.04.14 0 500 0 500 100
01.1 09.04.14 1:100 5 495 500 1
02.1 09.04.14 1:50 10 490 500 2
03.1 09.04.14 1:25 20 480 500 4
04.1 09.04.14 1:20 25 475 500 5
05.1 09.04.14 1:10 50 450 500 10
06.1 09.04.14 1:5 100 400 500 20
07.1 09.04.14 2.5 200 300 500 40
08.1 09.04.14 3:5 300 200 500 60
09.1 09.04.14 4:5 400 100 500 80
10.1 09.04.14 0 500 0 500 100
3.3.1.3 UV-Spectra Collection
Experiments are carried out in a 1000 ml graduated glass cylinder placed on a magnetic agitator at 1000 rpm. 500 ml of sample and a stirring magnet were added to the graduated cylinder. The UV probe was immersed in the media until the volume of the graduated cylinder read 900 ml. The stirrer was started at 1000 rpm. Absorbance spectra were collected using the s::can UV sensor during 5 minutes, with a measurement interval of one (1) minute. The above procedure is repeated for each sample and each dilution. Between sets of measurements (5 spectra) the UV probe was cleaned with 20% NaOH solution, 15% HCl solution, EtOH and nanopure water, in this order, to avoid deposition of biomass particles and salts in the measuring path.
3.3.1.4 Chemical Analysis: Ammonium, nitrite and nitrate determination
Hach-Lange tests of the collected samples are used for reference in this study. A 15 ml of the collected supernatant sample was filtered through a glass microfiber filter MN GF-5 (Macherey-Nagel AG, Switzerland) to remove suspended particles (Figure 3.5 (a)). Thereafter, an additional dilution (50x) of the sample is performed in order to work in the range of the Hach-Lange test. Stable operation of the reactor allowed the use of the same dilution during all experiments. Ammonium, nitrite and nitrate concentrations were measured by means of Hach-Lange tests LCK 303, LCK 342 and LCK 340, respectively (Figure 3.5 (b) and (c), Table 3.4).
Figure 3.5. Ammonium, nitrite and nitrate determination by means of Hach-Lange reference tests (a) Sample microfiltration; (b) Hach-Lange reference tests; (c) Hach DR2800 spectrophotometer
Table 3.4. Reference tests used for determination of ammonium, nitrite and nitrate concentrations in the collected samples of the saturation effect experiments
TESTED COMPOUND
HACH-LANGE TEST
SAMPLE DILUTION
MEASURED CONCENTRATION
NH4+-N LCK 303 1:50 mg/l NH4+-N
NO2--N LCK 342 1:1 mg/l NO2--N
NO3--N LCK 340 1:50 mg/l NO3- -N
3.3.2 PARTICLES AND SATURATION EFFECT EXPERIMENT
The second experiment aims to evaluate the effect of particles and the effect of saturation in the UV-spectra. The experiment was carried out in the Eawag laboratory and is schematically represented in Figure 3.6. Samples for this experiment were collected 3 times a week, during 16 weeks.
Figure 3.6. Schematic diagram of Particles Effect Experiment
3.3.2.1 Sample Collection and Pre-treatment (Decantation)
The detailed explanation of this step is described above in Section 3.3.1.1.
3.3.2.2 Sample Filtration
After the decantation step, the remaining liquid is split in 3 fractions (A, B and C, V=800 ml each). FractionAisused asis without filtration. Fractions B and C are subjected to a filtration step.
filtration through a glass fiber filter MN GF-1 (pore size 0.7µm) to remove suspended particles and collected in an 800 ml beaker. The apparatus used for filtrations is presented in Figure 3.7.
Figure 3.7. Sample Filtration: (a) Coffee filtration and (b) Microfiltration
3.3.2.3 Sample Preparation/Dilution
Fractions A, B and C are each collected undiluted by means of a 500 ml volumetric flask. The remaining liquid of each fraction is used to prepare diluted fractions (A’, B’, C’). The dilutions performed are based on the results of the previous experiment. Fraction A’, B’, C’ are collected by means of a 500 ml volumetric flask as well (Figure 3.8).
3.3.2.4 Preparation of Nitrite Stock-Solutions
Three different nitrite (NO2-) stock solutions, V=500 ml, are prepared by dissolving sodium nitrite (NaNO2) in water. The target concentrations in the sample fractions analysed were 50 mg NO2- -N/l, 100 mg NO2--N/l and 150 mg NO2--N/l.
3.3.2.5 UV-Spectra Collection and Analysis
Experiments are carried out in 1000 ml graduated glass cylinder placed on a magnetic agitator at 1000 rpm. Sample fractions (A, A’, B, B’, C, C’, Table 3.5) are added to the graduated cylinder together with a stirring magnet. The UV probe is submerged in the media until the volume of the graduated cylinder reads 900 ml. The stirrer is started. Measurements are performed during 5 minutes, in steps of one (1) minute. Between sets of measurements, the UV probe is cleaned with 20% NaOH solution, 15% HCl solution, EtOH and nanopure water. All samples are also spiked with 5 ml of NO2- stock solution to ensure measurements of a wide range of NO2- concentrations. The concentrations of the added NO2- stock solution are 50 mg NO2--N/l, 100 mg NO2--N/l and 150 mg NO2--N/l, for each of the 3 days of the week, respectively. To save time, no cleaning is executed before NO2- stock solution is added. The apparatus used is presented in Figure 3.9.
Table 3.5. Sample fractions used for UV-spectra measurements
SAMPLE FRACTION
TYPE OF FILTRATION
SAMPLE DILUTION
(times)
VURINE
(ml)
VH2O
(ml)
V NO2- STOCK
SOLUTION
(ml)
VTOTAL
(ml)
A 01 0.7 µm Filter 0 500 0 0 500
02 0.7 µm Filter 0 500 0 5 505
A’ 03 0.7 µm Filter 10 50 450 0 500
04 0.7 µm Filter 10 50 450 5 505
B 05 Coffee filter 0 500 0 0 500
06 Coffee filter 0 500 0 5 505
B’ 07 Coffee filter 10 50 450 0 500
08 Coffee filter 10 50 450 5 505
C 09 Non-filtered 0 500 0 0 500
10 Non-filtered 0 500 0 5 505
C’ 11 12 Non-filtered Non-filtered 10 10 50 50 450 450 0 5 500 505
3.3.2.6 Chemical Analysis: Ammonium, nitrite and nitrate determination
3.4 MODELLING
In the current Section the methods used for data analysis will be introduced. In Section 3.4.1 the required steps to apply a linear regression on the acquired data of the first experiment are explained in detail. Section 3.4.2 presents the methods used to build a PCR model for estimation of nitrite concentrations, based on the acquired data of the second experiment.
3.4.1 PRIMARY SATURATION EFFECT EXPERIMENT
The obtained UV-spectra are analysed using Matlab®, by means of a linear regression (Matlab code is presented in Appendix I).
Consider a vector of inputs x and the desired estimation of an output y, where x correspond to the urine fractions and y to the UV absorbances. The linear regression model has the form:
f(x) = β0 + ∑ 𝑥𝑗βj p
j=1
,
where β0 and βj’s are unknown parameters to be estimated - intercept and slope.
The most popular estimation method is least squares, in which we pick the coefficients β = (β0,
β1, …, βp)T to minimize the sum of squares of residuals (SSR).
SSR(β) = ∑(yi− f(xi))2= ∑ (𝑦𝑖− β0 − ∑ xij βj p
j=1
)
2
.
N
i=1 N
i=1
The solution is easiest to characterize in matrix notation, given by:
𝑆𝑆𝑅(𝛽) = (𝑦 − 𝑋𝛽)𝑇(𝑦 − 𝑋𝛽), 𝑋 = [1 𝑋]
where X is a N x p matrix with each row an input and y an N-vector of the outputs of the calibration set. A column of ones is added to the X matrix for determination of β0 . Differentiating the above equation with respect to β, gives
𝜕𝑆𝑆𝑅
𝜕𝛽 = −2𝑋𝑇 (𝑦 − 𝑋𝛽). Setting the first derivative to zero
𝑋𝑇(𝑦 − 𝑋𝛽) = 0
the estimated values for the intercept and the slope are obtained as follows:
𝛽 ̂ = (𝑋𝑇𝑋)−1𝑋𝑇𝑦.
(3.1)
(3.2)
(3.3)
(3.4)
The fitted values for the training inputs (predicted UV absorbances) are given by:
𝑦 ̂ = 𝑋𝛽 ̂ = 𝑋 (𝑋𝑇𝑋)−1𝑋𝑇𝑦.
After fitting the data with a linear model, there is a need to evaluate the accuracy of the model. In the present work residuals allow to measure the total deviation of the predicted absorbances from the measured absorbances. The prediction error is computed as:
𝑒𝑖= 𝑦𝑖− 𝑦̂𝑖 ,
where, 𝑦𝑖 is the measured absorbance, 𝑦̂𝑖 is the predicted absorbance, 𝑒𝑖 is the residual error.
3.4.2 PARTICLES AND SATURATION EFFECT EXPERIMENT
The collected data are evaluated firstly with principal component analysis (PCA) followed by multivariate regression (PCR) in order to build an estimation model for nitrite concentrations. A leave-one-out cross validation (LOOCV) is performed as well, to choose the best number of principal components (PCs) for the PCR model (Matlab code is presented in Appendix II).
3.4.2.1 Data Pre-Processing
Consider that the collected data are represented as an m x n matrix, X, where the n columns are the samples (observations) and the m rows are the variables (wavelengths).
𝑋 = [
𝑥
⋯
1.1⋯ 𝑥
⋯
⋯
1.𝑛𝑥
𝑚.1⋯ 𝑥
𝑚.𝑛]
Prior to data analysis, the absorbance measurements are centred. Mean centring is commonly applied for any multivariate calibration model. This involves calculating the average for each column in the training data set and then subtracting the result from each element of that column. This operation ensures that results are interpretable in terms of variation around the mean (Maesschalck et al., 1999). The mean-centring operation is given by:
Xi,cent = Xi− X̅,
where, 𝑋𝑖,𝑐𝑒𝑛𝑡 is the centred value of 𝑋𝑖 and 𝑋̅ the mean value of 𝑋.
(3.6)
(3.7)
(3.8)
After mean centring, the matrix is scaled as follows:
Y = Xi,cent √(n − 1)
3.4.2.2 PCA Calibration: Singular Value Decomposition (SVD)
The n-dimensional spectra are reduced to a lower number of principal components (PCs), by means of SVD. Y can be rewritten as follows:
𝑌 = 𝑈 ∗ 𝑆 ∗ 𝑉𝑇
where U and V are (m x r) and (n x r) orthogonal matrices, S is a (r x r) diagonal matrix which contains the variance described by each singular value and r is the rank of Y (Jolliffe, 2002). The diagonal entries d1 ≥ d2 ≥ … ≥ dm ≥ 0, are called the singular values of Y (Hastie et al., 2001). The eigenvalues of the covariance matrix of Y are equal to the singular values of the matrix Y and are found on the diagonal of S.
3.4.2.3 PCA Application
The main purpose of PCA is to reduce the dimensionality of a data set consisting of a large number of interrelated variables to a much smaller number, while retaining as much as possible of the variation present in the data set (maximum variance). The PCs are uncorrelated and ordered so that the first few retain most of the variation present in all of the original variables. In doing so, the measured variables (absorbances at different wavelengths) are converted into new variables called scores.
The score matrix T (n x r) containing the PCs can be calculated as
𝑇 = 𝑈 ∗ 𝑆 = 𝑌 ∗ 𝑉
3.4.2.4 PCR Calibration and Application
In the present work PCA is used as a precursor for a predictive model (PCR). The PCs with the higher variance are the ones chosen to perform the linear regression. A PCR is then made to estimate nitrite concentrations by means of the selected PCs in the PCA model. The estimated values for the intercept and the slope are obtained as follows:
𝛽 ̂ = (𝑇𝑇𝑇)−1𝑇𝑇𝑦.
The fitted values of the training inputs (predicted UV absorbances) are given by:
(3.10)
(3.11)
(3.12)
𝑦 ̂ = 𝑇𝛽 ̂ = 𝑇 (𝑇𝑇𝑇)−1𝑇𝑇𝑦.
3.4.2.5 Cross-validation
Finally, the optimal value for the number of PCs is defined by means of cross validation (CV). In this study, leave-one-out cross validation (LOOCV) is chosen. Model performance evaluation is based on the sum of squared residuals (SSR). A set of data is removed as a validation set (1 sample corresponding to 5 measurements) from the calibration set once and a model is fitted with the remaining data. Then the model is used to estimate the target variables in the validation data set and the sum of the squared residuals over all removed data samples is calculated. The number of significant principal components is obtained from the SSR minimum. SSR can be rewritten as follows:
𝑆𝑆𝑅 = ∑ ∑ (𝑦𝑖𝑗− 𝑦̂𝑖𝑗(𝑟)) 2 𝑛
𝑗=1 𝑚
𝑖=1
,
where 𝑦̂𝑖𝑗(𝑟) are the predicted elements of the validation data with r PCs used to reconstruct the data matrix, and 𝑦𝑖𝑗 are the original calibration data values.
(3.14)
4 RESULTS AND DISCUSSION
4.1 AMMONIUM, NITRITE AND NITRATE DETERMINATION
The measured concentrations for each type of samples and compounds are represented in Figure 4.1. The data set consists of reference measurements of treated urine samples from 02/04/2014 to 11/08/2014. The first four (4) samples correspond to samples of the primary evaluation on saturation effect in the UV spectra experiment (from 02/04/2014 to 09/04/2014) and the remaining values from 5 to 49 correspond to samples of the evaluation on particles and saturation effects experiment (from 14/04/2014 to 11/08/2014).
Figure 4.1. Measured ammonium, nitrite and nitrate concentrations in the collected samples, by means of reference tests
the restarting period some disturbances in the nitrification reactor were reported. Sample 6 (16/04) was collected from the nitrification reactor effluent tank during the reactor deactivation period. Samples 36, 38 and 39 (10/07, 14/07 and 16/07) also exhibit an increase of the NO2--N concentration, which could be attributed to kinetic variability in the nitrification reactor that probably led to NOB partial inhibition and subsequent nitrite accumulation.
4.2 PRIMARY EVALUATION ON SATURATION EFFECT
The analysed data set consists of UV spectral measurements of treated urine samples, acquired between 02/04/2014 to 09/04/2014 (4 days). 21 samples with different dilutions are analysed (Table 3.3). The spectral measurements are grouped in groups of 5, each corresponding to a certain sample dilution and nitrite (NO2-) and nitrate (NO3-) concentration. This results in a total of 105 absorbance spectra. As discussed above, UV absorbance measurements are recorded in the range between 220 and 390 nm (171-dimensional spectra). The evaluation of the acquired data is accessed by means of a linear regression, in order to find out which dilution is necessary to ensure that no saturation is present. The methods used for data analysis are explained in detail in Chapter 3, Section 3.4.1.
UV spectra, based on the collected data results from the UV sensor, are displayed in the following figure. In Figure 2.1, it is possible to see that the nitrite and nitrate compounds result in peaks in the UV spectra in a range between 220 nm and 240 nm. Saturation of absorbance measurements take place in the same range. For this reason the chosen wavelengths to pursuit the analysis are from 220 nm up to 240 nm, in steps of 5 nm.
Figure 4.2. UV spectra for all the measured samples and for all applied dilutions
Prior to data analysis, the original data is split in two sets – data set 1 from 02/04 to 04/04, including sample dilutions 01 to 10, and data set 2 from 09/04, including sample dilutions 01.1 to
220 240 260 280 300 320 340 360 380 400
0 1000 2000 3000 4000 5000 6000