The impact on produc on and costs a er the
acquisi on of an airline by a compe tor in Brazil: a
Cobb-Douglas func on applica on
José Alexandre Tavares Guerreiro Fregnani1, Tarik Hadura Orra2, Rogéria de Arantes Gomes Eller3,Bento Silva de Ma%os4
1Technological Ins tute of Aeronau cs – ITA, [email protected] 2Technological Ins tute of Aeronau cs – ITA, [email protected] 3Technological Ins tute of Aeronau cs – ITA, [email protected] 4Technological Ins tute of Aeronau cs – ITA, bma/[email protected]
Recebido:
13 de novembro de 2017
Aceito para publicação:
15 de abril de 2018 Publicado: 30 de abril de 2019 Editor de área: Li Weigang ABSTRACT
Objec ve of this paper is to analyze the impact on produc on and air transport costs as result of the acquisi on of an airline in growth by its dominant compe tor with similar opera onal pa/ern. Two Cobb-Douglas func ons, related to produc on and costs re-spec vely, were used for such analysis, considering the periods before and a er the ac-quisi on. We take as example for analysis the acac-quisi on of Webjet Linhas Aéreas SA by VRG Linhas Aéreas (GOL Linhas Aéreas Inteligentes) officially consolidated in October 2012. The results demonstrate that the acquisi on of the market growing company with similar opera onal pa/ern provided nega ve impact on the company's produc vity, showing loss of opera onal efficiency and increased costs, not absorbing in full
produc-on poten al that the acquisi produc-on of the company could bring. Such methodology demonstrated to be effec ve in the impact analysis of such kind of opera ons since per-mits conclusions based on econometric results to be used by decision makers.
RESUMO
O obje vo deste ar go é analisar o impacto sobre os custos de produção e transporte aéreo como resultado da aquisição de uma empresa aérea em crescimento por sua com-pe dora dominante de ocom-peração similar. Duas funções Cobb-Douglas, relacionados à produção e custos respec vamente, foram u lizados para tal análise, considerando os períodos anteriores e posteriores à aquisição. Toma-se como exemplo para análise a aquisição da Webjet Linhas Aéreas SA pela GOL Linhas Aéreas Inteligentes, consolidada oficialmente em outubro de 2012. Os resultados demonstram que a aquisição da em-presa em crescimento proporcionou impacto nega vo na produ vidade da emem-presa do-minante, apresentando perda de eficiência operacional, aumento de custos e não ab-sorvendo pleno potencial de produção que a aquisição da primeira pudesse trazer. Tal metodologia demonstrou ser eficaz na análise de impacto desse po de operação, uma vez que permite que conclusões baseadas em resultados econométricos sejam u liza-das pelos tomadores de decisão.
Keywords:
Air transport management, Produc vity,
Airline opera onal costs, Cobb-Douglas func on, Air transport in Brazil.
Palavras-chaves:
Gestão de transporte aéreo, Produ vidade,
Custos operacionais de empresas aéreas,
Função Cobb-Douglas, Transporte aéreo no Brasil. DOI:10.14295/transportes.v27i1.1512
1. INTRODUCTION
Production in the air transport industry is measured by the amount of revenue generated dur-ing a certain period of operations divided by the total number of passengers transported times the total distance traveled (RPK, revenue passenger-kilometer). The correct determination of this metric is paramount for airlines, since it is used as key performance indicator applied dur-ing the capacity planndur-ing process, also involvdur-ing leet and network management. Therefore, the
adequate selection of inputs is a key factor for success. Fuel consumption, leet size and availa- ble seat kilometers are usually the major inputs considered in this process (Bettini and Oliveira, 2011).
Nowadays, sophisticated data analysis applications have been developed to accurately esti-mate the best model for the air transport production function for airlines with a selected set of inputs. However, since the early days of airlines (when computational power was a limiting fac-tor for quick decisions) simple analytical models have also been explored and have demon-strated relatively good accuracy in this kind of process. A common approach, frequently adopted by airlines worldwide, is to model the RPK through a Cobb-Douglas function, due to its mathematical simplicity and facility to derive accurate results with relatively few inputs under consideration.
The Cobb-Douglas Function
In fact, the Cobb-Douglas function has been widely used in microeconomics since the early days to represent the relationship between a selected output and various inputs, revealing itself to be a suitable mathematical approach to model production functions. It was irst proposed by Knut Wicksell (an English mathematician and statistician) and was veri ied to meet the statis-tical evidence of the shipbuilding industry by Paul Douglas and Charles Cobb. After the con-struction of the Titanic and Lusitania liners, a textbook on mathematical development of duction in general was published in 1928 (Cobb, 1928). One way to estimate the analytical pro-duction function is to elaborate it in accordance with an exponential model that allows the anal-ysis of the marginal productivity theory in a simple and ef icient way. The general formulation of the Cobb-Douglas function is then shown in Equation 1
= . ∏ (1) where Y is the output, xi (i = 1 ... n) the considered inputs, αi are the Y elasticities in relation to input xi and A is a proportionality constant. Using this mathematical model is advantageous as
the elasticities αi may be easily determined via linear multivariate regression, given a set of
ob-served inputs Xi and outputs Yi, without any complex derivate calculations.
The logarithm of the Cobb-Douglas function may also be adopted without affecting the con-clusions in an adverse manner, where the αi coef icients (or elasticities) can be readily deter-mined by linear regression as well as by ordinary least squares from a set of selected historical data inputs.
The logarithmic form is therefore expressed by:
( ) = ( ) + ∑ ( ) (2) It is also important to notice that when adding production functions of two companies using similar technologies, it may be mathematically proved that the equation is
i n i i X i X A Y
Y1+ 2= .
∏
( 1 + 2)α true if the ratio of the inputs of the two companies X1i / X2i is constantfor all i = 1..n and ∑ = 1. This means that the function may not work in aggregated cases or
on macro levels (Hong Bao, 2008).
Finally, it is also possible to transcend the use of the Cobb-Douglas function for the produc-tion costs. The tradiproduc-tional way to solve the problem of modeling the cost is considering the input price vector (wi) variables, and even the amount of inputs used (Y) as dependent variables. The equation cost of Cobb-Douglas for costs is then represented by the following function:
An important property of the aforementioned function is that if all inputs are multiplied by the factor μ, the Y function will be multiplied by μr where r = ∑ represents the returns to scale (or factor of homogeneity). When r = 1, returns to scale are constant, i.e., the Y function is multiplied in proportion to the input. When r <1, there are diminishing returns to scale and when r> 1, they are called increasing returns. According to Doganis (2001), returns to scale in air transport are generally decreasing due to the complexity of managing the availability of in-puts. It is vital to observe that the production returns always refer to constant input prices, the quantities of inputs being the only variables.
State-of-the-art
In the last decades, several authors have been exploring the use of the Cobb-Douglas function in Air Transport. Caves et al. (1984) propose an analytical formula for determining the density of returns using the Cobb-Douglas function which is de ined as the percentage increase of out-put due to the addition of 1% of all inout-puts, keeping both the route network as well as the de-mand and prices constant. This study de ines the density factor (RD) as the inverse of the elas-ticity of the total cost for the production. If RD> 1 there will be increasing density returns (or economies of density); if RD = 1 there will be constant density returns and if RD <1 there will be diminishing returns density (or diseconomies of density). Based on this research, Barros Jr (2011) produced a study showing that a "well-behaved" cost function must impose homogene-ity on the level of prices of inputs and therefore ∑ = 1.
Silveira (2003) studied in detail the Cobb-Douglas into an air transport application. For the irst time, in this important research the main cost factors impacting the operations of a Brazil-ian airline were identi ied in domestic and international lights.
Fregnani et al. (2009) used the Cobb-Douglas function to estimate fuel-related costs in regional Brazilian airlines in regions that differ with respect to the proximity of the fuel distribution cen-ters, with different sensitivity changes in the prices of this input. It was found that the logistics issue in the acquisition of this input is critical in the analyzed companies cost structure.
Martins et al. (2012) studied the effectiveness of the Cobb-Douglas function as a tool to de-termine productivity prediction of road transportation in Brazil, pointing out some similarities with air transport.
For the irst time, Kuroda et al. (2012) proposed the evaluation of the impact on air transport of production as a result of the acquisition of VARIG GOL in 2003 (Kuroda et al., 2012), using historical data series from the irst quarter of 2003 to the last quarter of 2007. The regression results showed that in the short term, there was a fall in productivity following the acquisition by the observed reduction in the share of labor in the results measured in terms of passenger kilometers. The inputs used in the analysis were: daily utilization rate of the aircraft, the average number of aircraft and number of employees.
More recently Yang and Zhu (2015) proposed to build a Cobb-Douglas function to measure the technical ef iciency of airlines, considering an RPK analysis using labor expenses, fuel con-sumption and aircraft capital expenditure as inputs.
Objective
The objective of this paper is to present a method to evaluate the impact on air transport production (expressed in terms of RPK - revenue per passenger kilometer) and average costs (expressed in terms of CASK - cost per available seat kilometer) after the acquisition of a Bra-zilian growing low-cost airline by its dominant competitor, using Cobb-Douglas functions.
2. METHODOLOGY
In this study it is proposed to conduct the RPK and CASK impact study after the acquisition of Webjet Linhas Aéreas SA by VRG Linhas Aéreas (so called GOL airlines), of icially consolidated in October 2012. On that date the Webjet 737-300 leet (20 aircraft) was incorporated into GOL, together with company routes (18 common destinations) and employees. For that the following RPK and CASK models, derived from the Cobb-Douglas functions, are used:
= . . !"# $. %&' (. ') * (4) = . . _ !"# $. _%&' (. _"', * (5)
On log-linear format:
- ( ) = + . - ( ) + $. - ( !"#) + (. - (%&' ) + *. - ( ')) (6) - ( ) = + . - ( ) + $. - ( _ !"#) + (. - ( _%&' ) + *. - ( _"',) (7)
where ASK: Total available seat kilometers offered;
COMB: Total Fuel Consumed (Million Liters);
FUNC: Total Number of Effective Staff;
ANV: Total number of company leet aircraft;
βi: Elasticity of production in relation to the considered inputs.
RPK: Revenue Passenger-kilometers (demand);
C_COMP: Consumed Fuel Cost per available seat kilometer (cents $ / pax.km); C_FUNC: Personnel Cost per available seat kilometer (cents $ / pax.km); C_MNT: Maintenance Cost per available seat kilometer (cents $ / pax.km);
ai: Elasticity of costs in relation to the considered inputs.
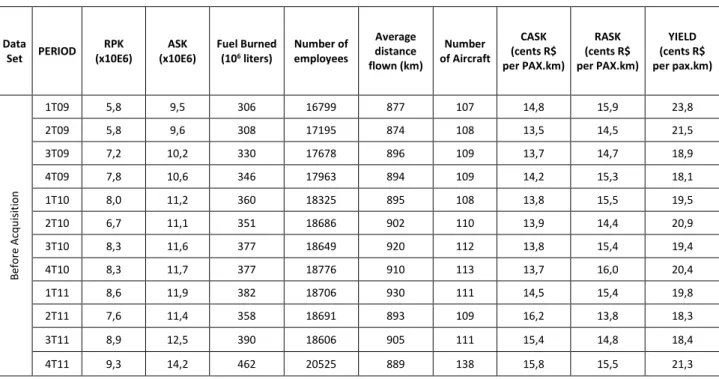
Table 1: GOL Airlines air transport data
Data Set PERIOD RPK (x10E6) ASK (x10E6) Fuel Burned (106 liters) Number of employees Average distance flown (km) Number of Aircraft CASK (cents R$ per PAX.km) RASK (cents R$ per PAX.km) YIELD (cents R$ per pax.km) B e fo re A cq u is it io n 1T09 5,8 9,5 306 16799 877 107 14,8 15,9 23,8 2T09 5,8 9,6 308 17195 874 108 13,5 14,5 21,5 3T09 7,2 10,2 330 17678 896 109 13,7 14,7 18,9 4T09 7,8 10,6 346 17963 894 109 14,2 15,3 18,1 1T10 8,0 11,2 360 18325 895 108 13,8 15,5 19,5 2T10 6,7 11,1 351 18686 902 110 13,9 14,4 20,9 3T10 8,3 11,6 377 18649 920 112 13,8 15,4 19,4 4T10 8,3 11,7 377 18776 910 113 13,7 16,0 20,4 1T11 8,6 11,9 382 18706 930 111 14,5 15,4 19,8 2T11 7,6 11,4 358 18691 893 109 16,2 13,8 18,3 3T11 8,9 12,5 390 18606 905 111 15,4 14,8 18,4 4T11 9,3 14,2 462 20525 889 138 15,8 15,5 21,3
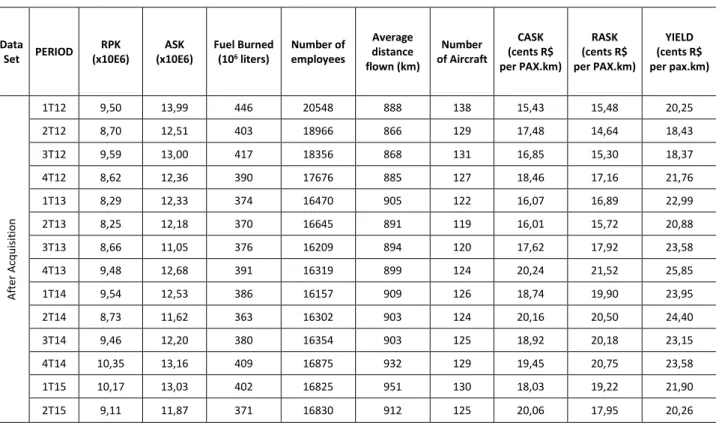
Table 1: GOL Airlines air transport data (cont) Data Set PERIOD RPK (x10E6) ASK (x10E6) Fuel Burned (106 liters) Number of employees Average distance flown (km) Number of Aircraft CASK (cents R$ per PAX.km) RASK (cents R$ per PAX.km) YIELD (cents R$ per pax.km) A ft e r A cq u is it io n 1T12 9,50 13,99 446 20548 888 138 15,43 15,48 20,25 2T12 8,70 12,51 403 18966 866 129 17,48 14,64 18,43 3T12 9,59 13,00 417 18356 868 131 16,85 15,30 18,37 4T12 8,62 12,36 390 17676 885 127 18,46 17,16 21,76 1T13 8,29 12,33 374 16470 905 122 16,07 16,89 22,99 2T13 8,25 12,18 370 16645 891 119 16,01 15,72 20,88 3T13 8,66 11,05 376 16209 894 120 17,62 17,92 23,58 4T13 9,48 12,68 391 16319 899 124 20,24 21,52 25,85 1T14 9,54 12,53 386 16157 909 126 18,74 19,90 23,95 2T14 8,73 11,62 363 16302 903 124 20,16 20,50 24,40 3T14 9,46 12,20 380 16354 903 125 18,92 20,18 23,15 4T14 10,35 13,16 409 16875 932 129 19,45 20,75 23,58 1T15 10,17 13,03 402 16825 951 130 18,03 19,22 21,90 2T15 9,11 11,87 371 16830 912 125 20,06 17,95 20,26
3. PRELIMINARY DATA ANALYSIS
In this session we conduct a preliminary analysis of the RPK and CASK trends before and after the acquisition, as function of selected input variables, according to Figures 1a,1b,2a,2b,3a,3b,4a and 4d. In this scope, the following observations are relevant:
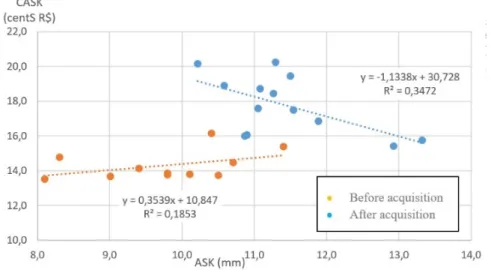
Figure 1a shows that the RPK scattering increased with ASK after the acquisition, suggesting that both ASKs (from GOL and Webjet) were not complementary, implying that the superposi-tion of networks from both companies may be presenting competing routes. This is also sug-gested in Figure 1b where a signi icant increase in average costs (CASK) is observed after the acquisition, never equalized to pre-acquisition levels.
Figure 2a shows that, after the acquisition, the RPK continued insensitive to the increased number of employees, thus suggesting a drop in the company´s ef iciency to generate revenue. Figure 2b shows a signi icant increase of CASK after the acquisition, almost returning to the initial levels prior to the acquisition, after Webjet’s employees were incorporated.
Figure 1b. CASK x ASK (Source: www.voegol.com.br)
Figure 2a. RPK x Number of Employees (Source: www.voegol.com.br)
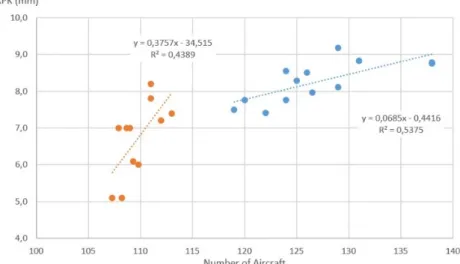
Figure 3a. RPK x Fleet size (Source: www.voegol.com.br)
Figure 3b. CASK x Fleet size (Source: www.voegol.com.br)
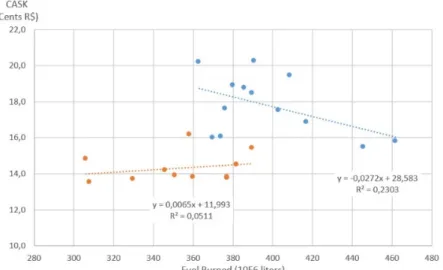
Figure 4a shows the RPK increasing proportionally with fuel consumption prior to the ac-quisition. In fact, this trend after the acquisition decreased with a reduction of the representa-tiveness of the linear model (R2=0.52). Figure 4b shows a strong CASK scattering with fuel con-sumption in both samples, which may be attributed to other cost factors not related to fuel.
Figure 4b. RPK x Fuel Consumed (Source: www.voegol.com.br)
4. REGRESSION RESULTS AND DISCUSSION
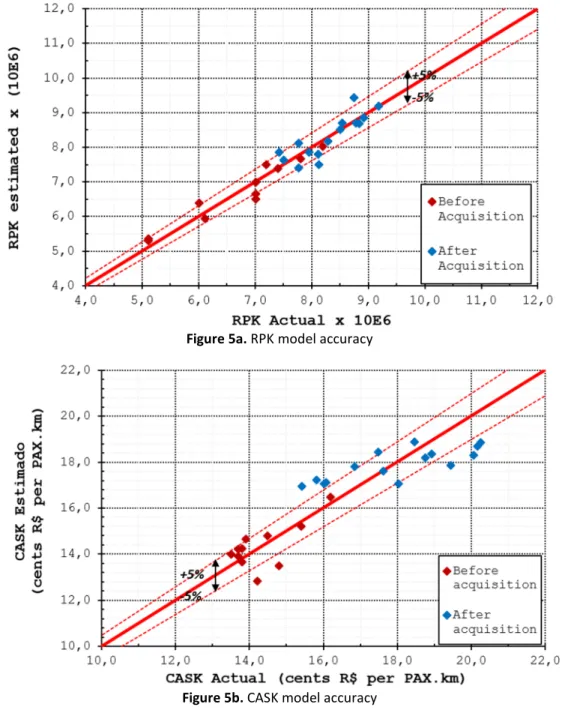
In this session we present and discuss the multivariate regression results considering the se-lected inputs for both RPK and CASK models. Tables 2a and 2b show the main factors of the ANOVA analysis of such regressions. Figures 5a and 5b show the accuracy of RPK and CASK models compared with the actual values, within a 5% error band.
Table 2a: RPK regression (ANOVA analysis)
Coefficient
Before Acquisition After Acquisition Calcula-ted Value Std error t stat t 95% p value Calculated Value Std error t stat t 95% p value Intercept 8,8114 9.6412 0.9139 -14.7799 0.3960 -4,6213 2.3350 -1.9791 -9.8240 0.0760 Ln (ASK) X1 0,2257 0.6177 0.3653 -1.2858 0.7274 -1.2984 0.0752 -1.8413 -2.8695 0.0954 Ln (COMB) X2 2.4141 0.9163 2.6346 0.1720 0.0388 2.5508 0.9981 2.5556 0.3268 0.0286 Ln (FUNC) X3 -1.4677 1.0498 -1.3982 -4.0364 0.2116 -0.7265 0.2115 -3.4348 -1.1978 0.0064 Ln (NANV) X4 -1.5308 1.5108 -1.0132 -5.2275 0.3501 0.3561 0.7672 0.4662 -1.3532 0.6525 R² 0.9463 0.9021 F (F significance) 26.4168 (0.0006) 23.0452 (0.0000) Homogeneity Factor (r) -0.3587 0.9021
Decreasing Return of Scale Increasing Return of Scale
Table 2b: CASK regression results (ANOVA Analysis)
Coefficient
Before Acquisition After Acquisition Calculated Value Std error t stat t 95% p value Calculated Value Std error t stat t 95% p value Intercept 1.8320 0.1205 15.2091 1.5472 0.0000 1.2563 0.6977 1.8005 -0.3220 0.1052 Ln (RPK) X1 -0.0951 0.0589 -1.6163 -0.2343 0.1501 0.1647 0.2353 0.7000 -0.3676 0.5016 Ln (C_COMB) X2 0.5605 0.1096 5.1155 0.3014 0.0014 0.5134 0.2126 2.4142 0.0032 0.0389 Ln (C_FUNC) X3 0.0599 0.1379 0.4340 -0.2663 0.6774 0.2675 0.1735 1.5413 -0.1250 0.1576 Ln (C_MNT) X4 -0.0823 0.0219 -3.7561 -0.134 0.0071 0.1573 0.0467 3.3660 0.0515 0.0083 R² 0.8969 0.7568 F (F significance) 15.2257(0.0015) 7.0004 (0.0076) Homogeneity Factor (r) 0.4429 1.1029
Figure 5a. RPK model accuracy
Figure 5b. CASK model accuracy
Therefore, for the pre-acquisition period (1T09-3T11) the following Cobb-Douglas functions were obtained:
Ln(RPK)=8,8114+0,2257⋅Ln(ASK)+2,4141.ln(COMB)−1,4677..Ln(FUNC)+1,5308.Ln*(ANV) (8) Ln(CASK)=1,8320−0,0951.Ln(RPK)+0,5605.Ln(C_COMB)+0,0599.Ln(C_FUNC)+0,0823.Ln(C_MNT) (9) For the post-acquisition period (4T11-2T15) the following Cobb-Douglas functions were ob-tained:
Ln(RPK)=−4,6213−1,2984⋅Ln(ASK)+2,5508.ln(COMB)−0,7265..Ln(FUNC)+0,3561.Ln*(ANV) (10) Ln(CASK)=1,2563+0,1647.Ln(RPK)+0,5133.Ln(C_COMB)+0,2674Ln(C_FUNC)+0,1573.Ln(C_MNT) (11) From the results it is possible to conclude that the log-linear models obtained for RPK pre-sented a high degree of representativeness (R² greater than 0.9 in both periods). On the cost side, the CASK model also represented signi icantly the results, but was less representative in
the second period (R² ranged from 0.8969 to 0.7568). The estimated outputs outside the 5% margin may be attributed to the in luence of non-considered inputs.
The ANOVA analysis shows that the estimation coef icients pass the 95% Student's t-distri-bution-test and F calculated much larger than signi icance, suggesting that the results of all re-gressions can be considered representative. Also, the analysis has shown that the inputs related to fuel consumption and fuel costs have signi icant in luence on the proposed models, since their p-values are less than 0.05 between and after the acquisition. The same occurs with maintenance costs in the CASK model.
The production return of scale calculated via RPK model after the acquisition, approached the unit value which means that diminishing returns of scale are present. This is an expected effect observed in airlines with large leets, speci ically over twenty aircraft (Doganis, 2001). This suggests that the economy of scale achieved did not provide an ef icient growth for the company despite increasing the number of routes, aircraft and staff. On the cost side, disecono-mies of scale after the acquisition have been observed, suggesting an increase in costs probably motivated by the replication of administrative features of the two companies for a certain pe-riod.
The positive elasticity of production with respect to fuel consumption in both periods pre-sented almost the same magnitude, which is consistent with the expected result (higher con-sumption, more lights, bigger production). The small variation of this value suggests that the operational standards of both companies may be similar and therefore no major changes occur on how pilots operate the aircraft. In fact, this is supported by the incorporation of the Webjet Boeing 737-300 leet into GOL Boeing 737-700 / 800, variants of the same model. Indeed, this leet growth has shown positive impact on the elasticity of production in relation to the number of aircraft.
The elasticity of production in relation to the number of employees, which was negative in both periods, shows that probably there were not enough efforts in place to improve the pro-duction ef iciency after the acquisition, despite some slight improvement of this value. In the second period, the elasticity of costs in relation to the number of employees became signi i-cantly more positive, suggesting that the measures taken for headcount reduction in the follow-ing months had unsuccessful effects on operatfollow-ing costs. In addition, the route superposition may have impacted on the number of employees in the short term, once a duplicated number of employees and enhanced infrastructure were present at the related stations.
However, it can be noticed that the elasticity of maintenance costs was the parameter that mostly increased, possibly because of the dif iculty of adapting to signi icantly different mainte-nance management methodologies adopted in both leets before the acquisition.
The Webjet routes incorporation into GOL´s network possibly diluted the traf ic where both companies were most likely competitors, reducing the utilization ef iciency. The authors believe that this is the cause of the signal reversal of production elasticity related to the ASK. Also, a signi icant positive jump of the elasticity of costs in relation to this input can be observed, sug-gesting that the new seats offered from the incorporation of the new leet and incremental staff
5. CONCLUSIONS
In the present research, we studied the impact on air transport production and costs after the acquisition of the LCC Webjet by VRG Linhas Aéreas (so called GOL Airlines) in October 2011.
Cobb-Douglas functions were designed to model RASK and CASK in the periods 12 months be-fore and after the acquisition.
A multivariate log-linear regression was used to determine the associate elasticities of the production and cost functions regarding the selected input variables. On the production side (RASK) the following inputs were selected: ASK (available seat kilometer), fuel consumption, number of employees and leet size. On the cost side (CASK) the following inputs were consid-ered: RASK, fuel costs, maintenance costs and labor costs.
The selected model has shown a very good correlation between the selected inputs and out-puts in both periods (R2 greater than 0.9 for RASK and greater than 0.75 for CASK) and can therefore be considered adequate for the proposed analysis. With the present analysis, the iden-ti icaiden-tion of important inef iciencies was possible, mainly related to increased number of seats offered in previous competing routes (duplicated after the acquisition) and increased number of employees after the acquisition. In addition, decreasing productivity and increased initial op-erating costs (especially in relation to maintenance and personnel) turned out to be the biggest challenge for the group, and were not completely sorted out until the last period of the analysis. Finally, diseconomies of scale were identi ied after the acquisition, suggesting increasing costs due to the duplication administrative features of the two companies.
Therefore, it has been demonstrated that the Cobb-Douglas function may be used as an ef-fective and simple modeling tool in the evaluation of the impact on production (RPK) and costs (CASK) after the acquisition of an airline by another one. The authors propose that this meth-odology be applied in short term analysis and consider it therefore adequate to be used for tac-tical decisions of airlines.
Although the selected inputs for both models were adequate for this proposal, it is worth mentioning that there may be other non-operational factors (i.e. cost of capital and infrastruc-ture) that may impact the results, which were not included in this selected set of inputs These factors can be addressed in future research developments.
REFERENCES
ABEAR (2014). Panorama 2014:O setor aéreo em dados e análises. Associação Brasileira das Empresas Aéreas. São Paulo, Bra-sil.
Barros Junior, J. R. S. N. (2007). Custos no Transporte Aéreo: Determinantes e Modelos. Journal of Transport Literature (RELIT) Vol.1, n.2, pp.70-109 Jul 2007. São José dos Campos, Brasil.
Bao Hong, T. (2008). Cobb-Douglas Production Function. European Economy Seminar. NOVA School of Business. Lisbon, Portu-gal.
Bettini, H. F. A. J. e Oliveira, A. V. M. (2011) Transporte aéreo regional: entre economias de densidade e custos de transação. Jour-nal of Transport Literature, vol. 5, n. 4, pp. 171-187.
Caves, D.W.; Christensen, L. R. e Threteway, M.W. (1984) Economics of Density Versus Economies of Scale: Why Trunk and Local Service Airline Costs Differ. Rand Journal of Economics, v. 15, p. 471-489. DOI: 10.2307/2555519
Cobb, C.W. e Douglas, P.H. (1928). A Theory of Production. American Economic Association, pp.139-165. New York, United States of America.
Doganis, R. (2001). The Airline Business in the 21st Century. London: Routledge, 1st. Edition, 2001.
Fregnani, J. A.T. G.; Ferreira, N. S. e Gabrieler M. C. (2009). Análise dos Custos Logísticos no Transporte Aéreo Regional. Journal of Transport Literature (RELIT) Vol.3, n.2, pp.7-25 Jul 2009. São José dos Campos, Brasil.
Kuroda, E. T.; Kalfas, A. J. e Eller, R. A. G. (2012). Aplicação da função Cobb-Douglas para a análise da produtividade no setor aéreo. Journal of Transport Literature (RELIT) Vol.6, n.2, pp.169-179 abril 2012. São José dos Campos, Brasil.
DOI:10.1590/S2238-10312012000200009
Martins, F. G. D.; Da Silva, F.; G. F., Rocha, C. H.; Queiroz, M. e Araújo, C. E. F. (2012) Análise de e9iciência estimando fronteiras paramétricas Cobb-Douglas e translog: o caso de empresas de transporte rodoviário interestadual de passageiros por ônibus no Brasil. Journal of Transport Literature, vol. 6, n. 3. DOI: 10.1590/S2238-10312012000300002
Silveira, J. A. (2003). Transporte Aéreo Regular no Brasil: Análise econômica e função de custo. Dissertação de Mestrado. Universidade Federal do Rio de Janeiro. COPPE, 2003.
GOL (2012). Comunicados e Fatos Relevantes 10/12/2012: GOL Anuncia Aprovação pelo CADE para Aquisição da Webjet. VRG Linhas Aéreas. SãoPaulo, Brazil.
GOL (2015). Relatórios Trimestrais 2011-2015. VRG Linhas Aéreas. < http://ri.voegol.com.br > (Acesso em 30 de agosto de 2015)
Yang, X. e Zhu, Y. (2015). The Analysis of Technical Ef9iciency of Airlines in China. International Conference on Mechatronics, Electronic, Industrial and Control Engineering (MEIC 2015). Atlantis Press.