Review article UDC: 669.11/.187:338.312(510)”1998/2007” doi: 10.10.18045/zbefri.2015.2.299
Industry regulation, competition, and the dynamics
of productivity growth: evidence from China’s
iron and steel industry
*1Jianbai Huang
2,
Chuan Liu
3,
Daguo Lü
4,
Xiaoping Li
5Abstract
This study aims to investigate the characteristics of the eficient evolution of China’s iron and steel industry against the backdrop of limited openness and regulation and to discuss the important effects of regulatory policy and total factor productivity (TFP) of China’s iron and steel industry. The method adopted the Cobb–Douglas production function combined with a semi-parametric method to decompose productivity. This study based on the micro-level dataset of iron and steel enterprises in the database of China’s industrial enterprises between 1998 and 2007 that investigated the intrinsic correlation among corporate entry and exit, market competition of existing enterprises, and TFP growth in the iron and steel industry.The results of the research show that the entry-exit would promote the growth of the aggregate productivity, while the low eficiency of resource allocation would signiicantly inhibit the TFP growth. The basic conclusion is that, with substantial government intervention in enterprise investments, market
* Received: 29-05-2015; accepted: 15-12-2015
1 This project was funded by The National Natural Science Foundation of China (Grant No.
71373283), and the Key Project of National Social Science Foundation of China (Grant No. 13&ZD024). This paper was supported by Dr. Feitao Jiang, Prof. Ze Jian, and Dr. Frank Gao.
2 Full Professor, Business School, Central South University, Changsha, 410083, China. Scientiic
afiliation: industrial strategies, experimental economics. Phone: +86 1 3873 120 588. E-mail: jbhuang@csu.edu.cn.
3 PhD Candidate, Business school, Central South University, Changsha, 410083, China. Scientiic
afiliation: industrial policy, industrial economics. Phone: +86 1 3974 808 838. E-mail: cliu1914@ foxmail.com.
4 Lecturer, Institute of Industrial Economics, Jiangxi University of Finance Economics,
Nanchang, 330013, China. Scientiic afiliation: industrial organization, industrial economics, regional economics. Phone: +86 1 3851 995 041. E-mail: peterlv1979@126.com.
5 PhD, Associate Professor, Business School, Central South University, Changsha, 410083,
300 Zb. rad. Ekon. fak. Rij. • 2015 • vol. 33 • sv. 2 • 299-324 competition may not promote optimal resource allocation eficiency in China’s iron and steel industry, but make the allocation less eficient.
Key words: productivity dynamics, industry regulation, market competition, China
JEL classiication:L52
1. Introduction
The level of government microeconomic intervention and regulation has been
signiicantly reduced since China’s all-round implementation of a market-oriented reform in 1994. Market openness, growing competition, the emergence of non-state-owned enterprises, and the subsequent transformation of the market structure
have characterized China’s economic and structural transitions (Naughton, 1992;
McMillan and Naughton, 1992; Perkins, 2002; Li, et al., 2012). Further studies have indicated that market openness expedites market entries and exits of enterprises, which promote the market-oriented transition of resource allocation. The facilitation of market entries and exits increases the growth of total factor productivity (TFP) at the corporate level through competition but enhances the eficiency of resource allocation among enterprises, thus contributing to the overall TFP improvement at the aggregate level (Li et al., 2012).
However, China has retained extensive intervention and regulation in some important industries and economic sectors (the World Bank, 2013), and such
intervention and regulation have been largely strengthened after 2003. The Chinese
government in the process of a market-oriented reform substantially reduced the intensity of its regulation on the iron and steel industry, where the level of market
openness greatly increased. Nevertheless, the Chinese government still attempted
to maintain a strong inluence on the iron and steel industry as a key industry for the economy and retained extensive regulatory measures. An interesting question for the industries in which the government has retained extensive intervention and regulation is whether limited market openness and competition have improved their overall industry productivity and whether the extensive microeconomic intervention
retained by the government for this sector impedes the improvement of industry productivity.
Some studies believe that the market entry of many non-state-owned enterprises has led to excessive competition, repetitive construction, and overcapacity of many
industries, including the iron and steel industry, and has caused the deterioration
of productivity in these industries (Yang Huixin, 2000; Wei Houkai, 2003; Luo
Yunhui, 2004). China’s central government holds a similar view that the large-scale entry of new enterprises in the iron and steel industry causes serious problems of repetitive construction or overcapacity, and it attempts to enforce a tight control of
market access. Moreover, China’s central government has also adopted regulatory
on corporate investments for capacity expansion. The central government has also
introduced an industrial policy to support state-owned large enterprises and restrict
the development of small enterprises in the iron and steel industry (Jiang and Li, 2010). Most of these state-owned iron and steel enterprises are ineficient but are
still supported by the industrial policy of the central government. Moreover, these state-owned enterprises have the serious problem of soft budgetary constraint and are often bailed out by the government whenever threatened by potential
bankruptcies.
Local governments in China also play an important role in the intervention of the development of iron and steel enterprises. Local governments help local enterprises
escape the restrictions of regulatory policies introduced by the central government.
For example, they give assistance to local enterprises to enter the iron and steel
industry despite the central policy restrictions, or they give assistance to local
iron and steel enterprises to expand their capacity despite the central government restrictions. Local governments also support the development of local iron and steel enterprises by offering cheap land, relaxing environmental regulation, and offering tax preferences and iscal subsidies. These activities of the local governments are conducive to the entry of new enterprises that intensify market competition and promote the improvement of industrial eficiency. However, the protection
and support of the local government to local enterprises may distort competition,
disrupt the market mechanism of “survival of the ittest,” and impede eficiency
improvement.
The behaviors of iron and steel enterprises and the competitive landscape of the industry as a whole under the effect of different interventions of the central and local governments are distorted. The relationship among entry and
exit, market competition, and industry aggregate TFP growth is also likely to experience aberration. This study attempts to verify whether such an aberration has occurred by revealing the relationship among the entry and exit of the iron and steel industry, market competition, and industry TFP growth through an empirical study. This study also discusses the far-reaching inluence of limited market openness, government regulation, and intervention on the evolution of the eficiency of the iron and steel industry. This research is based on the theoretical
foundation of the industrial evolution model by Hopenhayn (1992). Thus, this
study proposes the hypothesis as follows: The entry-exit would promote the
growth of the aggregate productivity, accompanied by improving cross-enterprise
allocation eficiency.
The rest of this paper is structured as follows. Section 2 presents a literature
review of the current studies. Section 3 introduces the theoretical frameworks and
302 Zb. rad. Ekon. fak. Rij. • 2015 • vol. 33 • sv. 2 • 299-324
2. Literature review
Theoretical and empirical research has extensively pointed out that market competition is an important force in the promotion of TFP growth at the corporate level and in the eficiency enhancement of resource allocation at the cross-enterprise level (Vickers, 1995; Nickell, 1996; Disney, Haskel and Heden, 2003;
Syverson, 2004; Holmes and Schmitz, 2010). These studies suggest that the three
channels exist for the enhancement of the overall industrial productivity through market competition. The irst channel is the productivity improvement of existing enterprises in an industry. Existing enterprises increase productivity by adopting
new technologies and adjusting their organizational structure, such as the reasonable allocation of corporate resources through internal restructuring. The second channel is the mechanism for the optimized cross-enterprise allocation of resources among
existing enterprises; that is, market competition leads to the low of market share and factor resources from ineficient enterprises to highly eficient enterprises to optimize the eficiency of resources within an industry. The third channel is the mechanism of market selection; that is, the entry of highly eficient enterprises into the market intensiies market competition and forces ineficient enterprises to exit the market. A number of studies have been conducted on enterprise competition
behaviors. Barberá et al. (2013) studied the reliability and validity of industrial
assets. Bendato et al. (2015) examined the adjustment of dynamic production systems under the luctuation margin environment.
Recent studies have begun to follow the TFP of China’s manufacturing enterprises and the effect on TFP at the industry level (Bartelsman et al., 2009; Hsieh and Klenow, 2009; Li Ping et al., 2011). These studies have suggested that productivity
varies greatly across the enterprises of China’s manufacturing sectors with an
ineficient resource allocation. Hsieh and Klenow (2009) argued that, if resources could be allocated to highly eficient enterprises of the manufacturing sectors in China and India similar to their counterparts of the United States, then the TFP of
both countries could be increased by 30% to 50% and 40% to 60%, respectively. Brandt et al. (2009) used the data of China’s manufacturing enterprises between
1998 and 2006 and found that resources low from ineficient SOEs to highly eficient private enterprises, provided that the entry and exit of enterprises are based on free choice. Moreover, such a reallocation of resources further increases the TFP
of China’s manufacturing sectors.
These studies are highly relevant for the understanding the TFP evolution of
China’s manufacturing sectors and enterprises. However, these studies have neglected the potentially adverse effects of China’s institutional and policy defects
local irms, These ineficient irms expanded their capacity and market share under various preferential policies offered by local governments. Hence, the market mechanism of the “survival of the ittest” failed to function effectively. China has introduced an industrial policy to “protect and support state-owned large enterprises
and restrict the development of small- and medium-sized enterprises” in capital-intensive industries, such as the iron and steel, petroleum, and chemical engineering
industries. Such an industrial policy protects ineficient state-owned enterprises and accelerates their quantitative expansion. However, the development of eficient
private small- and medium-sized enterprises is constrained (Jiang, et al., 2010). The iron and steel industry has been an important area in the subsidized competition and implementation of interventionist industrial policy by local governments over
the years. Therefore, the study on the distribution and evolution of TFP and the
productivity distribution and evolution of iron and steel enterprises offers valuable insights for the analysis of the adverse effects of China’s institutional and policy distortions on corporate productivity and the overall industrial productivity.
3. Methodology
3.1. Theoretical framework
The analysis of this study is built upon the theoretical foundation of the industrial evolution model of Hopenhayn (1992), which investigates an industry that consists of a multitude of manufacturers of homogeneous products with varying productivity. Each manufacturer determines the level of output according to
factor input and stochastic productivity shock ζ. Productivity shock ζ is mutually independent for each manufacturer and conforms to the irst-order Markov process.
The productivity distribution function for the manufacturer in the future phase can
be expressed as F(ζt+1|ζt), where F(ζt+1|ζt) is a strictly decreasing function of ζt. That is, the probability for a manufacturer to possess high productivity in a future period increases with the growth of the current phase productivity.
In each phase, an existing manufacturer makes the choice of whether to pay the ixed cost Cf and continue the operation or to exit the market before observing the
realization of productivity shocks. The manufacturer determines the level of its output after observing the realization of the current phase of productivity shocks
if the manufacturer elects to continue operation. Potential entrants choose whether
or not to pay a sunk cost Ce for market entry. If it elects to enter the market, it will determine the level of its output according to the realization of productivity
304 Zb. rad. Ekon. fak. Rij. • 2015 • vol. 33 • sv. 2 • 299-324 and the minimum productivity level ζ* required for an existing manufacturer to stay in the market. The sunk cost Ce of market access becomes a basic exogenous
variable that affects the transformation of the market structure given that the model assumes the existence of homogeneous products and numerous buyers and sellers in the market.
The analytical result of this model is indicated as a basic exogenous variable of the model. Variations in the sunk cost Ce for market entry exert an important
effect on the decision making of manufacturers for market entry and exit and for the variation of the market structure. Based on the given initial productivity distribution G(ζ), the discount proits required for an enterprise to compensate for the sunk cost of market entry decrease if the sunk cost of market entry
decreases; this decrease encourages the entry of potential manufacturers.
Manufacturers entering the market can observe the current-phase productivity ζt, and future productivity is expected to evolve on the track of distribution function F(ζt+1|ζt). Given that F(ζt+1|ζt) is a strictly decreasing function of ζt, an
ineficient manufacturer develops an expectation of future low productivity and low expected proits. Therefore, if the productivity of enterprise ζt is below ζ*
for the given minimum productivity level required to stay in market ζ*, it will opt to exit the market. However, manufacturers with productivity ζt above ζ* stay
in the market, and their productivity and scale of production continuously grow
over time. Enterprises with higher productivity enjoy a much rapid growth of
their market share. The reductions of entry cost and the entry of new enterprises also increase the productivity level required to create a positive expected proit in the future, thus increasing the minimum productivity level ζ* required for an enterprise to stay in the market. Therefore, potential players enter the market because of the reduced sunk cost for entry, while less productive ones exit the market. Under an equilibrium state, signiicant entry and exit ratios are likely to occur, and a positive correlation exists between them.
The reduction of sunk cost for market entry has inspired a dynamic competition process based on the mechanism of market choice of the “survival of the ittest.” In this process of dynamic competition, the average productivity of exiting irms is below the average productivity of surviving irms, considering that exiting irms are mainly the least productive ones. Hopenhayn (1992) proved that F(ζt+1|ζt) has stochastic dominance for the initial productivity distribution of new entrants
G(ζ) as long as F(ζt+1|ζt) is a strictly decreasing function of ζt, given that the
productivity distribution of existing manufacturers is a result of the phase-out of ineficient ones. Therefore, existing manufacturers are more productive than new
entrants. The evolving distribution of productivity and scale among manufacturers becomes an important source of productivity growth at the industry level in the
players have fueled productivity growth at the industry level. The reduction of
sunk cost for market entry has increased the minimum required productivity level for existing manufacturers to stay in the market, and it provides incentives for the
growth of corporate productivity at the micro level. However, the mechanism of
market competition and choice through “survival of the ittest” gives rise to
cross-enterprise resource reallocation based on productivity. Production gradually shifts
to more productive irms as less productive irms exit market. Thus, improvement in the eficiency of cross-enterprise resource allocation becomes an important source of TFP growth.
This theoretical model is based on certain assumptions, but the revealed mechanism
of open competition provides an important reference for the analysis of market entry and exit for competitive industries and the evolution of market competition and TFP in the process of market-oriented reform and deregulation. The model also provides the theoretical benchmark for such an analysis of China’s iron and steel industry under the condition of limited market openness and extensive government interventions. The entry and exit of a large number of irms in a competitive industry of market entry deregulation inspire a dynamic competition process based on market choice. The reduction of sunk cost for market entry, the large-scale entry
of non-state-owned enterprises, and the intensifying competition have increased the
minimum productivity level required for irms to be proitable, and they incentivize
microeconomic entities, including state-owned enterprises, to increase productivity.
Less eficient irms in the process of market competition are driven out from the market and economic resources, and the share of production is gradually allocated to more productive irms. Given the signiicant differences in productivity level and the ownership structure across irms, the mechanism of market choice based on “survival of the ittest” and the cross-enterprise resource reallocation are likely to become drivers of gradual transition and important sources for TFP growth at the
industry level. This industrial evolution model can be considered as a theoretical foundation to support the presented hypothesis.
3.2. Measurement of TFP
To measure the TFP of industries correctly, this study that is based on the Cobb–
Douglas production function follows the corporate production function developed by Syverson (2011) combined with a semi-parametric method developed by
Levinshohn and Petrin (2003) to resolve the endogenous problem. The speciic explanations are as follows:
According to Syverson (2011), assume that the corporate production function has the form of a Cobb–Douglas production function
, ,( , , , , )
i t i t
, 1 ( / )
it E it i t it
ζ
=ζ
ζ
− +σ
, (7)where �it is not correlated with capital kit but may be correlated with lit. Therefore, based on Equation (7), Equation (4) can be expressed as
( , )
it it it it it it
y =
β
l +ψ
k m +η
, (8)where the non-parametric function
0
( , ) ( , )
it k mit it a kit it k mit it
ψ
= +α
+ζ
. (9)By replacing ψ in Equation (8) with the three-order polynomials of kit and mit,
3 3
0 0 0
i j
it it i j ij it it it
y
δ
β
l
δ
k m
η
= =
=
+
+
∑ ∑
+
. (10)In this manner, α cannot be identiied to arrive at the consistent evaluation of labor
output elasticity β using the ordinary least square method for the estimation of Equation (10).
To identify capital output elasticity α, this research expresses the estimator of ψ as
3 3
0
0 0
ˆ
i jit ij it it it
i j
k m
l
δ
δ
β
= =
Ψ =
+
∑∑
−
.(11)
For any possible capital output elasticity α*, the estimator of ζit can be written as
* it it
α
k
itζ = Ψ −
. (12)Then, the non-parametric consistent estimator of E(ζit|ζi,t-1) can be expressed as
. (13)
With the given consistent estimators of β, E(ζit|ζi,t-1), and α*, the residue error of the sample production function can be written as
. (14)
The estimator of α* can be estimated from the solution of the following problem of
minimization:
*
*
, 1
min
(
it it it(
it i tit
y
β
l
k
E
− α∑
−
− α
−
ζ ζ
2
308 Zb. rad. Ekon. fak. Rij. • 2015 • vol. 33 • sv. 2 • 299-324 The Golden Section Search method is adopted to minimize Equation (15). Thus, it
can be arrived at the consistent estimator of capital output elasticity α. The consistent
evaluator of TFP at the corporate level can be estimated using the following equation:
. (16)
3.3. Measurement of the TFP growth mechanism
Based on the method of Olley and Pakes (1996) and Foster, Haltiwanger, and Krizan (2006), this study deines the aggregate productivity TFPt of one industry or
the sum of several industries as the weighted average of TFP for various enterprises to further investigate the contribution of entry, exit, and market selection to the enhancement of industry TFP in a dynamic competition.
t it it
TFP =
∑
m TFP , (17)where mit is the weight that is usually denoted by the share of production of
enterprise i. Equation (17) indicates that the aggregate productivity of an industry
or the sum of several industries is subject to the following two factors: the corporate
TFP TFPit at the micro level and the status of the allocation of economic resources
across enterprises denoted by the share of production mit. Therefore, Equation (17)
provides a statistical framework for the empirical analysis on the productivity effect of entry, exit, and dynamic competition.
This study investigates the effect of resource reallocation driven by the market entry and exit on the overall productivity of industrial sectors and compares the relative
importance of productivity growth at the corporate level and the improvement in the
eficiency of cross-enterprise resource allocation. Thus, it is needed to decompose the aggregate productivity growth deined by Equation (17). Baily, Hulten, and
Campbell (1992) offered the following method of decomposition:
t i C it j it i C it it j
TFP
∈m
−TFP
∈m
TFP
−∆
=
∑
∆
+
∑
∆
+
∑
j
+
∑
i N∈m
it∆
TFP
it−
∑
i N∈m
it j−∆
TFP
it j−,
(18)
where C, N, and X respectively denote the sums of existing enterprises, new
entrants, and exiting irms. On the basis of this decomposition method, Foster,
Haltiwanger, and Krizan (2006) proposed the following method of decomposition:
( )
( ) ( )
t i C it j it i C it it j t j i C it it
it it t j it j it j t j
i N i X
TFP m TFP m TFP TFP m TFP
m TFP TFP m TFP TFP
− − −
∈ ∈ ∈
− − − −
∈ ∈
∆ = ∆ + ∆ − + ∆ ∆
+ − − −
∑
∑
∑
4. Empirical data and analysis
4.1. Empirical data source
The data are derived from the database of China’s industrial enterprises between 1999 and 2007 from the National Bureau of Statistics (NBS). This database has
the following important characteristics. First, it includes all the four-digit industries
of industrial sectors in each year between 1999 and 2007. Second, for each four-digit industry, this database provides important information on the basic situation,
inancial status, and proitability of industrial legal personal enterprises above
the designated scale, that is, all state-owned and non-state-owned industrial legal
person enterprises with an annual main business revenue exceeding 5 million yuan.
The information includes the company code, region, type of industry (four digits), capital composition, assets and liabilities, revenues and costs, intermediate input,
and proit distribution. For example, in the survey year of 2004, enterprises covered
in this database account for 71.2% of the total industrial aggregate employment and 90.7% of the entire industrial aggregate output. Therefore, the database provides a comprehensive overview of the industrial organization status of various industries of China’s industrial sectors. Third, unless mergers or reorganizations occur, the code for each and every enterprise in this database is unique and constant. It helps
to conveniently identify each enterprise and permits the tracking of inter-temporal
variations of each enterprise.
There are two following adjustments have been made to this database. First,
this research deletes the erroneous records that are illogical in reference to the
methodology of Li Yuhong, Wang Hao, and Zheng Yuxin (2008). A record is
considered an erroneous record and is deleted if an observation value meets any of the following four criteria: (1) the corporate aggregate output value is negative, (2) the various inputs of an enterprise are negative, (3) the original value of the
corporate ixed assets is smaller than the net value of the ixed assets, and (4) the
industrial value-added or intermediate input is greater than the gross industrial output value.
4.2. Variables
According to company code and year, this research selects enterprises come from
four iron and steel sectors, namely, steel smelting, iron smelting, steel rolling and processing, and iron alloy smelting, as cross-section units and large-scale non-equilibrium micro-level panel datasets between 1999 and 2007, including 41,113
observation values. Each observation value consists of 50 variables that relect
the basic situation, input and output, assets and liabilities, capital composition,
revenues and costs, and proit distribution of irms. The study then creates variables
310 Zb. rad. Ekon. fak. Rij. • 2015 • vol. 33 • sv. 2 • 299-324
a. Corporate net output level
The database of China’s industrial enterprises reports the overall output level, sales revenue, and industrial value-added of each enterprise. This study adopts the
delated industrial value added by the ex-factory price index i of industrial goods
in various regions that equal 1 in 1999 as the net output level for each enterprise Yit. However, this database does not report the industrial value added of each
enterprise in 2004. Therefore, as referenced the methodology of Liu Xiaoxuan and Li Shuangjie (2008) to estimate the industrial value added of each enterprise using
the following equation:
Corporate value-added = current-year sales revenue + end-of-phase inished products – beginning-of-phase inished products – intermediate inputs + current-year VAT volume.
In this equation, with the exception of beginning-of-phase inished products,
original data in the database of China’s industrial enterprises can all be found in
the database of China’s industrial enterprises. Liu Xiaoxuan and Li Shuangjie (2008) replaced the data of end-of-phase and beginning-of-phase inished products with end-of-phase and beginning-of-phase inventory to address the lack of data on beginning-of-phase inished goods. Given that the database of China’s industrial enterprises reports end-of-phase inventory, end-of-phase inished products, and beginning-of-phase inventory, this study estimates beginning-of-phase inished
products from beginning-of-phase inventory according to the share of end-of-phase
inished products in end-of-phase inventory to calculate the value added of various
enterprises more reasonably.
b. Corporate capital inventory
In the production theories of economics, capital input should be ixed capital
inventory when actual input goes into production. Thus, this research employs the perpetual inventory method to calculate corporate capital inventory Kit.
1
it it it it
K =K − +I −D .
The perpetual inventory method requires us to determine the original capital
inventory of each enterprise, actual investment volume of ixed assets in each
year Iit, and depreciation volume Dit. This study utilizes the net value of ixed assets of each enterprise in 1999. or the net value of ixed assets corresponding to the year that the enterprise irst appears in the database converted to the real values of 1999 according to the ixed asset investment price index of various
regions, as the initial capital inventory of enterprises. The database of China’s
each enterprise in each year. These values enable the calculation of the nominal investment volume of individual years at the corporate level according to the
difference between the original values of ixed assets in two adjacent years. The
nominal investment volume is then converted to the real value of 1999 according
to the ixed asset investment price index of various regions. The database of
China’s industrial enterprises directly reports the current-year depreciation values of various enterprises. This study converts these values into the real values of
1999 using the ixed asset investment price index of various regions. This study
then estimates the real capital inventory of each enterprise in each year according to the above equation.
c. Labor input and intermediate input
The database of China’s industrial enterprises reports the annual average number employed for each enterprise, which is used as the measurement of corporate labor input. This database reports the intermediate input of enterprises that is adjusted to
the constant price of 1998 using the ex-factory price index of industrial goods from
various regions as the measurement of intermediate input for various enterprises.
4.3. Empirical analysis
Table 1 explains the entry and exit situation of China’s iron and steel industry. This study calculates the entry ratio ER and exit ratio XR of four-digit sectors
using the data of China’s iron and steel enterprises for four-digit sectors between
1999 and 2007. The deinition of entrants and exiting irms is based on the database of China’s industrial enterprises. This research deines enterprises that irst appear in the database since 2000 as entrants. Enterprises that used to but ceased to appear in the database from a certain year are deined as exiting irms of the year. NE(t), NX(t), and NT(t) denote the number of entrants, the
number of exiting irms, and the total number of enterprises of industry in year
t, respectively. Entry ratio and exit ratio can be calculated using the following equation:
ER(t) = NE(t)/NT(t–1) XR(t) = NX(t)/NT(t–1)
In detail, Table 1 reports the average entry ratio, exit ratio, and institutional structures of entrants and exiting irms from the four four-digit sectors of China’s
iron and steel industry, namely, iron smelting (IS), steel smelting (SS), steel rolling
312 Zb. rad. Ekon. fak. Rij. • 2015 • vol. 33 • sv. 2 • 299-324 Table 1: The Entry-Exit situation in China’s iron and steel sector
Year Sector IS Sector SS Sector SP Sector AS
ER (%) XR (%) ER (%) XR (%) ER (%) XR (%) ER (%) XR (%)
2000 17.32 3.57 24.39 1.83 22.10 3.65 23.02 2.93
(79.20) (20.52) (41.95) (60.28) (70.62) (8.42) (46.79) (52.25)
2001 22.62 20.84 18.91 27.36 31.65 16.96 31.85 16.60
(19.06) (27.00) (41.09) (84.98) (11.26) (19.02) (26.59) (49.15)
2002 23.94 22.31 19.89 12.15 22.72 12.56 20.93 13.67
(16.14) (35.43) (69.11) (2.44) (60.79) (91.34) (17.43) (61.47)
2003 35.89 25.54 32.83 12.63 26.31 11.27 40.98 11.47
(4.08) (25.37) (3.14) (76.25) (30.50) (30.51) (25.30) (30.15)
2004 66.46 27.85 69.66 23.50 83.45 16.06 102.64 17.92
(1.82) (16.16) (5.48) (62.17) (18.39) (67.30) (11.00) (36.21)
2005 18.22 17.45 17.39 16.23 11.66 20.41 16.79 18.23
(4.25) (2.75) (25.26) (4.97) (3.71) (16.79) (21.20) (19.42)
2006 19.82 17.04 20.11 17.24 20.95 9.81 19.12 12.80
(3.46) (9.07) (42.36) (22.47) (14.55) (14.01) (7.87) (0.15)
2007 14.33 22.44 13.39 8.26 19.11 8.26 17.16 12.71
(3.96) (5.23) (0.34) (63.96) (12.38) (36.17) (5.04) (9.16)
Note: The numbers in brackets report the shares of non-state-owned capital in the capital aggregate of entrants and exiting irms for industrial sectors.
Source: The materials are taken from the NBS
The annual average entry ratio is 27.3% for the steel smelting sector, 27.1% for the steel smelting sector, 29.7% for the steel rolling and processing sector, and 34.1%
for the iron alloy smelting sector. The annual average exit ratio is 19.6% for the
iron smelting sector, 16.8% for the steel smelting sector, 12.4% for the steel rolling and processing sector, and 13.3% for the iron alloy smelting sector.
The numbers in brackets in Table 1 report the shares of state-owned capital for entrants and exiting irms. It shows that the share of state-owned capital in the entrants of the iron smelting sector is below 20% for years other than the irst
year of reporting, and the lowest is only 3.46%. In the iron alloy smelting sector, the share of state-owned capital in the entrants is below 50% for all reporting years, and the lowest is only 5.4%. The share of state-owned capital is below
30% in the entrants of the steel rolling and processing sector, with the exception
the share of state-owned capital in the entrants remains below 6% in 2003, 2004, and 2007, and even 1% in some years, for the steel smelting sector. The share
of state-owned capital is below 36% in the reporting years for the exiting irms of the iron and steel industry, and the lowest is only 2.75%. With the exception
of 52.25% in 2000 and 61.47% in 2002, the share of state-owned capital in the
exiting irms of the iron alloy smelting sector is below 50%, and the lowest in 2006 is only 0.15%. The share of state-owned capital among the exiting irms in the iron smelting and iron alloy smelting sectors has been on a signiicant decline
over the years. The share of state-owned capital is relatively balanced for the
exiting irms of the steel smelting sector. However, the average share of
state-owned capital across years is still less than 50% in addition to the declining trend
over the years. Among the exiting irms of the steel rolling and processing sector, the share of state-owned capital is below 37% for the other six reporting years, with the exception of two years of 2002 and 2004, and its trend line continues to demonstrate a weak decline over the years.
Table 2 analyses the cross-enterprise TFP growth and distribution by estimated the TFP at the corporate level based on the above semi-parametric method mentioned on section 3.2. This study discovers that stable parametric estimation values exist
for the production function of all industries in different sections, and thus the
analysis is created on the basis of comparable TFP.
Table 2 reports the cross-enterprise TFP distribution of the four four-digit sectors of the iron and steel industry. Table 2 presents three striking characteristics: First, the TFP of the upper quartile enterprises is at least three times higher than that of the lower quartile enterprises, with the exception of the steel smelting sector in 1999. Second, each part of the cross-enterprise TFP distribution, such as the lower quartile, median quartile, and upper quartile, all experience growth, and
the growth rate of the upper quartile is greater than that of the median and lower
quartiles. Third, productivity varies greatly among irms, the ratios between the average TFP of upper quartile enterprises and the average TFP of lower quartile
enterprises in iron smelting, steel smelting, steel rolling and processing, and iron alloy smelting sectors for 1999 are 2.79, 5.65, 4.46, and 4.06, respectively. The
ratios between the average TFP of upper quartile enterprises and that of lower
314 Zb. rad. Ekon. fak. Rij. • 2015 • vol. 33 • sv. 2 • 299-324 Table 2: Cross-enterprise TFP distribution of China’s industry
TFP Sector IS Sector SS
< 25% 25%–50% > 75% < 25% 25%–50% > 75%
1999 326.75 523.74 913.24 146.28 268.00 826.17
2000 282.48 517.55 939.83 137.30 259.10 808.03
2001 329.57 636.83 1155.74 197.39 433.85 1285.37
2002 376.53 749.72 1489.66 235.29 508.82 1548.44
2003 489.51 1027.83 2149.52 247.13 709.74 2044.89
2004 458.33 1110.87 2671.25 268.65 747.10 2786.66
2005 600.64 1423.96 3124.41 282.42 1007.88 2703.22
2006 588.28 1410.50 3211.20 303.11 1006.57 3308.00
2007 771.55 1766.58 4428.43 264.62 1151.48 3546.44
TFP Sector SP Sector AS
< 25% 25%–50% > 75% < 25% 25%–50% > 75%
1999 214.88 397.42 872.01 385.21 754.68 1567.44
2000 206.42 429.71 927.60 409.32 784.07 1604.55
2001 222.69 438.12 992.87 424.75 843.62 1685.30
2002 251.74 484.15 1115.66 490.05 990.09 1978.51
2003 309.64 619.86 1368.68 584.35 1217.80 2519.46
2004 253.97 542.94 1294.40 728.80 1411.91 2899.52
2005 316.30 718.52 1676.06 785.01 1605.68 3376.18
2006 342.20 769.31 1843.09 924.36 2118.15 4318.66
2007 396.51 905.51 2266.97 1333.68 2797.27 5843.59
Note: In this table, 25th, 50th, and 75th denote the lower, median, and upper quartiles, respectively. Source: The materials are taken from the NBS
Tables 3–6 explain TFP Growth mechanism. Item (1) is the contribution to TFP growth by existing enterprises weighted by their market share in the base period, and it is identical to the irst item in Equation (18). Item (2) is the contribution of market share reallocation among existing enterprises to the growth of aggregate
productivity. Item (3) is the coordinated variation; that is, this item is positive if
productivity and market share move in the same direction. The sum between Items
(2) and (3) measures the contribution of cross-enterprise resource reallocation to the growth of aggregate productivity, which is equivalent to the second item in Equation (18). Item (4) denotes the productivity of new entrants. If the productivity of new entrants is higher than that of the aggregate productivity of base period,
it will be greater than zero. On the contrary, if the productivity of new entrants
is below the aggregate productivity during base period, it will be smaller than
greater than zero. On the contrary, if the productivity of exiting irms is below that
of the base period, it will be smaller than zero. The difference between Items (4)
and (5) measures the contribution of the market entry and exit to the growth of
aggregate productivity, and they are quantitatively equivalent to the difference between the last two items of Equation (18).
Table 3: Results of the decomposition of the aggregate productivity growth volume for the iron smelting sector
Sector IS
Time Period
Speciication of TFP Growth
Subtotal Total TFP
Growth
Survival Entry Exit
(1) (2) (3) (4) (5) (2)+(3) (4)−(5)
1999–2000 −228.33 39.01 112.41 −358.37 −75.72 151.42 −282.65 −356.59
1999–2001 1730.49 −30.59 −17.10 358.96 −475.55 −47.69 834.51 2502.60
1999–2002 2139.49 −645.55 −280.11 2437.78 −1141.06 −925.66 3578.84 4801.90
1999–2003 4977.59 −1178.01 −649.95 2725.18 −1563.77 −1827.96 4288.95 7433.40
1999–2004 8191.84 −719.80 −2446.07 8558.87 −1533.99 −3165.87 10092.86 15120.17
1999–2005 4739.94 −487.75 −564.20 5929.23 −920.67 −1051.95 6849.90 10536.89
1999–2006 13879.67 −639.32 −3118.79 2986.88 −2178.23 −3758.11 5165.11 15263.75
1999–2007 20291.11 −646.44 −3424.01 6125.01 −2273.30 −4070.45 8398.31 24617.34
Source: The materials are taken from the NBS
Table 3 reports the results of the decomposition of the growth volume of aggregate productivity for the iron smelting sector. Item (1) of the decomposition
result indicates that the productivity growth of existing enterprises plays a major
role in the growth of aggregate productivity. Item (2) of the decomposition
result is negative, and it indicates that enterprises with a TFP that is below the aggregate productivity during the base period experience faster growth. The result of Item (3) is negative, and it explains that no variation exists in the same direction between the productivity growth of existing enterprises and the growth of market share. The sum between Items (2) and (3) is negative, and it means that the eficiency of cross-enterprise resource allocation is worsening and impedes
the improvement of the industry aggregate productivity. Item (4) is greater than zero, and it indicates that new entrants have promoted the improvement of
industry productivity. Item (5) is smaller than zero, and it means that less eficient enterprises are driven out from the market. The difference between Items (4) and (5) is far greater than zero, and it indicates that after the weighting of market share, entry and exit have made important contributions to the improvement of
316 Zb. rad. Ekon. fak. Rij. • 2015 • vol. 33 • sv. 2 • 299-324
Table 4: Results of the decomposition of the aggregate productivity growth for the steel smelting sector
Sector SS
Time Period
Speciication of TFP Growth Subtotal Total TFP Growth
Survival Entry Exit
(1) (2) (3) (4) (5) (2)+(3) (4)−(5)
1999–2000 1301.02 52.41 14.65 −89.59 −7.07 67.06 −82.52 1288.48
1999–2001 1703.84 −77.89 −37.15 7.74 −223.71 −115.04 231.45 1814.08
1999–2002 2743.84 −326.39 −352.55 −85.81 −328.37 −678.94 242.56 2319.08
1999–2003 5058.67 −681.90 −1178.05 498.67 −448.79 −1859.95 947.46 4152.42
1999–2004 6323.93 −682.79 −792.03 −280.71 −615.46 −1474.82 334.75 5181.79
1999–2005 8032.07 −754.22 −1827.52 498.09 −740.36 −2581.74 1238.45 6687.21
1999–2006 9140.78 −899.26 −1799.19 1326.78 −751.34 −2698.45 2078.12 8515.79
1999–2007 7179.22 −1002.39 −1095.85 2287.61 −756.21 −2098.24 3043.82 8124.60
Source: The materials are taken from the NBS
Table 4 reports the results of the decomposition of the aggregate productivity growth for the steel smelting sector. Its overall situation is similar to that of the
iron smelting sector; that is, the productivity growth of existing enterprises plays a major role in the aggregate productivity growth, and market entries and exits are key contributors to the improvement of industry productivity. At the same time, the eficiency of cross-enterprises resource allocation for existing enterprises is
worsening and impedes productivity improvement at the industry aggregate level.
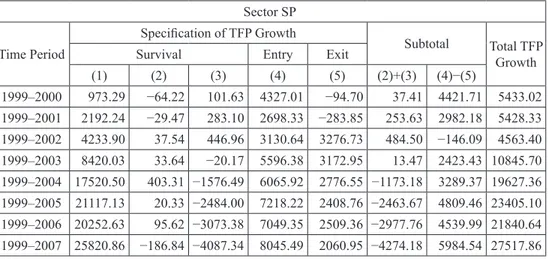
Table 5: Result of the decomposition of the aggregate productivity growth volume for the steel rolling and processing sector
Sector SP
Time Period
Speciication of TFP Growth
Subtotal Total TFP
Growth
Survival Entry Exit
(1) (2) (3) (4) (5) (2)+(3) (4)−(5)
1999–2000 973.29 −64.22 101.63 4327.01 −94.70 37.41 4421.71 5433.02
1999–2001 2192.24 −29.47 283.10 2698.33 −283.85 253.63 2982.18 5428.33
1999–2002 4233.90 37.54 446.96 3130.64 3276.73 484.50 −146.09 4563.40
1999–2003 8420.03 33.64 −20.17 5596.38 3172.95 13.47 2423.43 10845.70
1999–2004 17520.50 403.31 −1576.49 6065.92 2776.55 −1173.18 3289.37 19627.36
1999–2005 21117.13 20.33 −2484.00 7218.22 2408.76 −2463.67 4809.46 23405.10
1999–2006 20252.63 95.62 −3073.38 7049.35 2509.36 −2977.76 4539.99 21840.64
1999–2007 25820.86 −186.84 −4087.34 8045.49 2060.95 −4274.18 5984.54 27517.86
Table 5 reports the results of the decomposition of the growth volume of aggregate
TFP for the steel rolling and processing sector. Its overall situation is identical to
that of the iron smelting and steel smelting sectors; that is, productivity growth
of existing enterprises plays a major role in aggregate productivity growth, and market entries and exits are key contributors to the improvement of industry productivity. At the same time, cross-enterprise resource allocation eficiency for existing enterprises is worsening and impedes the productivity improvements at the aggregate industry level. Nevertheless, the mechanism for the TFP evolution of the
steel rolling and processing sector has its own characteristics. The deterioration in
the cross-enterprise allocation eficiency for existing enterprises is mainly derived
from Item (3); that is, the productivity growth of enterprises moves in the opposite
direction of the reduction of market share.
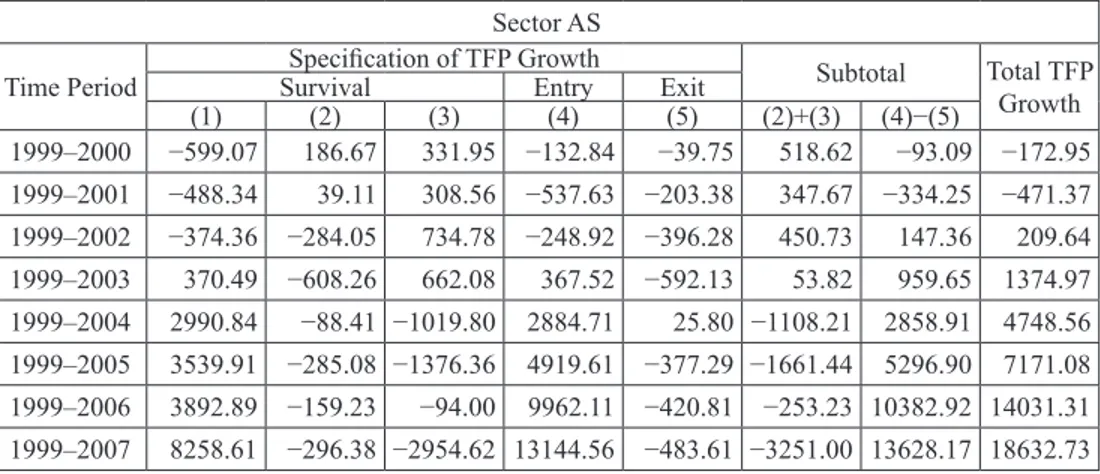
Table 6: Results of the decomposition of the aggregate productivity growth for the iron alloy smelting sector
Sector AS
Time Period Speciication of TFP Growth Subtotal Total TFP
Growth
Survival Entry Exit
(1) (2) (3) (4) (5) (2)+(3) (4)−(5)
1999–2000 −599.07 186.67 331.95 −132.84 −39.75 518.62 −93.09 −172.95
1999–2001 −488.34 39.11 308.56 −537.63 −203.38 347.67 −334.25 −471.37
1999–2002 −374.36 −284.05 734.78 −248.92 −396.28 450.73 147.36 209.64
1999–2003 370.49 −608.26 662.08 367.52 −592.13 53.82 959.65 1374.97
1999–2004 2990.84 −88.41 −1019.80 2884.71 25.80 −1108.21 2858.91 4748.56
1999–2005 3539.91 −285.08 −1376.36 4919.61 −377.29 −1661.44 5296.90 7171.08
1999–2006 3892.89 −159.23 −94.00 9962.11 −420.81 −253.23 10382.92 14031.31
1999–2007 8258.61 −296.38 −2954.62 13144.56 −483.61 −3251.00 13628.17 18632.73
Source: The materials are taken from the NBS
Table 6 reports the results of the decomposition of aggregate productivity growth for the iron alloy smelting sector. Its overall situation is somewhat different from that of the iron smelting, steel smelting and steel rolling, and processing sectors. That is, in
the iron alloy smelting sector, market entries and exits play a major role in the growth of aggregate productivity, while the productivity growth of existing enterprises is
the second most important contributor to the improvement of industry aggregate
productivity. The eficiency of cross-enterprise resource allocation for existing
enterprises also demonstrates a worsening tendency and impedes the improvement of productivity at the aggregate industry level. Nevertheless, similar to the steel rolling
318 Zb. rad. Ekon. fak. Rij. • 2015 • vol. 33 • sv. 2 • 299-324
5. Results and discussion
Considering the exhibition of entry-exit situation in China’s iron and steel industry, First of all, the four-digit sectors of China’s iron and steel industry demonstrate very high market entry and exit ratios Geroski (1991) found that the average
entry ratio of industrial sectors is only between 3.2% and 8.2% for sophisticated
market economies, and the exit ratio is slightly lower. The market entry and exit ratios of China’s iron and steel industry far exceed those of the industrial sectors in sophisticated market economies. Therefore, large-scale market entries and exits of enterprises occur with the limited market openness of the iron and steel industry and local government assistance for local irms to escape market access restrictions. Moreover, the attempt of the central government to adopt a relatively strict market entry policy failed to achieve its expected objectives. Secondly, non-state-owned capital has become a major driver of the market entry and exit of the iron and steel industry. The market entry and exit of an industry are mainly driven by non-state-owned capital, and the share of state-non-state-owned capital has been on a signiicant decline
over the years.
In cross-irm TFP growth and distribution analysis in Table 2, there are three characters explored: First, as described by the industrial evolution model of Hopenhayn (1992), substantial TFP differences exist among enterprises in each
year. Second, the minimum productivity level required for enterprises to remain
in the market may have increased over time, and that the cross-enterprise TFP
distribution demonstrates the tendency to move to the right. Moreover, more productive enterprises have achieved better growth. Third, productivity varies
greatly among irms, cross-enterprise resource allocation for the iron and steel industry is ineficient, and such ineficiency demonstrates the tendency of further deterioration. Instead of promoting the convergence of corporate TFP, market competition under limited market openness and government intervention exacerbated the corporate TFP differences.
According to the analysis of Table 3-6, TFP growth mechanism, the results show
that the decomposition of the aggregate productivity growth for the iron smelting sector, steel smelting sector, and steel rolling and processing sector are similar,
that is, the productivity growth of existing enterprises plays a major role in the aggregate productivity growth, and market entries and exits are key contributors to the improvement of industry productivity. At the same time, the eficiency of cross-enterprises resource allocation for existing cross-enterprises is worsening and impedes
productivity improvement at the industry aggregate level. There is a difference
in the iron alloy smelting sector, market entries and exits play a major role in the growth of aggregate productivity, while the productivity growth of existing
enterprises is the second most important contributor to the improvement of industry
sectors, which are the steel rolling and processing sector and iron alloy smelting sector, have their own characteristics, while the deterioration in the cross-enterprise
allocation eficiency for existing enterprises is mainly derived from Item (3); that
is, the productivity growth of enterprises moves in the opposite direction of the
reduction of market share.
On the whole, for the iron and steel industry, irst, productivity of existing
enterprises for the iron and steel industry has been rising rapidly and plays an
important role in the aggregate productivity growth. Second, market entries and exits are the major sources for the aggregate productivity growth after the weighting of the market share. The TFP of entrants are a major contributor to the growth of aggregate productivity, and enterprises with a relatively low TFP are driven out of the market. Cross-enterprise resource allocation eficiency deteriorates for existing enterprises. Enterprises with TFP below the aggregate productivity during the base period experience faster growth, and corporate productivity and market share do
not move in the same direction.
Based on the above results, the study has the following implications: Although
the central government has attempted to impose a relatively tight regulation
on the market entry of the iron and steel industry, local government protection
and assistance have made it easy for enterprises and investors to escape such a
regulation. As a result, large-scale corporate entries and exits occurred for the iron and steel industry during the reporting period of this paper. Tremendous eficiency gaps exist among enterprises in the iron and steel industry. This inding relects the ineficiency of cross-enterprise resource allocation for the iron and steel industry.
Differences in productivity among enterprises widened instead of narrowed during
the reporting period. This situation is another relection of further deterioration in the eficiency of cross-enterprise resource allocation for the iron and steel industry. Large-scale corporate entries and exits for the iron and steel industry have intensiied competition within the industry and signiicantly propelled the eficient improvement of existing iron and steel enterprises. The market entry of many relatively eficient new entrants in the iron and steel industry has driven out the less eficient manufacturers from the market. This process has greatly enhanced the overall eficiency of the iron and steel industry. Different from the standard theory, the eficiency of cross-enterprise resource allocation has failed to improve
and has continued to worsen and seriously impede the overall improvement of the
industry’s overall productivity, although the large-scale corporate entries and exits of China’s iron and steel industry have intensiied market competition.
China’s central government should relax its regulation of the iron and steel industry,
adjust the industrial policy that restricts competition to support large enterprises and eliminate smaller ones, introduce an industrial policy that promotes fair competition and put a premium on environmental protection, and restrain various subsidies
320 Zb. rad. Ekon. fak. Rij. • 2015 • vol. 33 • sv. 2 • 299-324
these measures, China’s central government can promote the fair competition of
the iron and steel industry, thus enabling the competition mechanism of the market based on “survival of the ittest,” facilitating the concentration of resources and market share in highly eficient enterprises, and expediting the improvement of resource allocation eficiency in the iron and steel industry. Moreover, China has
also retained many intervention and regulatory measures in various sectors of machinery, automobiles, basic metals, and chemical engineering, where local governments are enthusiastic to intervene. The Chinese government should create
an open, fair, and transparent environment for market competition at an early date to promote the eficient improvement of these sectors.
6. Conclusions
The results of the empirical analysis did not strongly support the hypothesis,
although the entry-exit promotes the growth of the aggregate productivity, the cross-enterprise resource allocation eficiency actually slows down aggregate
productivity growth. The results of this research are the productivity growth
of existing enterprises and entry–exit behaviors play an important role in the aggregate productivity growth, however, the eficiency of cross-enterprises resource allocation for existing enterprises is worsening and impedes productivity
improvement at the industry aggregate level. The main contribution of this research to the previous literature is, studied dynamics of productivity growth on the basis
of a limited market openness background. The previous researches are base on a free competition market background, but in China’s iron and steel industry, the government retained extensive intervention and regulation. The basic conclusion is that, with substantial government intervention in enterprise investments, market competition may not promote optimal resource allocation eficiency in China’s iron and steel industry, but will make the allocation less eficient.
The worsening eficiency in the dynamic cross-enterprise resource allocation for China’s iron and steel industry may have the following explanations. (1) In the iron
and steel industry, the Chinese government has introduced an industrial policy to
“support state-owned large iron and steel enterprises and restrict the development
of small- and medium-sized enterprises.” Moreover, the government has retained a multitude of policy measures of microeconomic intervention, including investment
regulation and market access. These policy measures have restricted the further development of many highly eficient private small- and medium-sized iron and steel enterprises but have fueled the development of many less eficient state-owned iron and steel enterprises, thus impeding the concentration of resources and markets in more eficient irms. (2) By offering cheap land and illegally relaxing environmental
regulation, local governments have protected and supported local iron and steel
the cost advantage and have further developed and prospered. This situation creates
an unfavorable effect on the development of more eficient enterprises.
Given data limitations, this study investigates China’s iron and steel industry between 1999 and 2007, which is a period of rapid development for this speciic industry. Nevertheless, growth in the market share of China’s iron and steel industry has signiicantly slowed in recent years. This study cannot relect the entry and exit, market competition, and TFP growth of China’s iron and steel industry in recent years as well as characteristics of the intrinsic correlation among them. Future studies may explore the following directions: (1) further extend the investigation
period to the recent couple of years on the basis of access to relevant data and
(2) extend the scope of investigation to the automobile, machinery, and chemical
engineering sectors in China.
The results of this paper suggest that the Chinese government should create an
open, fair and transparent environment for market competition as soon as practically possible to promote the eficient improvement of these sectors and restrain various
subsidies and preferential policies of local governments to local enterprises. In order to accelerate the growth of global economy, industry regulation should be reduced, fair competition should be protected and a premium put on environmental protection.
References
Baily, M. N., Hulten, C., and Campbell, D. (1992) “Productivity Dynamics in
Manufacturing Plants”, Brookings Papers: Microeconomics, Vol. 4, No 1, pp.
187–267, doi: 10.2307/2534764.
Barberá, L., Viveros, P., Nikulin C, et al. (2013) “Aplicación de métodos para la resolución de problemas en un caso industrial”, Dyna, Vol. 2013, No. 88, pp.
370–374.
Bartelsman, E., Haltiwanger, J., & Scarpetta, S. (2009) “Measuring and Analyzing Cross-country Differences in Firm Dynamics”, National Bureau of Economic Research, Inc., pp. 15–76, doi: 10.7208/chicago/9780226172576.003.0002.
Bendato, I., Cassettari, L., Mosca, M., Mosca, R., & Rolando, F. (2015). “New Markets Forecast and Dynamic Production Redesign Through Stochastic
Simulation”. International Journal of Simulation Modelling, Vol. 14, No. 3, pp.
485–498, doi: 10.2507/IJSIMM14(3)10.307.
Brandt, L., Van Biesebroeck, J., & Zhang, Y. (2012) “Creative Accounting or Creative Destruction? Firm-Level Productivity Growth in Chinese Manufacturing”, Journal of Development Economics, Vol. 97, No. 2, pp. 339–351, doi: 10.1016/j.
322 Zb. rad. Ekon. fak. Rij. • 2015 • vol. 33 • sv. 2 • 299-324 Disney, R., Haskel, J., & Heden, Y. (2003) “Entry, Exit and Establishment Survival
in UK Manufacturing”, The Journal of Industrial Economics, Vol. 51, No. 1,
pp. 91–112, doi: 10.1111/1467-6451.00193.
Foster, L., Haltiwanger, J., & Krizan, C. J. (2006) “Market Selection, Reallocation,
and Restructuring in the US Retail Trade Sector in the 1990s”, The Review of Economics and Statistics, Vol. 88, No. 4, pp. 748–758, doi: 10.1162/rest.88.4.748.
Geroski, P. A. (Ed.) (1991) “Entry and Market Contestability: An International
Comparison”. Blackwell., pp. 257–281.
Holmes, T. J., & Schmitz, J. A., (2010) “Competition and Productivity: a Review
of Evidence”, DIANE Publishing, Vol. 2, pp. 619–642, doi: 10.1146/annurev.
economics.102308.124407.
Hopenhayn, H. A. (1992) “Entry, Exit, and Firm Dynamics in Long Run
Equilibrium”, Econometrica: Journal of the Econometric Society, Vol. 60, No. 5,
pp. 1127–1150, doi: 10.2307/2951541.
Hsieh, C. T., and Klenow, P. (2009) “Misallocation and Manufacturing TFP in
China and India.” Quarterly Journal of Economics, Vol. 124, No 4, pp. 1403–
1448, doi: 10.3386/w13290.
Jiang, F., and Li, X. (2010) “Direct Market Intervention and Restrict Competition: The Orientation of China’s Industrial Policy and Its Fundamental Defects”,
China Industrial Economics, Vol. 270, No. 9, pp. 26–36.
Levinshohn, J., and Petrin, A. (2003) “Estimating Production Functions Using
Inputs to Control for Unobservables”, Review of Economic Studies, Vol. 70, No.
2, pp. 317–341, doi: 10.1111/1467-937X.00246.
Li, P., Jian, Z. & Jiang, F. (2012) “Entry-exit, Competition and the Productivity of
China’s Industry”, Journal of Quantitative & Technical Economics, Vol. 2012,
No 9, pp. 3–21.
Li, Y., Wang, H., and Zheng, Y. (2008) “Enterprise Evolution: Important Path of Industrial TFP Growth in China”, Economic Research Journal, Vol. 2008, No.
6, pp. 12–24.
Liu, X., and Li, S. (2008) “Measurement, Comparison and Exogenous Determinants of the Relative Eficiency of China’s Manufacturing Enterprises (2000–2004)”,
China Economic Quarterly, Vol. 7, No. 3, pp. 843–868.
Luo, Y., and Xia, D. (2002) “The Theoretical Basis of the Existence of Excessive Competition in a Market Economy”, Economic Science, Vol. 2002, No. 4, pp.
97–108.
McMillan J. and Naughton, B. (1992) “How to Reform a Planned Economy: Lessons from China”, Oxford Review of Economic Policy, Vol. 8, No. 1, pp. 130–143, doi: 10.1093/oxrep/8.1.130.
Naughton, B. (1992) “Implications of the State Monopoly over Industry and Its Relaxation”, Modern China, Vol. 18, No. 1, pp. 14–41, doi:
Nickell, S. J. (1996) “Competition and Corporate Performance”, Journal of Political Economy, Vol. 104, No. 4, pp. 724–746, doi: 10.1086/262040.
Olley, G. S., and Pakes, A. (1996) “The Dynamics of Productivity in the
Telecommunications Equipment Industry”, Econometrica, Vol. 64, No. 6, pp.
1263–1297, doi: 10.2307/2171831.
Perkins, D. H. (2002) “The Challenge China’s Economy Poses for Chinese
Economists”, China Economic Review, Vol. 13, No. 4, pp. 412–418, doi:
10.1016/S1043-951X(02)00099-8.
Syverson, C. (2004) “Market Structure and Productivity: A Concrete Example”.
Journal of Political Economy, Vol. 112, No. 6, pp. 1181–1222, doi: 10.1086/424743.
Syverson, C., (2011). “What Determines Productivity?”, Journal of Economic Literature, Vol. 49, No. 2, pp. 326–365, doi: 10.1257/jel.49.2.326.
The World Bank and the State Council Development Research Centre (2013) “China in 2030”, China Finance and Economics Press, pp. 25–33.
Vickers, J. (1995) “Competition and regulation in vertically related markets”, The Review of Economic Studies, Vol. 62, No. 1, pp. 1–17, doi: 10.2307/2297839.
Wei, H. (2003) “Market Competition, Performance and Industrial Concentration”,
Economic Science Press, p. 231.
324 Zb. rad. Ekon. fak. Rij. • 2015 • vol. 33 • sv. 2 • 299-324
Industrijski propisi, konkurencija i dinamika rasta proizvodnje na primjeru
kineske industrije željeza i čelika
1Jianbai Huang2, Chuan Liu3,Daguo Lü4, Xiaoping Li5
Sažetak
Ova studija ima za cilj ispitati karakteristike učinkovitog razvoja kineske industrije željeza i čelika u okolnostima ograničene otvorenosti i regulacije, te raspraviti važne učinke regulatorne politike i ukupnih čimbenika produktivnosti (TFP) kineske industrije željeza i čelika. Primijenjena metoda je Cobb-Douglasova proizvodna funkcija u kombinaciji s polu-parametarskom metodom razgradnje produktivnosti. Ova studija,temeljena na mikrorazini skupa podataka o proizvodnji željeza i čelika baze podataka kineskih industrijskih poduzeća željeza i čelika u periodu između 1998. i 2007. godine, istražila je unutarnju povezanost korporativnog ulaza i izlaza, tržišnog natjecanja postojećih poduzeća i rasta ukupnih čimbenika produktivnosti (TFP) u industriji željeza i čelika. Rezultati istraživanja pokazuju da ulaz-izlaz potiče rast agregatne produktivnosti, dok niska učinkovitost raspodjele resursa značajno inhibira rast ukupnih čimbenika produktivnosti (TFP). Osnovni zaključak je da, uz znatnu intervenciju države u investicije poduzeća, tržišno natjecanje ne smije promovirati optimalnu učinkovitost raspodjele resursa u kineskoj industriji željeza i čelika, ali utječe na manju učinkovitost raspodjele resursa.
Ključne riječi: dinamika produktivnosti, industrijski propisi, tržišno natjecanje, Kina
JEL klasiikacija:L52
1 Ovaj projekt proveden je uz inancijsku potporu Nacionalne prirodoslovne zaklade Kine (The
Na-tional Natural Science Foundation of China; Grant br.71373283) i Ključnog projekta Nacionalne zaklade društvenih znanosti Kine (Key Project of National Social Science Foundation of China; Grant br. 13&ZD024), a ovaj rad uz potporu dr. Fetao-a Jianga, Prof. Ze Jina i Dr. Franka Gaoa.
2 Redoviti profesor, Business School, Central South University, Changsha, 410083, China.
Znanstveni interes: industrijske strategije, eksperimentalna ekonomija. Tel.: +86 13 873 120 588. E-mail: jbhuang@csu.edu.cn.
3 Redoviti profesor, Business school, Central South University, Changsha, 410083, China. Znanstveni
interes: industrijska politika, ekonomika industrije. Tel.: +86 1 3974 808 838. E-mail: cliu1914@ foxmail.com.
4 Doktor znanosti, Institute of Industrial Economics, Jiangxi University of Finance Economics,
Nanchang, 330013, China. Znanstveni interes: industrial organization, industrial economics, regional economics. Tel.: +86 1 3851 995 041. E-mail: peterlv1979@126.com.
5 Izvanredni profesor, Business School, Central South University, Changsha, 410083, Kina.