published online 24 October 2012
Proc. R. Soc. B
Tom A. Williams, Peter G. Foster, Tom M. W. Nye, Cymon J. Cox and T. Martin Embley
the Archaea
A congruent phylogenomic signal places eukaryotes within
Supplementary data
tml http://rspb.royalsocietypublishing.org/content/suppl/2012/10/18/rspb.2012.1795.DC1.h "Data Supplement"References
-urls http://rspb.royalsocietypublishing.org/content/early/2012/10/18/rspb.2012.1795.full.html#related Article cited in:ml#ref-list-1
http://rspb.royalsocietypublishing.org/content/early/2012/10/18/rspb.2012.1795.full.ht This article cites 56 articles, 35 of which can be accessed free
P<P
Published online 24 October 2012 in advance of the print journal.This article is free to access
Subject collections
(190 articles) taxonomy and systematics
(1785 articles) evolution (27 articles) bioinformatics
Articles on similar topics can be found in the following collections
Email alerting service
right-hand corner of the article or click Receive free email alerts when new articles cite this article - sign up in the box at the topherepublication.
Citations to Advance online articles must include the digital object identifier (DOIs) and date of initial
online articles are citable and establish publication priority; they are indexed by PubMed from initial publication.
the paper journal (edited, typeset versions may be posted when available prior to final publication). Advance
Advance online articles have been peer reviewed and accepted for publication but have not yet appeared in
http://rspb.royalsocietypublishing.org/subscriptions
go to: Proc. R. Soc. B To subscribe to
A congruent phylogenomic signal places
eukaryotes within the Archaea
Tom A. Williams
1, Peter G. Foster
2, Tom M. W. Nye
3,
Cymon J. Cox
4and T. Martin Embley
1,*
1
Institute for Cell and Molecular Biosciences, University of Newcastle, Newcastle upon Tyne NE2 4HH, UK
2
Department of Life Sciences, Natural History Museum, London SW7 5BD, UK
3
School of Mathematics and Statistics, University of Newcastle, Newcastle upon Tyne NE1 7RU, UK
4
Centro de Cieˆncias do Mar, Universidade do Algarve, Campus de Gambelas, 8005-139 Faro, Portugal Determining the relationships among the major groups of cellular life is important for understanding the evolution of biological diversity, but is difficult given the enormous time spans involved. In the textbook ‘three domains’ tree based on informational genes, eukaryotes and Archaea share a common ancestor to the exclusion of Bacteria. However, some phylogenetic analyses of the same data have placed eukaryotes within the Archaea, as the nearest relatives of different archaeal lineages. We compared the support for these competing hypotheses using sophisticated phylogenetic methods and an improved sampling of archaeal biodiversity. We also employed both new and existing tests of phylogenetic congruence to explore the level of uncertainty and conflict in the data. Our analyses suggested that much of the observed incongruence is weakly supported or associated with poorly fitting evolutionary models. All of our phylogenetic analyses, whether on small subunit and large subunit ribosomal RNA or concatenated protein-coding genes, recovered a monophyletic group containing eukaryotes and the TACK archaeal superphylum comprising the Thau-marchaeota, Aigarchaeota, Crenarchaeota and Korarchaeota. Hence, while our results provide no support for the iconic three-domain tree of life, they are consistent with an extended eocyte hypothesis whereby vital components of the eukaryotic nuclear lineage originated from within the archaeal radiation.
Keywords: phylogenetics; eukaryotes; evolution; tree of life
1. INTRODUCTION
The early evolution of eukaryotes remains a fascinating and poorly understood period in the history of life. Eukaryotic cell structure is remote from that of Archaea and Bacteria, with features such as the nucleus, endomembrane system and associated organelles that have no obvious prokaryotic homologues [1]. As a result, hypotheses on eukaryotic origins have been motivated by comparisons of the small number of homologous gene sequences, particularly those of ribosomal RNA (rRNA) and protein-coding genes involved in nucleic acid replication, transcription and translation—the so-called ‘informational genes’ or ‘functional core of genomes’—that are conserved between eukaryotes, Archaea and Bacteria [2–9]. The rooted three-domains tree of life [2,9], in which the eukaryotic nuclear lineage is the sister group to a monophyletic Archaea comprising two major groups, the Euryarchaeota and Crenarchaeota, is probably the dominant paradigm for eukaryotic origins and it appears in many textbooks. However, other published phylogenies have suggested that eukaryotes emerged from within an already diversified archaeal radiation as the sister group to one of the several extant archaeal lineages [5,6,8,10,11]. The best known of these hypotheses is probably the eocyte hypothesis [5,6,10,12], which places eukaryotes as the sister group of the Crenarchaeota, a group also known as the eocytes.
Taxon sampling is one of the most important determi-nants of accurate phylogenetic estimation [13,14], and past attempts to resolve the origin of eukaryotes have been hindered by the relatively poor sampling of Archaea by genome sequencing. However, the discovery that uncultured Archaea play major roles in global nutrient cycles [15] has led to a number of sequence-based environmental surveys, which have improved sampling of Archaeal lineages. Recently discovered groups include the Thaumarchaeota [16], Aigarchaeota [17] and Korarchaeota [18]. Phylogenetic analyses suggest that all of these groups are more closely related to the Crenarchaeota than to the Euryarchaeota. Accordingly the name ‘TACK superphylum’ was recently proposed [19] to contain the Thaumarchaeota, Aigarchaeota, Crenarchaeota and Korarchaeota.
Although a consensus is emerging on the monophyly of the TACK superphylum [5,19,20], the relationships among its constituent lineages, and the relationship of the group as a whole to eukaryotes, remain unclear. Robust phylogenetic support for an origin for eukaryotes within, or as a sister group to, a characterized archaeal clade would be extremely exciting, because features shared between eukaryotes and extant archaeal members could inform a reconstruction of the ancestral eukaryote and provide insights into the early stages of eukaryotic evolution. The first author to draw a link between eukar-yotes and any member of the TACK superphylum was Lake [7,10], whose eocyte hypothesis proposed a sister-group relationship between eukaryotes and the few Crenarchaeotes, or eocytes, which were known at that
* Author for correspondence ([email protected]).
Electronic supplementary material is available at http://dx.doi.org/
10.1098/rspb.2012.1795or viahttp://rspb.royalsocietypublishing.org.
Proc. R. Soc. B doi:10.1098/rspb.2012.1795 Published online
Received 16 August 2012
time; this relationship was also recovered by Cox et al. [6]. More recent phylogenetic analyses with extended taxo-nomic samplings have united eukaryotes with a clade comprising the Crenarchaeota plus Thaumarchaeota [5], with the Thaumarchaeota alone [21], or as part of an unresolved eukaryotes plus TACK supergroup [19]. All of these topologies are consistent with an eocyte hypothesis broadened in scope to include the newly discovered lineages. By contrast, a supertree analysis of single-copy protein families found in Bacteria, Archaea including Crenarchaeota, and eukaryotes, was interpreted to reject the eocyte hypothesis in favour of alternative hypotheses whereby eukaryotes emerge from within the Euryarchaeota [22,23]. Yet another analysis [24] has suggested that archaeal genes in eukaryotes derive from an ancient, probably extinct and in any case unknown, archaeal lineage.
As well as sparse taxon sampling, phylogenetic ana-lyses attempting to infer ancient relationships face difficulties in the identification of reliable and infor-mative phylogenetic markers. In addition to rRNA, empirical and simulation studies suggest that slow-evolving protein sequences conserved between Bacteria, Archaea and eukaryotes should also contain useful phylo-genetic information [5]. However, individual proteins often resolve ancient divergences only weakly, leading to the practice of concatenating multiple alignments to increase statistical power. Since phylogenetic methods assume that these concatenated alignments evolve under a single topology, any horizontal gene transfers affecting the genes in the concatenation could lead to systematic phylogenetic error [25]. Horizontal transfer is now recog-nized as a frequent and important process in the evolution of all life forms [26], and failure to explicitly deal with its effects in inter-domain datasets could lead to a significant error in the inference of the relationship between Archaea and eukaryotes. At the same time, current phylogenetic methods will not necessarily recover correct or consistent relationships, even when all of the genes being analysed evolved on the same tree [27]. This is because lack of fit between the sequence data and the evolutionary model used can lead to systematic topological error. The use of appropriate evolutionary models is important in reducing the effects of phylogenetic artefacts such as long-branch attraction (LBA) [28,29], especially in the case of ancient relationships for which the phylogenetic signal may be weak.
Here, we have compared the support for current hypotheses of the relationship between Archaea and eukaryotes from rRNA and protein datasets representing the informational genes [2–9]. We included an expanded sampling of the emerging TACK superphylum of Archaea and used formal tests of topological congruence [30,31] to identify and characterize the distinct phylogenetic signals present in our alignments of conserved protein-coding genes. Posterior predictive simulations [32] were used to assess the fit of several different evolutionary models to our datasets, and the effect of model fit on inferred levels of phylogenetic incongruence was investi-gated by analysing sets of distances between trees. Our analyses consistently support the monophyly of eukary-otic informational genes with the TACK superphylum, but do not confidently identify the nearest neighbour of eukaryotes within this group. By contrast, we find
no support for a euryarchaeal origin for eukaryotes or for the three-domains tree. With improved archaeal sampling, trees consistent with a broadly defined eocyte hypothesis are recovered both with standard and with more complex evolutionary models and for all subsets of data.
2. RESULTS AND DISCUSSION
(a)The effect of new archaeal sequences on ribosomal RNA trees
Historically, rRNA has been the pre-eminent molecular marker for studies of ancient evolutionary events, and con-flicting topologies inferred from rRNA genes have driven much of the debate on the deep structure of the universal tree [2,7]. In previous analyses [5,6,8,11,33], support from rRNA genes for the three-domains or eocyte hypotheses depended on the substitution model used: the simpler models generally gave a three-domains tree, whereas the more complex ones—for example, the node-discrete rate and composition heterogeneity (NDRHþ NDCH) and CAT models [5]—gave an eocyte tree. These differences have been interpreted in terms of model fit, with the NDRHþ NDCH and CAT models, for example, accounting for properties of the sequence alignment that are poorly anticipated by single-matrix models such as the general time reversible (GTR) model. In particular, site-specific selective constraints are not explicitly modelled by GTR, which assumes that the probability of change between any two nucleotides is the same at any site in the alignment. By contrast, comparisons of real sequence data strongly suggest that the phenotypic effect of a par-ticular substitution, and therefore the evolutionary rate, depends on the function and biochemical context of the site [34]. Poor modelling of this substitution process makes GTR vulnerable to LBA, a well-characterized phylogenetic artefact in which parallel (convergent) substi-tutions along long branches of the phylogeny are misinterpreted as synapomorphies, causing these branches to group together [29,35]. A number of authors [6,8,11] have previously suggested that archaeal monophyly, and hence the three-domains tree, was the result of an attrac-tion between the very long branches leading to the bacteria and eukaryotes. Interestingly, the CAT model, which models site-specific substitution rates with per-site frequency profiles and is reported to deal with LBA more efficiently [28], recovered a topology consistent with the eocyte hypothesis [5].
To investigate the effect of new Thaumarchaeota, Aigarchaeota and Korarchaeota sequences on resolution of the deep branches of the tree of life, we built align-ments of the large subunit (LSU) and small subunit (SSU) rRNA genes from 36 species of Bacteria, Archaea and eukaryotes. These alignments were based on those of Foster et al. [5] but were updated to reflect the recent improvement in sampling of free-living microbial eukar-yotes (Naegleria gruberi ) and TACK superphylum members (Korarchaeum cryptofilum and Caldiarchaeum subterraneum). The phylogenetic signal in the LSU and SSU alignments was determined to be congruent by two complementary methods [30,31], enabling us to con-catenate them for further analysis. We used RAxML v. 7.2.8 [36] to build a maximum likelihood bootstrap tree for the combined LSUþ SSU alignment, optimizing Proc. R. Soc. B
a GTR model separately on each partition as indicated by jMODELTEST [37]. We also built Bayesian phylogenetic
trees under the GTR and CAT models in PHYLOBAYES,
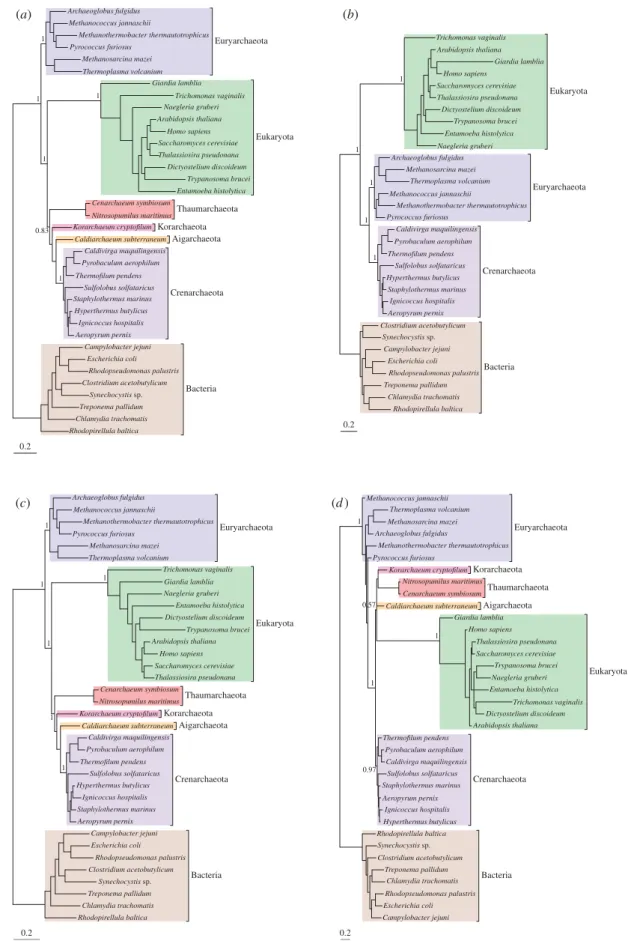
and the NDRHþ NDCH model in p4. In the following discussions of the relationships between eukaryotes and Archaea, we have, like others [2,9], taken the root of the universal tree to be either within, or on the branch leading to, the Bacteria [38–40]. This position remains tentative (see [6] for discussion), but the three-domains and eocyte-like trees are actually incompatible wherever the root lies. As in previous work [5], our analyses using the better-fitting NDRHþ NDCH and CAT models (figure 1c,d ) recovered an eocyte topology. However, in contrast to previous results [5], our analyses also recov-ered a strongly supported eocyte topology with the GTR model (figure 1a).
Our failure to obtain a three-domains tree, even with the data-homogeneous (non-mixture) GTR model, was surprising given previous results, so we performed several phylogenetic experiments to investigate the cause. First, we used posterior predictive simulations [32] to evaluate the fit of the GTR, NDRHþ NDCH and CAT models to the rRNA dataset (see the electronic supplementary material, table S1). These tests indicated that the GTR model is a poor fit to the dataset with respect to base com-position and site-specific biochemical diversity. The more complex models were each able to account for some, but not all, of the features of the rRNA alignment. Thus, the CAT model was much better than GTR at modelling the site-specific features of the substitution process, but it failed to account for the compositional heterogeneity pre-sent in the data. Fit with respect to composition was achieved with the NDRHþ NDCH model, which allows composition to vary over the tree [41]. These results are similar to those reported previously, where the NDRHþ NDCH and CAT models outperformed the single-matrix GTR model for model fit [5], and they suggest that the newfound support from GTR for an eocyte-like topology is not the result of improved model fit with the updated rRNA alignment.
Since we had used a conservative masking protocol
(GBLOCKS with the default parameters) in constructing
our original alignment, we investigated whether proper-ties of the alignment had influenced the result. We used an alternative alignment masking protocol (the ‘automa-ted1’ option in TRIMAl [42]) that retained substantially
more sites (2227 versus 1184 positions), and reanalysed our data using the same methods as previously. All three models recovered an eocyte topology from this alignment (see the electronic supplementary material, figure S1). Removal of the Thaumarchaeota, Aigarch-aeota and KorarchAigarch-aeota sequences, however, produced a three-domains tree under the GTR model (figure 1b), although an eocyte topology was still recovered under the better fitting NDRHþ NDCH and CAT models (electronic supplementary material, figure S1). These results suggest that increased sampling of divergent members of the TACK group improved resolution of the inner nodes of the tree of life, leading to the recovery of an eocyte tree even with the simpler model of nucleotide substitution.
Although trees inferred using all three models pro-duced eocyte topologies (i.e. in which the TACK sequences clustered with eukaryotes to the exclusion of
the Euryarchaeota), they also displayed significant topolo-gical differences among major archaeal groups (figure 1). For example, in the GTR and NDRHþ NDCH trees, the Euryarchaeota are monophyletic with maximum sup-port, whereas in the CAT tree they were paraphyletic, also with maximum support. To increase the number of char-acters brought to bear on these questions we turned our attention to conserved protein-coding genes.
(b)Support from conserved protein-coding genes for hypotheses of eukaryotic origins
We assembled two protein datasets: a set of 29 proteins conserved across Bacteria, Archaea and eukaryotes (29BAE), in order to compare support for the three-domains versus the eocyte hypotheses for eukaryotic genes; and a larger set of 64 genes conserved in our sample of Archaea and eukaryotes (64AE) for investigating the in-group relationships between the eukaryotes and specific archaeal lineages. These conserved genes (see the electronic supplementary material, tables S2 and S3) are mainly involved in information processing (DNA replica-tion, transcription and translation), and includes those that have been called the ‘genealogy-defining core’ of cellu-lar life forms [43] or the ‘functional core of genomes’ [9]. It has been suggested that these genes may be more resistant to horizontal gene transfer (HGT) than the rest of the genome because their gene products have complex cellular interactions [44,45]. Nonetheless, information-processing genes are not immune to HGT [46], and as the number of markers that are concatenated to build a phylogeny increases, so too does the probability that at least some of them will be affected by HGT. Since phylogenetic methods assume a single underlying topology, concatenation of genes with different evolutionary histories could potentially result in serious systematic error [47]. To account for these difficulties, we used two complementary methods to test the congruence of these information-processing genes: CONCATERPILLAR [31] and CONCLUSTADOR [30].
Interestingly, the two methods disagreed on the level of incongruence in our protein datasets: CONCLUSTADOR,
which uses spectral clustering of Euclidean distances to define sets of topologically similar trees, inferred a single congruent set from each of the 29BAE and 64AE datasets, whereas CONCATERPILLAR, which implements a hierarchical
likelihood ratio test, inferred a number of congruent sub-sets (five in 29BAE and 15 in 64AE) in each case. To characterize the range of phylogenetic signals identified in our protein datasets, we built trees for each set of genes inferred to be congruent by either of the methods. In the case of the 64AE dataset, we also obtained strong evidence from a third approach (see below) that one of the genes was incongruent; this gene was removed from the complete concatenation, resulting in a 63AE dataset. Each congru-ent set was analysed as a single partition using the CAT family of phylogenetic models [34,48]. We used the full CAT model for concatenates that were over 1000 amino acids in length, and the CAT20 model for those that were shorter. CAT20 is a variant of the more flexible CAT model that contains an empirical profile mixture of 20 com-ponents inferred from the homology-derived structures of proteins alignment database, analogous to the empirical substitution matrices in standard models such as LG. It is optimized for use on smaller alignments, where CAT may perform poorly [48]. Phylogenies inferred from the Evolution of eukaryotes from Archaea T. A. Williams et al. 3
Bacteria Euryarchaeota Korarchaeota Crenarchaeota Aigarchaeota Thaumarchaeota Eukaryota Archaeoglobus fulgidus Methanococcus jannaschii Methanothermobacter thermautotrophicus Pyrococcus furiosus Methanosarcina mazei Thermoplasma volcanium Giardia lamblia Trichomonas vaginalis Naegleria gruberi Arabidopsis thaliana Homo sapiens Saccharomyces cerevisiae Thalassiosira pseudonana Dictyostelium discoideum Trypanosoma brucei Entamoeba histolytica Cenarchaeum symbiosum Nitrosopumilus maritimus Korarchaeum cryptofilum Caldiarchaeum subterraneum Caldivirga maquilingensis Pyrobaculum aerophilum Thermofilum pendens Sulfolobus solfataricus Staphylothermus marinus Hyperthermus butylicus Ignicoccus hospitalis Aeropyrum pernix Campylobacter jejuni Escherichia coli Rhodopseudomonas palustris Clostridium acetobutylicum Synechocystis sp. Treponema pallidum Chlamydia trachomatis Rhodopirellula baltica 1 1 1 1 0.83 1 0.2 (a) Bacteria Euryarchaeota Crenarchaeota Eukaryota Trichomonas vaginalis Arabidopsis thaliana Giardia lamblia Homo sapiens Saccharomyces cerevisiae Thalassiosira pseudonana Dictyostelium discoideum Trypanosoma brucei Entamoeba histolytica Naegleria gruberi Archaeoglobus fulgidus Methanosarcina mazei Thermoplasma volcanium Methanococcus jannaschii Methanothermobacter thermautotrophicus Pyrococcus furiosus Caldivirga maquilingensis Pyrobaculum aerophilum Thermofilum pendens Sulfolobus solfataricus Hyperthermus butylicus Staphylothermus marinus Ignicoccus hospitalis Aeropyrum pernix Clostridium acetobutylicum Synechocystis sp. Campylobacter jejuni Escherichia coli Rhodopseudomonas palustris Treponema pallidum Chlamydia trachomatis Rhodopirellula baltica 1 1 1 1 1 0.2 (b) Bacteria Euryarchaeota Korarchaeota Crenarchaeota Aigarchaeota Thaumarchaeota Eukaryota Archaeoglobus fulgidus Methanococcus jannaschii Methanothermobacter thermautotrophicus Pyrococcus furiosus Methanosarcina mazei Thermoplasma volcanium Trichomonas vaginalis Giardia lamblia Naegleria gruberi Entamoeba histolytica Dictyostelium discoideum Trypanosoma brucei Arabidopsis thaliana Homo sapiens Saccharomyces cerevisiae Thalassiosira pseudonana Cenarchaeum symbiosum Nitrosopumilus maritimus Korarchaeum cryptofilum Caldiarchaeum subterraneum Caldivirga maquilingensis Pyrobaculum aerophilum Thermofilum pendens Sulfolobus solfataricus Hyperthermus butylicus Ignicoccus hospitalis Staphylothermus marinus Aeropyrum pernix Campylobacter jejuni Escherichia coli Rhodopseudomonas palustris Clostridium acetobutylicum Synechocystis sp. Treponema pallidum Chlamydia trachomatis Rhodopirellula baltica 1 1 1 1 1 1 0.2 (c) Bacteria Euryarchaeota Korarchaeota Crenarchaeota Aigarchaeota Thaumarchaeota Eukaryota Methanococcus jannaschii Thermoplasma volcanium Methanosarcina mazei Archaeoglobus fulgidus Methanothermobacter thermautotrophicus Pyrococcus furiosus Korarchaeum cryptofilum Nitrosopumilus maritimus Cenarchaeum symbiosum Caldiarchaeum subterraneum Giardia lamblia Homo sapiens Thalassiosira pseudonana Saccharomyces cerevisiae Trypanosoma brucei Naegleria gruberi Entamoeba histolytica Trichomonas vaginalis Dictyostelium discoideum Arabidopsis thaliana Thermofilum pendens Pyrobaculum aerophilum Caldivirga maquilingensis Sulfolobus solfataricus Staphylothermus marinus Aeropyrum pernix Ignicoccus hospitalis Hyperthermus butylicus Rhodopirellula baltica Synechocystis sp. Clostridium acetobutylicum Treponema pallidum Chlamydia trachomatis Rhodopseudomonas palustris Escherichia coli Campylobacter jejuni 1 1 0.57 1 0.97 0.2 (d )
Figure 1. Phylogenies of Bacteria, Archaea and eukaryotes inferred from concatenated rRNA. (a) A Bayesian phylogeny of Bac-teria, Archaea and eukaryotes inferred under the GTR model, showing an eocyte-like topology in which eukaryotes emerge from within the Archaea with maximal support (posterior probability (PP) ¼ 1). (b) Removal of recently characterized archaeal groups (the Thaumarchaeota, Aigarchaeota and Korarchaeota) converts this tree into a canonical three-domains topology, again with maximal support (PP ¼ 1), indicating that sampling plays an important role in the resolution of these ancient relationships. Analyses of the full dataset using the better-fitting NDRHþ NDCH (c) and CAT (d) models recover maximally supported eocyte-like topologies; these models also recover eocyte-like topologies on the reduced dataset, without the TAK sequences (see the electronic supplementary material, figure S1). Branch lengths are proportional to substitutions per site.
complete datasets are presented in figure 2; phylogenies inferred from the CONCATERPILLAR-derived congruent
subsets are provided in the electronic supplementary material, figures S2 and S3. The support from all these analyses for current hypotheses on eukaryotic origins is summarized in the electronic supplementary material, tables S4 and S5.
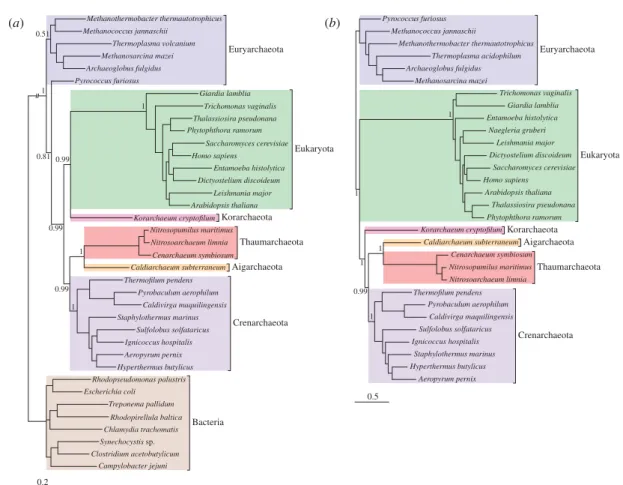
Our analyses including bacterial outgroups consist-ently supported the monophyly of eukaryotes with the TACK superphylum of Archaea, to the exclusion of the euryarchaeotes, although the strength of support for this eocyte-like hypothesis varied with the subset of the data analysed (seefigure 2and the electronic supplemen-tary material, tables S4 and S5). By contrast, we found no support for the three-domains hypothesis and the mono-phyly of Archaea from any of these analyses. While the monophyly of eukaryotes and the TACK superphylum was consistently recovered, the specific relationships within this clade were more ambiguous. The phylogeny inferred from the 63AE dataset recovered eukaryotes and the TACK superphylum as separate clusters (figure 2b); in contrast, the 29BAE dataset and the two largest
CONCATERPILLAR-derived congruent subsets inferred
from the 64AE dataset supported the nesting of the eukaryotes within the TACK superphylum, either as
the neighbour of Korarchaeum or with the relationship unresolved (seefigure 2a and the electronic supplemen-tary material, tables S4 and S5). Given the sparse sampling of Korarchaeota and their relatives, and the long branch leading to eukaryotes, this finding must be treated with caution [14]. In particular, when the bac-terial sequences were removed from the 29BAE dataset and the analyses were repeated, the relationship between eukaryotes, Korarchaeum and the rest of the TACK super-phylum collapsed to a trichotomy, suggesting that the Korarchaeum/eukaryote link is not strongly supported (see the electronic supplementary material, figure S6). Further Korarchaeal genome sequences are likely to be very informative about this part of the tree of life. It is interest-ing to note that we consistently recovered a strongly supported Thaumarchaeota/Aigarchaeota clade within the TACK group, confirming the relationship between these groups [20] and suggesting that they do not represent the earliest-diverging archaeal lineage [16,49]; in our trees, the eukaryotes and the TACK superphylum consist-ently form a monophyletic group to the exclusion of euryarchaeotes (figure 2, electronic supplementary material, figure S2).
With the exception of Korarchaeum, our analyses did not provide support for a specific relationship between any
Bacteria Euryarchaeota Korarchaeota Crenarchaeota Aigarchaeota Thaumarchaeota Eukaryota Methanothermobacter thermautotrophicus Methanococcus jannaschii Thermoplasma volcanium Methanosarcina mazei Archaeoglobus fulgidus Pyrococcus furiosus Giardia lamblia Trichomonas vaginalis Thalassiosira pseudonana Phytophthora ramorum Saccharomyces cerevisiae Homo sapiens Entamoeba histolytica Dictyostelium discoideum Leishmania major Arabidopsis thaliana Korarchaeum cryptofilum Nitrosopumilus maritimus Nitrosoarchaeum limnia Cenarchaeum symbiosum Caldiarchaeum subterraneum Thermofilum pendens Pyrobaculum aerophilum Caldivirga maquilingensis Staphylothermus marinus Sulfolobus solfataricus Ignicoccus hospitalis Aeropyrum pernix Hyperthermus butylicus Rhodopseudomonas palustris Escherichia coli Treponema pallidum Rhodopirellula baltica Chlamydia trachomatis Synechocystis sp. Clostridium acetobutylicum Campylobacter jejuni 1 0.51 0.81 0.99 0.99 1 0.99 1 1 0.2 (a) Euryarchaeota Korarchaeota Crenarchaeota Aigarchaeota Thaumarchaeota Eukaryota Pyrococcus furiosus Methanococcus jannaschii Methanothermobacter thermautotrophicus Thermoplasma acidophilum Archaeoglobus fulgidus Methanosarcina mazei Trichomonas vaginalis Giardia lamblia Entamoeba histolytica Naegleria gruberi Leishmania major Dictyostelium discoideum Saccharomyces cerevisiae Homo sapiens Arabidopsis thaliana Thalassiosira pseudonana Phytophthora ramorum Korarchaeum cryptofilum Caldiarchaeum subterraneum Cenarchaeum symbiosum Nitrosopumilus maritimus Nitrosoarchaeum limnia Thermofilum pendens Pyrobaculum aerophilum Caldivirga maquilingensis Sulfolobus solfataricus Ignicoccus hospitalis Staphylothermus marinus Hyperthermus butylicus Aeropyrum pernix 1 1 1 0.99 1 1 0.5 (b)
Figure 2. Phylogenies of Bacteria, Archaea and eukaryotes inferred from conserved protein-coding genes. (a) A phylogeny inferred from 29 concatenated proteins conserved between Bacteria, Archaea and eukaryotes. An eocyte topology was recov-ered with strong (PP ¼ 0.99) support. In this phylogeny, the eukaryotes emerge as the sister group of Korarchaeum, nested with the TACK superphylum. (b) A phylogeny inferred from 63 concatenated proteins shared between Archaea and eukaryotes. The position of the root is not explicitly indicated. However, based on the result from (a) and the electronic supplementary material, table S4, it is likely to be either within, or on the branch leading to, the Euryarchaea. If this position is correct, then the tree shows the eukaryotes emerging as the sister group to the TACK superphylum, including Korarchaeum. These trees were inferred using the CAT model in PHYLOBAYES. Branch lengths are proportional to substitutions per site, except the truncated
bacterial branch in (a).
Evolution of eukaryotes from Archaea T. A. Williams et al. 5
members of the TACK superphylum and eukaryotes. In particular, we found no strong support for a specific relationship between the Thaumarchaeota and the eukar-yotes, as has recently been suggested [21] (see the electronic supplementary material, table S5). Further, our results were not compatible with a sister-group relationship [22] between the eukaryotes and the Thermo-plasmatales, a group of euryarchaeotes. In our trees, Thermoplasma consistently grouped within the euryarch-aeotes, with no significant support from any analysis for a Thermoplasma/eukaryote clade (see the electronic sup-plementary material, table S5). To determine the reason for this disagreement, we compared our 64-gene dataset with that originally used to suggest the Thermoplasma link [22]. Of the 5741 protein families examined in that study, 41 contained both a member of the Thermoplasma-tales and at least one eukaryote; the support for a Thermoplasma/eukaryote link comes from 12 of these families in which the eukaryotes and Thermoplasmatales form a clade. Only one of these 12 protein families (Cbf5, encoding an rRNA pseudouridine synthase) was included in our 64-gene dataset; the others were not included in our analyses because of their patchy distri-bution across eukaryotes and Archaea. In the case of Cbf5, our single-gene phylogeny did not recover a Thermoplasma/eukaryote relationship (see the electronic supplementary material, figure S5), and it was only weakly supported (21% maximum likelihood bootstrap value) in the published tree [22]. In the eight cases where more than a single eukaryotic sequence was included in a protein family, we built new phylogenetic trees, adding in orthologous sequences from the TACK genomes that have been sequenced since 2007 (see the electronic sup-plementary material, table S6). We recovered a weakly supported Thermoplasma/eukaryote relationship in three trees: those based on a tRNA pseudouridine synthase (posterior probability (PP) ¼ 0.79), a wbutosine synthesis protein (PP ¼ 0.72) and an RNA-binding protein (PP ¼ 0.53); see the electronic supplementary material, figure S5. In the tree built from the wbutosine synthesis protein, the Thermoplasmatales clustered outside of the euryarch-aeal radiation (PP ¼ 0.99), with their closest neighbours being the Crenarchaeote Thermofilum pendens and the Aigarchaeote Caldiarchaeum subterraneum. Since the Thermoplasmatales are generally recovered within the Eur-yarchaea (seefigure 2of this paper, or [20]), their position in this tree is unusual, making it unlikely that we can draw strong inferences from these data. In summary, our analyses of concatenated proteins and re-analyses of single-gene trees found no compelling support for a specific role for Thermoplasma in eukaryotic origins.
(c)The effect of evolutionary model on inferred levels of phylogenetic incongruence
The distinct phylogenetic signals we identified in our protein datasets could have resulted from genuinely different gene histories (HGT) or from phylogenetic error. Current evolutionary models make assumptions about the data, such as homogeneity of the substitu-tion process across sites, or of composisubstitu-tion across the tree, that are often violated, potentially leading to topolo-gical error. The variable position of Korarchaeum in our analyses may reflect these issues. When analysing
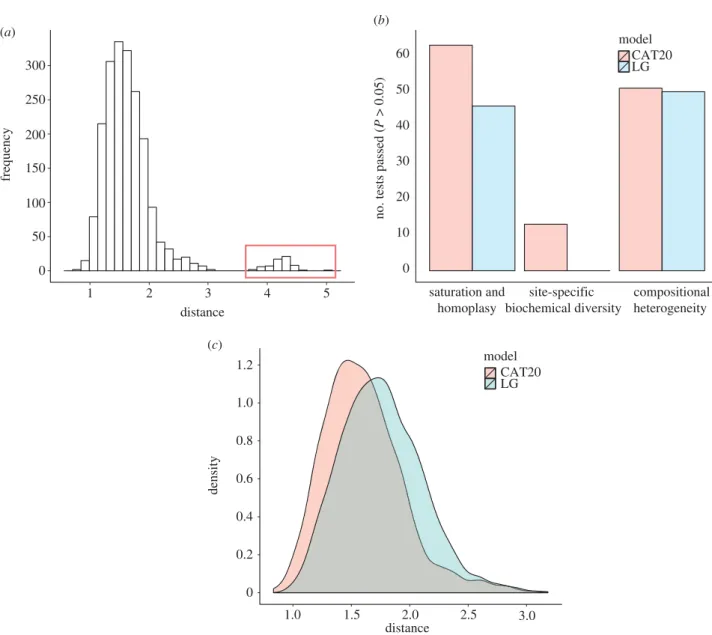
different datasets (seefigure 2and the electronic supple-mentary material, table S5) or using different phylogenetic models (see the electronic supplementary material, figure S6), Korarchaeum was either recovered as the closest archaeal relative of eukaryotes or as an early-diverging member of the TACK superphylum. Furthermore, there were no apparent patterns in the functions or identities of protein complexes represented by the different congruent subsets of genes supporting one placement or another (see the electronic supplemen-tary material, tables S7 and S8). For example, individual components of the large and small ribosomal subunits were found in different congruent sets. These results suggested that at least some of the incongruence in our protein datasets was because of phylogenetic artefacts. If this is the case, then the choice of evolutionary model should affect inferred levels of incongruence, because cur-rent models vary in their sensitivity to systematic phylogenetic error [28]. To evaluate this possibility, we developed a method for comparing levels of incongruence under different evolutionary models that uses distributions of geodesic distances [50] between trees (seefigure 3and the electronic supplementary material). These distances provide a continuous measure in tree space that incor-porates differences in both branch lengths and tree topologies. We inferred gene trees for each gene in the 64AE dataset using LG, which was the best-fitting single-matrix model in each case, and CAT20 which, as discussed above, is an empirical variant of the CAT model which is more suitable for short single-gene alignments. For each model, we calculated all pairwise geodesic distances between trees. Although we calculated these distances in order to compare different models, the distance distri-butions under each model already contain some useful information about congruence. For these 64 genes, the dis-tributions had a marked hump in the tail (figure 3a) corresponding to a single, clearly incongruent gene tree (see the electronic supplementary material, figure S7); we removed this tree from subsequent analyses, resulting in the 63AE dataset. Interestingly, the trees inferred from the 64- and 63-gene concatenations were topologically identical, suggesting that—at least in this case—small amounts of incongruent data are overpowered by the domi-nant signal in large concatenations. Comparisons of model fit using posterior predictive simulations indicated that CAT20 was a better-fitting model than LG for the individ-ual genes comprising the 63AE dataset (figure 3b), as has previously been observed on large samples of saturated amino acid alignments [48]. The mean squared geodesic distance between trees inferred under CAT20 was signifi-cantly lower than that inferred under LG (2.68 versus 3.22; p, 0.0001;figure 3c), suggesting that trees inferred under the better-fitting model were more congruent. This result suggests that a significant portion of the incongruence in the dataset can be attributed to model misspecification, as opposed to genuinely discordant evolutionary histories. It will be interesting to evaluate whether this result also applies to larger-scale, less strictly filtered datasets. In the present case, disagreement among the larger congru-ent subsets was associated with the placemcongru-ent of Korarchaeum, with broad support for an eocyte-like, rather than a three-domains tree from the majority of genes and subsets (see the electronic supplementary material, tables S4 and S5).
3. CONCLUSIONS
Under the three-domains hypothesis, important com-ponents of the eukaryotic genetic machinery were vertically inherited from a common ancestor shared with Archaea, and this relationship is taken to explain the shared properties of both groups. In an eocyte-like scenario, those same eukaryotic components were verti-cally inherited from an ancestor that was already an archaeon, and the phylogenetic position of this ancestor could be particularly informative about the genetic and metabolic context of early eukaryotic evolution and for
theories of eukaryotic origins [1]. Here, we have com-pared support for these hypotheses and others, using conserved components of the genetic machinery. With an updated sampling of archaeal diversity, we found no support for the three-domains hypothesis either from rRNA or protein-coding genes under any phylogenetic model. Instead, we detected a congruent phylogenetic signal that placed essential informational genes of the eukaryotic nuclear lineage within the archaeal radiation, sharing common ancestry with the TACK superphylum. The monophyly of eukaryotic genes with the TACK
distance
frequency
1 2 3 4 5
no. tests passed (
P > 0.05) saturation and homoplasy site-specific biochemical diversity compositional heterogeneity 0 10 20 30 40 50 60 model CAT20 LG (b) 0 50 100 150 200 250 300 (a) 1.0 1.5 2.0 2.5 3.0 density model CAT20 LG 0 0.2 0.4 0.6 0.8 1.0 1.2 (c) distance
Figure 3. Analysing incongruence using a novel measure of distance between gene trees. We used distributions of pairwise geo-desic distances between gene trees to compare levels of incongruence inferred under different evolutionary models. (a) The distribution of distances under a single model (CAT20) can be used to identify obvious outliers corresponding to highly incon-gruent gene trees; a single gene was responsible for the peak highlighted in red, and was removed from subsequent analyses. (b) Overview of model-fitting tests (posterior predictive simulations) for each gene in the 64AE dataset. The height of the bars indicates the proportion of genes that ‘passed’ a test under a particular model; we said that a test was passed when the value of the test statistic on the real data fell within the central 95% of the distribution of values produced by posterior predictive simu-lation. The results suggest that CAT20 fits better than LG, successfully accounting for the observed levels of saturation and homoplasy in all but one of the alignments. Both models do a poor job of modelling the site-specific selective constraints in our dataset, although again CAT20 performs better than LG (13 passes as opposed to 0). (c) Comparison of the distance dis-tributions inferred under the CAT20 and LG models. The trees inferred under the better-fitting CAT20 model are significantly more congruent than those inferred under LG (mean distance: 2.68 versus 3.22, p, 0.0001). The significance of this differ-ence was assessed using a permutation test that took the correlations between pairwise distances into account (see §4). These results suggest that a significant portion of the incongruence in this dataset of informational genes can be attributed to model misspecification, rather than genuinely distinct evolutionary histories.
Evolution of eukaryotes from Archaea T. A. Williams et al. 7
superphylum was consistently recovered but the specific relationships within this clade were not decisively resolved; in particular, we did not recover a sister-group relationship between the Thaumarchaeota and the eukar-yotes, as recently proposed [21]. As such, we cannot discriminate between an origin for eukaryotic genes from within the TACK superphylum [19], or from a sister-group lineage. In contrast to a recent supertree study [22], we did not find any support for a role for Ther-moplasma in eukaryotic origins. Intriguingly, members of the TACK superphylum encode homologues of genes that were previously thought to be eukaryote-specific, such as actin [51], the Cdv cell division machinery [52] and a ubiquitin protein modification system [17], although no single characterized TACK genome pos-sesses all of these features. Although these genes have a patchy distribution in extant TACK genomes, it has been suggested that they could potentially have co-occurred in the ancestor of the clade [19], a scenario sup-ported by evidence for extensive reductive evolution in the Archaea [53]. The recent report of a eukaryote-type tubulin in Nitrosoarchaeum [54] is particularly exciting because it implies that both actin [55] and tubulin might have already been present in an archaeal ancestor of eukaryotes. Thus, not only the core genetic machinery, but also core components of the eukaryotic cytoskele-ton could have been inherited from a relative of the TACK Archaea.
4. MATERIAL AND METHODS
(a)Sequences and alignments
The rRNA and 29BAE protein alignments were based on those of Foster et al. [5], but updated with the relevant sequences from Naegleria gruberi, Korarchaeum cryptophilum, Caldiarchaeum subterraneum and Nitrosoarchaeum limnia. Sequences were aligned with META-COFFEE, and poorly aligning regions were
identified are removed using GBLOCKSor TRIMAl, as described in the main text. To prepare the 64AE alignments, we per-formed clustering of the proteomes with the Markov Cluster algorithm of the selected taxa, and built maximum likelihood trees from the initial clusters to identify single-copy orthologues which were used for phylogenetic analysis. Further details of the sequence selection and alignment protocol are provided in the electronic supplementary material.
(b)Congruence tests
We used CONCATERPILLAR v. 1.5 [31] and CONCLUSTADOR
v. 0.1a [30] to test whether our single-gene alignments were congruent before concatenating them for phylogenetic analysis. In cases where these two methods disagreed, we built phylogenies for all of the congruent sets inferred by both methods and compared the results. To complement and expand upon these approaches, we developed a novel method for analysing the level of incongruence in a set of genes and for comparing incongruence between sets of trees inferred under different models using geodesic distan-ces; this method is described in detail in the electronic supplementary material.
(c)Phylogenetics
Best-fitting substitution models were chosen for the rRNA alignments using jMODELTEST [37]. For the protein
align-ments, single-matrix substitution models were chosen using the ProteinModelSelection script available from the RAxML
website (http://www.exelixis-lab.org/). Maximum likelihood calculations were performed with RAxML v. 7.2.8 [36]. Bayesian Markov Chain Monte Carlo analyses were performed using the p4 ( http://code.google.com/p/p4-phylogenetics/; Foster [41]) and PHYLOBAYES v. 3.3 [56] packages, which implement the range of more complex models used in our analyses. Convergence was assessed by comparing the results from independent runs, and model fit in the Bayesian analyses was evaluated using posterior predictive simulations [32]. Further details of the models and simulations used are provided in the electronic supplementary material.
We thank Davide Pisani for providing the trees and sequence alignments supporting a Thermoplasma/eukaryote link, and Jessica Leigh for advice on using CONCATERPILLAR and
CONCLUSTADOR. This work was supported by a Marie Curie
postdoctoral fellowship to T.A.W. (http://cordis.europa.eu/fp7/ home_en.html). T.M.E. acknowledges support from the European Research Council Advanced Investigator Programme.
REFERENCES
1 Embley, T. M. & Martin, W. 2006 Eukaryotic evolution, changes and challenges. Nature 440, 623 – 630. (doi:10. 1038/nature04546)
2 Woese, C. R., Kandler, O. & Wheelis, M. L. 1990 Towards a natural system of organisms: proposal for the domains Archaea, Bacteria, and Eucarya. Proc. Natl Acad. Sci. USA 87, 4576 – 4579. (doi:10.1073/pnas.87.12.4576) 3 Harris, J. K., Kelley, S. T., Spiegelman, G. B. & Pace,
N. R. 2003 The genetic core of the universal ancestor. Genome Res. 13, 407 – 412. (doi:10.1101/gr.652803) 4 Ciccarelli, F. D., Doerks, T., von Mering, C., Creevey,
C. J., Snel, B. & Bork, P. 2006 Toward automatic recon-struction of a highly resolved tree of life. Science 311, 1283 – 1287. (doi:10.1126/science.1123061)
5 Foster, P. G., Cox, C. J. & Embley, T. M. 2009 The primary divisions of life: a phylogenomic approach employing com-position-heterogeneous methods. Phil. Trans. R. Soc. B 364, 2197–2207. (doi:10.1098/rstb.2009.0034)
6 Cox, C. J., Foster, P. G., Hirt, R. P., Harris, S. R. & Embley, T. M. 2008 The archaebacterial origin of eukar-yotes. Proc. Natl Acad. Sci. USA 105, 20 356 – 20 361. (doi:10.1073/pnas.0810647105)
7 Lake, J. A. 1988 Origin of the eukaryotic nucleus deter-mined by rate-invariant analysis of rRNA sequences. Nature 331, 184 – 186. (doi:10.1038/331184a0)
8 Tourasse, N. J. & Gouy, M. 1999 Accounting for evol-utionary rate variation among sequence sites consistently changes universal phylogenies deduced from rRNA and protein-coding genes. Mol. Phylogenet. Evol. 13, 159 – 168. (doi:10.1006/mpev.1999.0675)
9 Pace, N. R. 2006 Time for a change. Nature 441, 289. (doi:10.1038/441289a)
10 Lake, J. A., Henderson, E., Oakes, M. & Clark, M. W. 1984 Eocytes: a new ribosome structure indicates a kingdom with a close relationship to eukaryotes. Proc. Natl Acad. Sci. USA 81, 3786 – 3790. (doi:10.1073/ pnas.81.12.3786)
11 Katoh, K., Kuma, K. & Miyata, T. 2001 Genetic algor-ithm-based maximum-likelihood analysis for molecular phylogeny. J. Mol. Evol. 53, 477 – 484. (doi:10.1007/ s002390010238)
12 Rivera, M. C. & Lake, J. A. 1992 Evidence that eukar-yotes and eocyte prokareukar-yotes are immediate relatives. Science 257, 74 – 76. (doi:10.1126/science.1621096) 13 Heath, T. A., Zwickl, D. J., Kim, J. & Hillis, D. M.
2008 Taxon sampling affects inferences of
macroevolutionary processes from phylogenetic trees. Syst. Biol. 57, 160 – 166. (doi:10.1080/106351507 01884640)
14 Graybeal, A. 1998 Is it better to add taxa or characters to a difficult phylogenetic problem? Syst. Biol. 47, 9 – 17. (doi:10.1080/106351598260996)
15 Pester, M., Schleper, C. & Wagner, M. 2011 The Thaumarchaeota: an emerging view of their phylogeny and ecophysiology. Curr. Opin. Microbiol. 14, 300 – 306. (doi:10.1016/j.mib.2011.04.007)
16 Brochier-Armanet, C., Boussau, B., Gribaldo, S. & Forterre, P. 2008 Mesophilic Crenarchaeota: proposal for a third archaeal phylum, the Thaumarchaeota. Nat. Rev. Microbiol. 6, 245 – 252. (doi:10.1038/nrmicro1852) 17 Nunoura, T. et al. 2011 Insights into the evolution
of Archaea and eukaryotic protein modifier systems revealed by the genome of a novel archaeal group. Nucleic Acids Res. 39, 3204 – 3223. (doi:10.1093/nar/ gkq1228)
18 Elkins, J. G. et al. 2008 A korarchaeal genome reveals insights into the evolution of the Archaea. Proc. Natl Acad. Sci. USA 105, 8102 – 8107. (doi:10.1073/pnas. 0801980105).
19 Guy, L. & Ettema, T. J. 2011 The archaeal ‘TACK’ super-phylum and the origin of eukaryotes. Trends Microbiol. 19, 580 – 587. (doi:10.1016/j.tim.2011.09.002).
20 Brochier-Armanet, C., Forterre, P. & Gribaldo, S. 2011 Phylogeny and evolution of the Archaea: one hundred genomes later. Curr. Opin. Microbiol. 14, 274 – 281. (doi:10.1016/j.mib.2011.04.015)
21 Kelly, S., Wickstead, B. & Gull, K. 2011 Archaeal phyloge-nomics provides evidence in support of a methanogenic origin of the Archaea and a thaumarchaeal origin for the eukaryotes. Proc. R. Soc. B 278, 1009– 1018. (doi:10. 1098/rspb.2010.1427)
22 Pisani, D., Cotton, J. A. & McInerney, J. O. 2007 Super-trees disentangle the chimerical origin of eukaryotic genomes. Mol. Biol. Evol. 24, 1752 – 1760. (doi:10. 1093/molbev/msm095)
23 Hixon, W. G. & Searcy, D. G. 1993 Cytoskeleton in the archaebacterium Thermoplasma acidophilum? Viscosity increase in soluble extracts. Biosystems 29, 151 – 160. (doi:10.1016/0303-2647(93)90091-P)
24 Yutin, N., Makarova, K. S., Mekhedov, S. L., Wolf, Y. I. & Koonin, E. V. 2008 The deep archaeal roots of eukaryo-tes. Mol. Biol. Evol. 25, 1619– 1630. (doi:10.1093/ molbev/msn108)
25 Philippe, H., Brinkmann, H., Lavrov, D. V., Littlewood, D. T., Manuel, M., Worheide, G. & Baurain, D. 2011 Resolving difficult phylogenetic questions: why more sequences are not enough. PLoS Biol. 9, e1000602. (doi:10.1371/journal.pbio.1000602)
26 Keeling, P. J. & Palmer, J. D. 2008 Horizontal gene trans-fer in eukaryotic evolution. Nat. Rev. Genet. 9, 605 – 618. (doi:10.1038/nrg2386)
27 Huelsenbeck, J. P. & Bull, J. J. 1996 A likelihood ratio test to detect conflicting phylogenetic signal. Syst. Biol. 45, 92 – 98. (doi:10.1093/sysbio/45.1.92)
28 Lartillot, N., Brinkmann, H. & Philippe, H. 2007 Sup-pression of long-branch attraction artefacts in the animal phylogeny using a site-heterogeneous model. BMC Evol. Biol. 7(Suppl. 1), S4. ( doi:10.1186/1471-2148-7-S1-S4)
29 Philippe, H. 2000 Opinion: long branch attraction and protist phylogeny. Protist 151, 307 – 316. (doi:10.1078/ S1434-4610(04)70029-2)
30 Leigh, J. W., Schliep, K., Lopez, P. & Bapteste, E. 2011 Let them fall where they may: congruence analysis in massive phylogenetically messy data sets. Mol. Biol. Evol. 28, 2773 – 2785. (doi:10.1093/molbev/msr110)
31 Leigh, J. W., Susko, E., Baumgartner, M. & Roger, A. J. 2008 Testing congruence in phylogenomic analysis. Syst. Biol. 57, 104 – 115. (doi:10.1080/10635150801910436) 32 Bollback, J. P. 2002 Bayesian model adequacy and choice
in phylogenetics. Mol. Biol. Evol. 19, 1171 – 1180. (doi:10.1093/oxfordjournals.molbev.a004175)
33 Yang, Z. & Roberts, D. 1995 On the use of nucleic acid sequences to infer early branchings in the tree of life. Mol. Biol. Evol. 12, 451 – 458.
34 Lartillot, N. & Philippe, H. 2004 A Bayesian mixture model for across-site heterogeneities in the amino-acid replacement process. Mol. Biol. Evol. 21, 1095 – 1109. (doi:10.1093/molbev/msh112)
35 Felsenstein, J. 1978 Cases in which parsimony or com-patibility methods will be positively misleading. Syst. Zool. 27, 401 – 410. (doi:10.2307/2412923)
36 Stamatakis, A. 2006 RAxML-VI-HPC: maximum likeli-hood-based phylogenetic analyses with thousands of taxa and mixed models. Bioinformatics 22, 2688 – 2690. (doi:10.1093/bioinformatics/btl446)
37 Posada, D. 2008 jMODELTEST: phylogenetic model aver-aging. Mol. Biol. Evol. 25, 1253 – 1256. (doi:10.1093/ molbev/msn083)
38 Baldauf, S. L., Palmer, J. D. & Doolittle, W. F. 1996 The root of the universal tree and the origin of eukaryotes based on elongation factor phylogeny. Proc. Natl Acad. Sci. USA 93, 7749 – 7754. (doi:10.1073/pnas.93.15.7749) 39 Skophammer, R. G., Servin, J. A., Herbold, C. W. & Lake, J. A. 2007 Evidence for a gram-positive, eubacterial root of the tree of life. Mol. Biol. Evol. 24, 1761 – 1768. (doi:10.1093/molbev/msm096)
40 Cavalier-Smith, T. 2006 Rooting the tree of life by transition analyses. Biol. Direct. 1, 19. (doi:10.1186/ 1745-6150-1-19)
41 Foster, P. G. 2004 Modeling compositional heterogen-eity. Syst. Biol. 53, 485 – 495. (doi:10.1080/10635150 490445779)
42 Capella-Gutierrez, S., Silla-Martinez, J. M. & Gabaldon, T. 2009 TRIMAl: a tool for automated alignment trimming
in large-scale phylogenetic analyses. Bioinformatics 25, 1972–1973. (doi:10.1093/bioinformatics/btp348) 43 Woese, C. R. 2002 On the evolution of cells. Proc.
Natl Acad. Sci. USA 99, 8742 – 8747. (doi:10.1073/ pnas.132266999)
44 Jain, R., Rivera, M. C. & Lake, J. A. 1999 Horizontal gene transfer among genomes: the complexity hypothesis. Proc. Natl Acad. Sci. USA 96, 3801 – 3806. (doi:10.1073/ pnas.96.7.3801)
45 Abby, S. S., Tannier, E., Gouy, M. & Daubin, V. 2012 Lateral gene transfer as a support for the tree of life. Proc. Natl Acad. Sci. USA 109, 4962 – 4967. (doi:10. 1073/pnas.1116871109)
46 Brochier, C., Philippe, H. & Moreira, D. 2000 The evol-utionary history of ribosomal protein RpS14: horizontal gene transfer at the heart of the ribosome. Trends Genet. 16, 529 – 533. (doi:10.1016/S0168-9525(00)02142-9) 47 Beiko, R. G., Doolittle, W. F. & Charlebois, R. L.
2008 The impact of reticulate evolution on genome phylogeny. Syst. Biol. 57, 844 – 856. (doi:10.1080/ 10635150802559265)
48 Quang le, S., Gascuel, O. & Lartillot, N. 2008 Empirical profile mixture models for phylogenetic reconstruction. Bioinformatics 24, 2317 – 2323. (doi:10.1093/bioinfor matics/btn445)
49 Spang, A. et al. 2010 Distinct gene set in two different lineages of ammonia-oxidizing archaea supports the phylum Thaumarchaeota. Trends Microbiol. 18, 331 – 340. (doi:10.1016/j.tim.2010.06.003)
50 Owen, M. & Provan, J. S. 2010 A fast algorithm for computing geodesic distances in tree space. IEEE/
Evolution of eukaryotes from Archaea T. A. Williams et al. 9
ACM Trans. Comp. Biol. Bioinf. 8, 2 – 13. (doi:10.1109/ TCBB.2010.3)
51 Makarova, K. S., Yutin, N., Bell, S. D. & Koonin, E. V. 2010 Evolution of diverse cell division and vesicle for-mation systems in Archaea. Nat. Rev. Microbiol. 8, 731 – 741. (doi:10.1038/nrmicro2406)
52 Lindas, A. C., Karlsson, E. A., Lindgren, M. T., Ettema, T. J. & Bernander, R. 2008 A unique cell division machinery in the Archaea. Proc. Natl Acad. Sci. USA 105, 18 942 – 18 946. (doi:10.1073/pnas.0809467105). 53 Csuros, M. & Miklos, I. 2009 Streamlining and
large ancestral genomes in Archaea inferred with a
phylogenetic birth-and-death model. Mol. Biol. Evol. 26, 2087 – 2095. (doi:10.1093/molbev/msp123)
54 Yutin, N. & Koonin, E. V. 2012 Archaeal origin of tubu-lin. Biol. Direct. 7, 10. (doi:10.1186/1745-6150-7-10) 55 Ettema, T. J., Lindas, A. C. & Bernander, R. 2011
An actin-based cytoskeleton in Archaea. Mol. Micro-biol. 80, 1052 – 1061. (doi:10.1111/j.1365-2958.2011. 07635.x)
56 Lartillot, N., Lepage, T. & Blanquart, S. 2009 P
HYLO-BAYES 3: a Bayesian software package for phylogenetic
reconstruction and molecular dating. Bioinformatics 25, 2286 – 2288. (doi:10.1093/bioinformatics/btp368)