29 Official Journal of FIMS (International Federation of Sports Medicine)
ISMJ
International
SportMed
Journal
Original research article
100m and 200m front crawl performance prediction based on
anthropometric and physiological measurements
1 2
*Dr Victor Machado Reis, PhD,
1 2Dr António José Silva, PhD,
2 3Dr André Luiz
Carneiro, PhD,
2 4Dr Daniel Almeida Marinho, PhD,
1Mr Giovanni Silva Novaes.
MSc,
2 5Dr Tiago Manuel Barbosa, PhD
1
Department of Sport Sciences, Exercise and Health, University of Trás-os-Montes and Alto Douro (UTAD), Portugal
2
Research Centre in Sport, Health and Human Development (CIDESD); Vila Real; Portugal
3
State University at Montes Claros (UNIMONTES), Montes Claros, Brazil
4
Department of Sport Sciences, University of Beira Interior (UBI), Covilhã, Portugal
5
Department of Sport Sciences, Polytechnic Institute of Bragança (IPB), Bragança, Portugal
Abstract
Background:The identification of the variables that are able to predict swimming performance is one of the main purposes of the “swimming science” community. Research question:The aims of the study were: (i) to compare the anthropometric and physiological profiles of 100m and 200m front crawl swimmers and; (ii) to identify anthropometric and physiological variables that account for the prediction of the swimming performance at the 100m and 200m front crawl events. Methods:Twenty-six male swimmers were divided in two groups (12 for 100m group and 14 to 200m group). The swimmers’ personal best performance for the 100m and the 200m front crawl was converted to FINA points. The subjects performed a graded swimming test and an all-out test (100 or 200m maximal swims) in different days, in which physiological measures were evaluated. Forward step-by-step linear regression models were computed to predict swimming performance. The subjects’ performances (season best and all-out test) were taken as dependent variables. The age, physiological and anthropometric measures were selected as independent variables. Results: Anthropometric and physiological profiles of 100 and 200m swimmers are different and the mean oxygen uptake during exercise combined with training experience may explain 200m front crawl best season performance with a high precision (≈2% error). The models computed were able to predict from 44 % (i.e. 200m all-out ball-out) to 61 % (i.e. 200m season best) swimming performance. Predictive power of the models was less accurate in the 100m event (error > 10%). Conclusions: The authors conclude that the extent to which the physiological and anthropometric variables combine to predict performance probable is group-specific.
Keywords
: competitive swimming, front crawl, prediction, performance, energetic, anthropometrics*Dr Victor Machado Reis, PhD
Victor Machado Reis is a lecturer of Exercise Physiology in the Department of Sport, Exercise and Health of the University of Trás-os-Montes and Alto Douro (UTAD - Portugal) and a researcher in the Research Centre in Sports, Health and Human Development (CIDESD – Portugal). He holds a PhD degree in Sport Sciences (Exercise Physiology) and his major research interest is related to
physiological testing, especially the assessment of energy expenditure and the estimation of energy cost.
Dr António José Silva, PhD
30 Official Journal of FIMS (International Federation of Sports Medicine)
Centre in Sports, Health and Human Development (CIDESD – Portugal). He holds a PhD degree in Sport Sciences (Applied Biomechanics) and his major interests of research are the physiological and biomechanical indicators of energy cost during physical activities, namely in swimming.
Email:
Dr André Luiz Carneiro, PhD
André Carneiro is a Lecturer of Exercise Physiology in the Department of Education in the State University of Montes Claros (Unimontes - Brazil). He holds a PhD degree in Sport Sciences (Exercise Physiology) and his major interests of research is related to physiological testing, especially the assessment of energy expenditure and the estimation of energy cost.
Email:
Dr Daniel Almeida Marinho, PhD
Daniel Almeida Marinho is a Lecturer of Swimming and Training Methods in the Department of Sport Sciences of the University of Beira Interior (UBI – Portugal) researcher in the Research Centre in Sports, Health and Human Development (CIDESD – Portugal). He holds a PhD in Sports Sciences (Applied Biomechanics) and his major research interests are the biomechanical and physiological determinant factors of sports performance, especially swimming performance.
Email:
Mr Giovanni Silva Novaes, MSc
Giovanni Novaes is a Sports Sciences doctoral student in the Department of Sport, Exercise and Health of the University of Trás-os-Montes and Alto Douro (UTAD - Portugal). He holds an MSc degree in Physical Education and his major research interests are the functional and biochemical adaptation to exercise.
Email:
Dr Tiago Manuel Barbosa, PhD
Tiago Manuel Barbosa is a Lecturer of Aquatic Activities in the Department of Sport Sciences of the Polytechnic Institute of Bragança (IPB – Portugal) and researcher in the Research Centre in Sports, Health and Human Development (CIDESD – Portugal). He holds a PhD in Sports Sciences (Applied Biomechanics) and his major research interests are the biomechanical and physiological determinant factors of sports performance.
Email:
Introduction
The identification of the variables that are able to predict swimming performance is one of the main purposes of the “swimming science” community 1. Swimming performance is related, on a regular basis, to the
anthropometric and physiological variables, and several original research and review papers reported such interplay between the swimming performance and the swimmer’s physiological and/or anthropometric profiles 2,
3
. Indeed the physiological and the
anthropometric evaluations are some of the most assessed domains in the last decades within the “swimming science” 4, 5.
Swimming performance has been related to maximal total energy release and energy cost
6-8
. In addition, the energy cost of swimming has been found to correlate negatively with performance 9, 10. From a physiological point of
view, swimming performance is strongly dependent on aerobic and anaerobic
parameters 11. Several authors have reported that peak oxygen uptake (VO2) was the best
31 Official Journal of FIMS (International Federation of Sports Medicine)
Many studies show that swimming performance is also influenced by
anthropometrics 21. Elite swimmers are taller, with broad shoulders and narrow hips,
compared to the normal population and to sub-elite swimmers 21. Arm span was also reported as being relavent to swimming performance and certain biomechanical variables 22. The lean body mass is also related to swimming 23.
Freestyle swimming events represent most of the races available in swimming competitions. Moreover, the front crawl is the fastest
swimming technique and the one used largely in freestyle events. Within these events, the 100m and the 200m distances are the ones for which the highest number of swimmers
regularly register in a competition. Hence much attention has been given to these freestyle events and to the front crawl technique. Some studies have described the physiological and/or anthropometric profile of the 100m and of the 200m front crawl specialists 11, 18, 24, 25. But, to the best of these authors’ knowledge, little effort has been made to compare them. The only exception was a similar research project conducted on breaststroke events 26.
There are several approaches to predicting swimming performance3: (i) comparing different cohort groups; (ii) computing statistical models; (iii) developing neural networks and; (iv) by performing cluster analysis. For this research, cohort groups and statistical models were used. The use of cohort groups aims to compare selected variables among subjects with different characteristics. Statistical models allow the identification of the best predictors of swimming performance for a given condition. Much research on swimming performance is done based on the comparison of groups at different competitive levels 27, 28. Several manuscripts have also been published on the use of statistics 29, 30. However, few of them have tried to predict swimming
performance based on the anthropometric and the physiological profiles. In addition, those few papers paid very little attention to the
anaerobic energy fraction of the total energy expenditure and, therefore, to swimming performance. A single example is the paper by Reis et al. 26 which looked at the breaststroke technique.
The aims of the present study were to: (i) to compare the anthropometric and physiological profiles of 100m and 200m front crawl
swimmers and; (ii) to identify anthropometric
and physiological variables that account for the prediction of swimming performance in the 100m and 200m front crawl. It was
hypothesised that the factors explaining the performances would be different under the two swimming conditions (i.e. during an all-out bout with a snorkel and the season best
performance in the competitive context).
Methods
Participants
Twenty-six male swimmers ranging from regional to international level volunteered for the study and after medical approval gave their informed consent to participate in the present study. Twelve swimmers were included in the prediction of the 100m front crawl performance and fourteen in the prediction of the 200m front crawl performance. Swimmers were included in a given event prediction model based on their best performance in each swim race. All the procedures were approved by the
Institution Ethics Committee and were in accordance with the Helsinki Declaration.
Testing
The experimental testing was conducted in the 1st month of the 2nd macro cycle of the season (after the transition period post-winter
competitive season) in a short course swimming pool. During the five days prior to testing, the swimmers were not allowed to be engaged in any high-intensity training
sessions. The subjects performed several assessments on separate days, with a 24-hour recovery: (i) a graded and intermittent
swimming test plus an anthropometric assessment and; (ii) an all-out swimming test plus a performance assessment. All
assessments were conducted in the morning (between 10h00 and 12h00) controlling for the circadian effect and in an environmental temperature of 25-28ºC and a humidity of 50-60 %.
Performance assessment
Swimming best performance (in s and in FINA 2004 points) was assessed by time lists for the 100m or 200m front crawl event of official short course competitions of regional, national or international level at the moment of the data collection (± 2 months).
32 Official Journal of FIMS (International Federation of Sports Medicine)
2004 points were selected to present the data as it is the only way to be able to compare performance across different swimming events.
Anthropometric assessment
A stadiometer (SECA, 242, Hamburg, Germany) was used for the evaluation of height (in m). A standard scale weighing machine (SECA, 884, Hamburg, Germany) was used to assess body mass (in kg). Arm span (in m) was measured with a tape from one furthermost fingertip to the other, with the swimmer’s back and buttocks touching a wall, facing away from the wall, the arms are
stretched out and abducted horizontally. A total of four skin folds were taken with a skin fold caliper Slim Guide (Creative Health Products, USA) and the fat mass (in %) was estimated according to the Faulkner 31.
Graded and intermittent test
The graded and intermittent test included several swim bouts at a constant velocity16. The distance of the two first bouts was 350m and 400m respectively from the third bout onwards. Distances were selected based on the time needed to accomplish a physiological steady state. At low sub-maximal bouts the distance of 350m was the one required to be accomplished as the swimming speed is slower. With increasing intensity, swim speed increases. Therefore to maintain more or less the time needed for the steady state, it was necessary to increase the distance to 400m. Initial velocity was established according to the swimmers’ individual performance in a 400m front crawl event. The increments on
subsequent bouts were 10% of the 400m best performance velocity per each stage until exhaustion. During this test the swimming velocity of the subjects was kept constant by an electronic pacer placed at the bottom of the swimming pool (TAR. 1.1, GBK-electronics, Aveiro, Portugal). The subjects were instructed to follow the pacer’s light signal, and they had had previous experience using such a device. No warm-up was performed before the start of the test and passive recovery between
successive bouts was individualised. The subjects started each bout when their oxygen uptake presented two consecutive values within 2ml·kg-1·min-1 from that recorded before the start of the first bout (average oxygen uptake during 2nd minute prior to the start of the first bout of the graded test). The test was started with the subjects in the pool, pushing off the wall with their feet. After every 25m an open turn technique was performed (i.e. a body rotation to the side wall, without diving
and subsequent feet push-off from the wall). The swimmers were advised to reduce gliding during the start and turnings. The test ended with the subject’s voluntary exhaustion or until they could no longer swim at the
predetermined pace.
Throughout the test, expired gases were collected breath-by-breath and analysed with a gas analyser (K4b2, Cosmed, Rome, Italy) connected to a valve (AquaTrainer, Cosmed, Rome, Italy). Before each test, calibration procedures were performed as suggested by the manufacturer. The oxygen uptake was averaged thereafter at 20s intervals.
Immediately after the conclusion of each bout, capillary blood samples were collected from the finger to determine the blood lactate concentration with a hand-portable lactate analyser (Accusport, Boehringer, Manheim, Germany). This device was previously reported as having a satisfactory accuracy, reliability and validity 32. In addition, prior to each test, a calibration of the hand-portable lactate
analyser was performed with several YSI 1530 Standard Lactate Solutions (i.e. 2-, 4-, 8- and 16mmol·L-1).
The all-out test
The all-out test was performed in one of the two events: (i) the 100m front crawl (n=12) or; (ii) the 200m front crawl (n=14). Subjects were assigned to each distance according to their best competitive performance and were asked to swim as if they were in a timed competitive race. Subjects were allowed to perform their regular basic competition warm-up drills. The test was not started until the subject’s oxygen uptake returned to resting values (the same individual value recorded before the start of the graded test). Each subject performed the test individually. The start of the test and each turn-over were performed as described in the graded test.
Throughout the test, oxygen uptake was also measured with the same gas analyser (K4b2, Cosmed, Rome, Italy) connected the valve (AquaTrainer, Cosmed, Rome, Italy) and thereafter averaged again in 20s intervals. The calibration procedures were also performed before each test. In addition, capillary blood sample collections were made every 2min post-race until blood lactate concentrations levelled off.
Calculations
The graded test was performed to obtain VO2/velocity relationship points that enabled
33 Official Journal of FIMS (International Federation of Sports Medicine)
(in ml·kg-1·min-1) was the highest 20s average oxygen uptake (VO2mean, in ml·kg
-1
·min-1) value observed in each subject either in the graded or in the all-out test. Swimming velocity associated with peak VO2 (VpeakVO2, in m·s
-1
) was estimated from the inclusion of the peak VO2 of each subject in the individual
VO2/velocity regression equation. The
VO2/velocity regression was developed for
each subject using the steady-state VO2
values during the last minute of each exercise bout in the graded test. An individual resting VO2 measurement (VO2 at null velocity) was
also included in the regressions. Oxygen uptake measurements from incomplete bouts were excluded from the regression model. In addition, bouts that failed to comply with the VO2 steady-state attainment (given by a
difference below 2ml·kg-1·min-1 between two consecutive min) were not included in the regression models. The energy cost of swimming (CS, in ml·kg
-1
·m-1) was determined from the slope of the VO2/velocity regression
line.
The accumulated oxygen deficit (AOD, in ml·kg-1) was calculated as the difference between accumulated oxygen demand and accumulated oxygen uptake during the all-out test. This estimation was not corrected for body oxygen stores. The accumulated oxygen deficit was calculated by linear extrapolation of the energy cost previously assessed. The accumulated oxygen uptake was the
integration of oxygen uptake during the all-out test over the time. The aerobic energy fraction (in %) was obtained, dividing the accumulated oxygen uptake by the accumulated oxygen demand.
Accumulation of blood lactate (in mmol·L-1) in the graded test was traced by linear
interpolation to determine the swimming velocity corresponding to the 4mmol·L-1
threshold. Swimming velocities associated with the 2mmol·L-1 (V2, in m.s
-1
) and the 4mmol·L-1 (V4, in m.s
-1
) thresholds were determined by linear interpolation of the points relating blood lactate and swimming velocity during the graded test. The VO2 elicited at the 2mmol·L-1
(VO2@V2, in %) and the 4mmol·L -1
(VO2@V4,
in %) thresholds were calculated by the inclusion of V2 and V4 in the individual
VO2/velocity regression equation and
expressed as a fraction of peak VO2.
Statistics
The normality and homocedasticity
assumptions were checked respectively with the Shapiro-Wilk and the Levene tests. Descriptive statistics (mean and one standard deviation) from all variables were calculated.
The Mann-Whitney U test was computed to compare significant differences in all variables selected (age, performance, anthropometrics and physiology) according to the swimmer’s group variable (100m versus 200m
performances). Z values presented are based on positive ranks. The level of statistical significance was set at P ≤ 0.05. The effect size was computed with Cohen’s d for all variables. It was considered a: (i) small effect size if 0 ≤ |d| ≤ 0.2; (ii) medium effect size if 0.2 < |d| ≤ 0.5 and; (iii) large effect size if |d| > 0.5
33
.
Forward step-by-step linear regression models were computed to predict swimming
performance (for both the 100m and 200m groups). The subjects’ performances (season best and all-out test) were taken as
endogenous (i.e. dependent) variables. The age, physiological and anthropometric measures were selected as exogenous (i.e. independent) variables. The variables were entered into the equation if F ≥ 4.0 and removed if F ≤ 3.96. The level of statistical significance was set at P ≤ 0.05.
Results
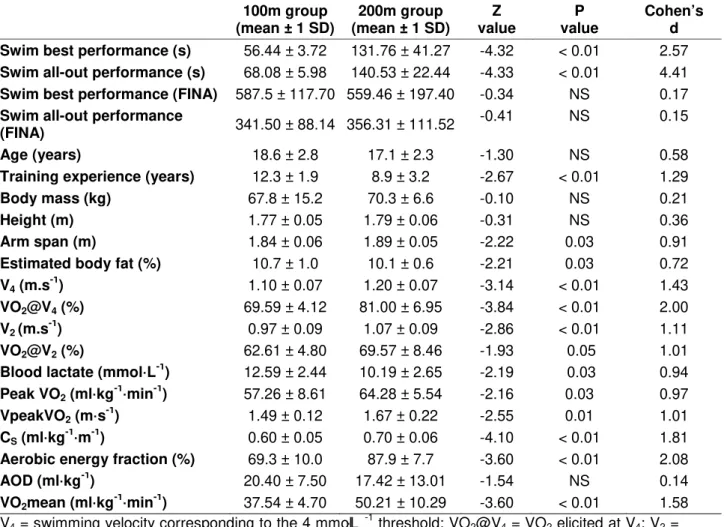
Table 1 presents the descriptive statistics and comparison of performance, age,
anthropometric and physiological variables between the 100m and the 200m groups. There were no significant differences between both events, neither for the swimming best performance nor for the swimming all-out performance based on FINA points. There were significant differences between groups in the arm span and estimated body fat. In both cases mean values were higher in the 200m swimmers. The sample size was considered as having a large effect on data based on the Cohen’s d values. The V4, VO2@V4, V2,
VO2@V2, Blood lactate, peak VO2, VpeakVO2,
CS, VO2mean were also significantly different
34 Official Journal of FIMS (International Federation of Sports Medicine)
Table 1: Comparison of performance, age, anthropometric and physiological variables between 100m (n=12) and 200m (n=14) groups
100m group (mean ± 1 SD)
200m group (mean ± 1 SD)
Z value
P value
Cohen’s d Swim best performance (s) 56.44 ± 3.72 131.76 ± 41.27 -4.32 < 0.01 2.57
Swim all-out performance (s) 68.08 ± 5.98 140.53 ± 22.44 -4.33 < 0.01 4.41
Swim best performance (FINA) 587.5 ± 117.70 559.46 ± 197.40 -0.34 NS 0.17
Swim all-out performance
(FINA) 341.50 ± 88.14 356.31 ± 111.52
-0.41 NS 0.15
Age (years) 18.6 ± 2.8 17.1 ± 2.3 -1.30 NS 0.58
Training experience (years) 12.3 ± 1.9 8.9 ± 3.2 -2.67 < 0.01 1.29
Body mass (kg) 67.8 ± 15.2 70.3 ± 6.6 -0.10 NS 0.21
Height (m) 1.77 ± 0.05 1.79 ± 0.06 -0.31 NS 0.36
Arm span (m) 1.84 ± 0.06 1.89 ± 0.05 -2.22 0.03 0.91
Estimated body fat (%) 10.7 ± 1.0 10.1 ± 0.6 -2.21 0.03 0.72
V4 (m.s -1
) 1.10 ± 0.07 1.20 ± 0.07 -3.14 < 0.01 1.43
VO2@V4 (%) 69.59 ± 4.12 81.00 ± 6.95 -3.84 < 0.01 2.00
V2 (m.s -1
) 0.97 ± 0.09 1.07 ± 0.09 -2.86 < 0.01 1.11
VO2@V2 (%) 62.61 ± 4.80 69.57 ± 8.46 -1.93 0.05 1.01
Blood lactate (mmol·L-1) 12.59 ± 2.44 10.19 ± 2.65 -2.19 0.03 0.94
Peak VO2 (ml·kg -1
·min-1) 57.26 ± 8.61 64.28 ± 5.54 -2.16 0.03 0.97
VpeakVO2 (m·s-1) 1.49 ± 0.12 1.67 ± 0.22 -2.55 0.01 1.01
CS (ml·kg -1
·m-1) 0.60 ± 0.05 0.70 ± 0.06 -4.10 < 0.01 1.81
Aerobic energy fraction (%) 69.3 ± 10.0 87.9 ± 7.7 -3.60 < 0.01 2.08
AOD (ml·kg-1) 20.40 ± 7.50 17.42 ± 13.01 -1.54 NS 0.14
VO2mean (ml·kg-1·min-1) 37.54 ± 4.70 50.21 ± 10.29 -3.60 < 0.01 1.58
V4 = swimming velocity corresponding to the 4 mmol·L -1
threshold; VO2@V4 = VO2 elicited at V4; V2 =
swimming velocity corresponding to the 2 mmol·L-1 threshold; VO2@V2 = VO2 elicited at V2; VpeakVO2
= velocity associated to the peak VO2; CS = energy cost of swimming; AOD = accumulated oxygen
deficit; VO2mean = mean VO2 during the all-out bout; NS = not significant
Table 2 presents the multiple regressions that were established predicting swimming performance based on several variables. The
models computed were able to predict from 44% (i.e. 200m all-out bout) to 61% (i.e. 200m season best) swimming performance.
Table 2: Multiple regressions with significance for FINA scores (season best and all-out bout) as dependent variables in the 100m (n=12) and 200m (n=14) groups
Group Equation R Ra
2
SE RE 100m SB FINA= (927.60.V2 – 59,02
.
body fat) + 310.36 0.77 0.49 78.66 13.7%
100 m ALL FINA= (3.16.body mass) + 114.01 0.78 0.60 40.81 11.4%
200m SB FINA= (-3.77.TE – 0.985.VO2mean) + 223,71 0.78 0.61 15.31 2.4%
200m SB FINA= (47.66.Age) – 184.68 0.80 0.61 85.61 13.6%
200m ALL FINA= (20.89.TE) + 191.19 0.66 0.44 79.35 20.1% SB FINA = season best FINA score; ALL FINA = all-out bout FINA score; TE = training experience; VO2mean = mean VO2 during the all-out bout; Ra
2
= adjusted R2; SE = standard error of the regression; RE = relative error
Discussion
The aims of the present study were to: (i) to compare the anthropometric and physiological profiles of 100m and 200m front crawl
swimmers and; (ii) to identify anthropometric and physiological variables that account for the prediction of swimming performance in the
100m and 200m front crawl events. Some smooth but significant differences in the anthropometric and physiological profiles of 100m and 200m specialists were found, added to the fact that both age and given
35 Official Journal of FIMS (International Federation of Sports Medicine)
Despite the previous body of evidence addressing the contribution of physiological measures to predict swimming performance 9,
12, 27
, the use of swimming valves in physiological testing is recent. Swimming valves attached to gas analysers have been used to assess the physiological response during swimming. However, the valve itself imposes some technical and mechanical constraints during swimming which may lower the precision of such estimates to predict true swimming performance 30. Therefore these authors hypothesised that the factors explaining performances would be different under the two swimming conditions (i.e. during an all-out bout attached to the snorkel and the season best performance in the competitive context).
Comparing the performance, anthropometric and physiological profiles, there were some smooth but significant differences between the 100m and the 200m swimmers. The arm span and estimated body fat were significantly higher in the longer event swimmers. Arm span is directly related to biomechanical variables such as stroke length 22 and the latter one to efficiency 34 and performance 25, 28. Fat mass is related to the buoyancy effect, with a more streamlined position in the water, decreasing body torque and drag force 35. The V4,
VO2@V4, V2, VO2@V2, blood lactate, peak
VO2, VpeakVO2, CS, VO2mean were also
significantly different between the two groups of swimmers. For example, blood lactate was higher in the shorter event and peak VO2,
VpeakVO2, aerobic energy fraction were higher
in the longer one. This seems to be in
accordance to previous literature reporting that shortest events are quite dependent from anaerobic pathways and with increasing distance the partial contribution of the aerobic pathways have a trend to be higher 18, 19, 24.
The best season performance was more accurately predicted by training experience and mean VO2 during the all-out bout for the
200m event (imprecision ≈2%), while in the 100m event it was best predicted by estimated body fat and swimming velocity corresponding to the 2mmol·L-1 threshold (imprecision ≈14%). When the subject’s performance was assessed in the all-out bout, the prediction models were less robust, with body mass as the single predictor for 100m event (imprecision ≈11%) and training experience as the single predictor for 200m event (imprecision ≈20%). The correlation coefficient that these authors have
found between performance under the two conditions of exercise was moderate (r=0.44;
P<0.05). This might indicate that the extent into which swimmers adapt to the swimming valve may vary considerably.
Previous studies reported that peak VO2 was
the best performance predictor at competitive swimming 12. In the present study, peak VO2
was not able to predict the best performance of the season. Though this present study did confirm that subjects with the best
performance level do attain higher peak VO2
compared with less proficient swimmers 27. The VpeakVO2 has also been investigated in
front crawl swimming 14, 15. This may also represent a possible limitation to swimming performance, since it reflects the subject’s swimming economy when obtaining maximal O2 utilisation by the exercising muscles. The
mean values of VpeakVO2 that these authors
have observed in the 100m group are within those reported by Fernandes et al. 14, 15, although the subjects’ peak VO2 in the present
study was considerably lower than that in Fernandes et al. 14, 15 studies. Differences in the exercise protocol that these authors have used, as well as in the equation that was used to calculate VpeakVO2, may help to explain the
mismatch with the referred studies 14, 15, 27. This idea is reinforced by the observation in the 200m group in the present study. Indeed, despite the higher VpeakVO2 of this present
study’s subjects compared to that in the aforementioned studies, these authors subjects’ peakVO2 was still below those of the
other studies mentioned. Also, when this study’s results are compared with those by Fernandes et al. 10 a higher VpeakVO2 in this
study’s subjects was accompanied by lower peakVO2 mean values, when compared to the
values found byFernandes et al. 10. Although the literature has reported that CS can
differentiate subjects with different
performance levels 9, 27 or correlate negatively with performance 9, this study’s results do not support such data, since CS was not included
in any of the final regression models found.
The swimming velocity associated with V4 in
the present study was lower than that reported previously by Fernandes et al. 14, 15, when assessing the individual anaerobic threshold. The apparently higher aerobic ability of the swimmers in Fernandes et al. 14, 15 studies may help to explain the differences. Indeed, the peak VO2 of the subjects in the present study
36 Official Journal of FIMS (International Federation of Sports Medicine)
was included in the models that predicted 100m or 200m performance in the present study. Curiously, the swimming velocity associated with the V2 was combined with
body fat to predict the 100m best season performance with a 13.7% imprecision value.
None of the anaerobic ability indicators that these authors have assessed were included in the performance prediction models that were established. The AOD mean values that these authors have observed are close to those reported when using a similar method 16. Also, these authors’ mean values for peak post-exercise blood lactate were also lower than those reported in the literature for trained swimmers performing the same distances, especially in the 200m distance 36. The literature presents positive correlations between peak blood lactate and performance
20
, but this present study’s results do not support such data.
In the present study, the physiological measure that appeared most often in the final prediction models was the mean VO2 during the all-out
bouts. This measure was not found previously in the literature during front crawl swimming. The aerobic energy fraction calculated in the present study for the 100m and 200m events was ≈69% and ≈88%, respectively. These values are higher when compared with
previous studies that applied the same method for the same events 17-19.
Conclusions
The results of the present study point out that the anthropometric and physiological profiles of 100m and 200m swimmers are different. In addition to this, the mean VO2 during exercise,
combined with training experience, may explain the 200m front crawl best season performance with high precision. In this event, VO2mean was negatively associated with SB
FINA. This means that the ability to generate a large amount of energy from aerobic sources could be a counter factor in the 200m event. However, since no anaerobic variable was included in the models, this present study’s data cannot support such a conclusion. Since results that were observed in the 100m group were vastly different, these authors conclude that the extent to which physiological and anthropometric variables combine to predict performance probability is highly group-specific.
Acknowledgments
This study was supported by grants of the FCT under the program POCI
(POCI/DES/58362/2004).
Address for correspondence:
Dr Victor Machado Reis, Department of Sport Sciences, Exercise & Health, University of Trás-os-Montes and Alto Douro (UTAD), Apartado 1013 5000-801 Vila Real, Portugal Tel. +351 259 350 877
Fax +351 250 330 168
Email:
References
1. Barbosa TM, Costa MJ, Marinho DA, et al. Modeling the links between age-group swimming performance, energetic and biomechanic profiles. Ped Exerc Sci 2010; 22:379-391.
2. Tomikawa M, Nomura T. Relationships between swim performance, maximal oxygen uptake and peak power output when wearing a wetsuit J Sci Med Sport 2009; 12:317-322.
3. Barbosa TM, Bragada J, Reis VM, et al. Energetics and biomechanics as determining factors of swimming performance: Updating the state of the art. Journal of Science and Medicine in Sport 2010; 13:262–269.
4. Barbosa TM, Pinto E, Cruz AM, et al. The Evolution of Swimming Science Research: Content analysis of the “Biomechanics and Medicine in Swimming” Proceedings Books from 1971 to 2006. In: Kjendlie PL, Stallman RK, Cabri J, eds. Biomechanics and Medicine in Swimming XI. Oslo. Norwegian School of Sport Science, 2010: 312-314.
5. Vilas-Boas JP. The Leon Lewillie Memorial Lecture: Biomechanics and Medicine in Swimming, Past, Present and Future. In: Per-Ludvik K, Robert KS, Jan C, eds. Biomechanics and Medicine in Swimming XI; 2010. Norwegian School of Sport Science, Oslo, 12-19. 6. Barbosa TM, Fernandes R, Keskinen K,
et al. Evaluation of the energy expenditure in competitive swimming strokes. Int J Sports Med 2006; 27: 894-899.
37 Official Journal of FIMS (International Federation of Sports Medicine)
8. Zamparo, P. Effects of age and gender on the propelling efficiency of the arm stroke. Eur J Appl Physiol 2006; 97:52-58.
9. Wakayoshi K, D’Acquisto J, Cappaert JM, et al. Relationship between oxygen uptake, stroke rate and swimming velocity in competitive swimming. Int J Sports Med 1995; 16:19-23.
10. Fernandes RJ, Billat VL, Cruz AC, Colaço PJ, Cardoso CS, Vilas-Boas JP. Has gender any effect on the
relationship between time limit at VO2max velocity and swimming economy? J Hum Mov Studies 2005; 49:127-148.
11. Laffite LP, Vilas-Boas JP, Demarle A, et al. Changes in physiological and stroke parameters during a maximal 400-m free swimming test in elite swimmers. Can J Appl Physiol 2004; 29: S17-S31. 12. van Handel P, Katz A, Morrow J et al.
Aerobic economy and competitive performance of US elite swimmers. In Ungerechts B, Wilke K, Reischle K, eds,
Swimming Science V Champaign - IL: Human Kinetics Books, 1988:219-227. 13. Rodriguez F, Mader, A. Energy
metabolism during 400 and 100m crawl swimming: computer simulation based on free swimming measurement. In Chatard JC, ed, Biomechanics and Medicine in Swimming IX. Saint-Etienne: University of Saint-Etienne, 2003:373-378.
14. Fernandes RJ, Cardoso CS, Soares SM, et al. Time limit and VO2 slow
component at intensities corresponding to VO2max in swimmers. Int J Sports Med. 2003; 24:576-581.
15. Fernandes RJ, Keskinen KL, Colaço P, et al. Time limit at VO2max velocity in elite crawl swimmers. Int J Sports Med 2008; 29:145-150.
16. Reis VM, Marinho DA, Policarpo FB et al. Examining the accumulated oxygen deficit method in front crawl swimming. Int J Sports Med 2010; 31: 421-427. 17. Silva A, Reis VM, Reis A et al.
Associations between energy release and performance in a supramaximal effort of 200m in crawl. In Vilas-Boas JP, Alves F, Marques A, eds. Biomechanics and Medicine in Swimming X Porto, FADE-UP, 2006:59-60.
18. Troup J. Aerobic characteristics of the four competitive strokes. In: Troup J. ed,
International Center for Aquatic Research Annual. Studies by the International Center for Aquatic
Research (1990-1991). Colorado Spring: US Swimming Press, 1992: 3-7.
19. Troup J. Measurement of swimming anaerobic capacity. In: Troup J. ed,
International Center for Aquatic Research Annual. Studies by the International Center for Aquatic
Research (1990-1991). Colorado Spring: US Swimming Press, 1992: 9-16. 20. Wakayoshi, K, Yoshida, T, Udo, M. et al.
Does critical swimming velocity
represent exercise intensity at maximal lactate steady state? Eur J Appl Physiol 1993; 66:90-95.
21. Seifert L, Barbosa TM, Kjendlie PL.. Biophysical Approach in Swimming: Gender Effect. In: Davies SA, ed.
Gender Gap: Causes, Experiences and Effects. Nova Science Publishers, In press.
22. Chengalur S, Brown P. An analysis of male and female olympic swimmers in the 200m events. Can J Sport Sci 1992; 17:104-109.
23. Tuuri G, Loftin M, Oescher J.
Association of swim distance and age with body composition in adult female swimmers. Med Sci Sports Exerc 2001; 34:2110-2114.
24. Capelli C, Pendergast D, Termin B. Energetics of swimming at maximal speed in humans. Eur J Appl Physiol 1998; 78:385-393.
25. Kinematic measures and stroke rate variability in elite female 200-m swimmers in the four swimming
techniques: Athens 2004 Olympic semi-finalists and French National 2004 Championship semi-finalists. J Sports Sci 2008; 26:35-46.
26. Reis VM, Barbosa TM, Marinho DA et al. Physiological determinants of
performance in breaststroke swimming events. Int SportsMed J 2010; 11: 324-335.
27. Fernandes R, Billat V, Cruz A, et al. Does net energy of swimming affect time to exhaustion at the individual's maximal oxygen consumption velocity? J Sports Med Phys Fitness 2006; 46: 373-380. 28. Seifert L, Chollet D, Chatard JC.
Kinematic change during a 100-m Front Crawl: effects of performance level and gender. Med Sci Sports Exerc 2007; 39:1784-1793.
38 Official Journal of FIMS (International Federation of Sports Medicine)
a pilot study. J Sports Sci Med. 2008; 7, 201 – 209
30. Barbosa TM, Silva AJ, Reis AM et al. Kinematical changes in swimming front crawl and breaststroke with the
AquaTrainer® snorkel. Eur J Appl Phisiol 2010; 109:1155-1162. 31. Faulkner JA. New perspectives in
training for maximum performance. J Am Med Assoc 1968; 205:741-746.
32. Pinnington H, Dawson B. Examination of the validity and reliability of the
Accusport blood lactate analyser. J Sci Med Sport 2001; 4:129-138.
33. Cohen J. Statistical power analysis for the behavioural sciences. Hillsdale, NJ, Lawrence Erlbaum Associates, 1988. 34. Toussaint H, Hollander AP. Mechanics
and energetics of front crawl swimming. In: Miyashita M, Mutoh Y, Anderson AB, eds. Medicine and Science in Aquatic Sports. Basel: Karger; 1994:107-116. 35. Zamparo P, Antonutto G, Capelli C, et
al. Effects of body density, gender and growth on underwater torque. Scan J Med Sci Sports 1996; 6:273-280. 36. Lindh AM, Peyrebrune MC, Ingham SA,