481
Vol.49, n. 3 : pp. 481-490, May 2006
ISSN 1516-8913 Printed in Brazil BRAZILIAN ARCHIVES OF
BIOLOGY AND TECHNOLOGY
A N I N T E R N A T I O N A L J O U R N A L
Production of Alcohol by Simultaneous Saccharification and
Fermentation of Low-grade Wheat Flour
Marcos Antonio das Neves1*, Toshinori Kimura1, Naoto Shimizu1and Kiwamu Shiiba2
1Graduate School of Life and Environmental Sciences; University of Tsukuba; maneves2000@yahoo.com; Tennodai
- Tsukuba. 2 Nisshin Flour Milling Co. Ltd. 25; Kanda-Nishiki-cho 1-chome; Chiyoda-ku; Tokyo - Japan
ABSTRACT
Two samples of low-grade wheat flour, namely low-grade 1 (LG1) and low-grade 2 (LG2), with different carbohydrate and fibrous content, were used as substrates. The samples were liquefied using various concentrations of α- or β-amylase, in order to optimize the production of fermentable sugars; the enzyme α-amylase revealed higher performance. After liquefaction, the simultaneous saccharification and fermentation was conducted in a jar fermentor. Amyloglucosidase was used for saccharification, and dry baker’s yeast, S. cerevisiae, for fermentation simultaneously. Glucose was consumed promptly in both cases, LG1 and LG2; ethanol production was considerably higher in LG1 (38.6 g/L), compared to LG2 (24.9 g/L). The maximum ATP production was observed early in the SSF process. LG1 revealed higher potential as substrate for ethanol production.
Key words: Low grade, wheat flour, yeast, fermentation, ethanol
*
Author for correspondence
INTRODUCTION
Because of the increasing demand for fuel ethanol, there is a need to search for high yielding processes and easily accessible technology for the production of ethanol at reduced cost (Sree et al., 2000). Brazil is the pioneer in large-scale motor fuel ethanol production through the fermentation of sugar cane molasses by yeast, producing in the year 2004 about 14.2 billion liters of bioethanol (Licht, 2005), most of which is fermented using hexose sugars present in cane syrup (Monte Alegre et al, 2003). In Brazil, the total amount of wheat flour produced in the year 2000 was about 6.8 million ton (FIBGE, 2001), from which about 5 % represented the amount of low-grade wheat flour. Low-grade flour is a by-product generated during wheat milling at the tail end of breaks and reduction system, consisting of outer parts of
kernel, such as outer pericarp, aleurone layer and starchy endosperm, resulting in a varied composition, depending on which stage of milling process it was extracted (Hoseney, 1986). Wheat bran, low-grade wheat flour and germ are the major by-products of wheat milling; the milling yield of these products represent about 26% of the original grain (bran: 24.8%; low-grade flour: 1.3%; germ: 0.2%), and they are of considerable economic significance to the miller. Though the most low-grade flour have been used as feed, a little amount is used as adhesive agents as well (Pomeranz, 1988).
Furthermore, some references about ethanol production from raw wheat flour (Montesinos and Navarro, 2000; Sharma et al., 2002) and damaged wheat grains (Suresh et al., 1999) are also available. However, very few reports on the usage of wheat milling by-products for ethanol production are found in the literature.
The objective of this work was to investigate the suitability of low-grade wheat flour as substrate for ethanol production by enzymatic hydrolysis of starch and simultaneous saccharification and fermentation.
MATERIAL AND METHODS
Raw material: Two different lots of sample, namely grade wheat flour 1 (LG1) and low-grade wheat flour 2 (LG2), were provided by Nisshin Flour Milling Co., Japan. In LG1, the starch content was higher than in LG2, but the latter was rich in fibrous material (Table 1).
Table 1 Average chemical composition (%) of various cereals and by-products
Product Moisture Starch Protein Fiber Ash Others
Brown rice a 12.2 60.0 9.1 1.1 1.1 16.5
Wheat flour b 13.1 62.0 10.4 0.2 0.6 13.7
Wheat bran a 13.5 11.7 13.3 10.8 6.4 44.3
Low-grade flour 1 b 14.0 15.6 15.0 0.8 2.7 51.9
Low-grade flour 2 b 14.0 10.4 16.5 5.0 3.2 50.9
Source: a Pomeranz and Nagao (1992) b This report
Yeast: Dry baker’s yeast, S. cerevisiae was used (Saf-Instant, Marcq-France).
Enzymes: The hydrolysis was conducted in two steps. For the liquefaction, α-Amylase (EC 3.2.1.1, 51 U/mg, Sigma, USA) from Bacillus species was used. For saccharification, the enzyme amyloglucosidase (EC 3.2.1.3, 23 U/mg, Sigma, Japan) from Rhizopus mold was added together with the inoculum. β-amylase (EC 3.2.1.2, 19 U/mg, Sigma, USA) from barley was also used for liquefaction, and its performance during starch hydrolysis was compared to α-amylase, aiming to increase the final maltose concentration.
Starch liquefaction optimization: The hydrolysis was conducted at 55 and 75°C, with two levels of α-amylase: 100 and 200 U/g-flour. The starch hydrolysis performance was evaluated based on the liquefaction yield (YL) (g-maltose/g-substrate) and on the maltose production; the liquefaction yield was calculated according to equation 1, where M indicates the maltose concentration.
L
-final initial) (g)
(M M
Y =
Substrate (g) (1)
Initially 1 L slurries containing 100 g/L of low-grade wheat flour were prepared in distilled water,
and α-amylase was added (as described above); the samples were hydrolyzed at the suitable temperature for 2 h with mild agitation (100 rpm). Simultaneous Saccharification and Fermentation of low-grade wheat flour: after liquefaction, the pH was adjusted to 4.5, amyloglucosidase (200 U/g-flour) and dry baker’s yeast (10 g/L) were added to the mixture and the SSF was conducted at 35°C for 24 h, with mild agitation (100 rpm). The reactor was continuously purged with N2 (100 ml/min) to ensure the anaerobic condition; the pH was automatically maintained at 4.5 by the addition of NaOH 5N using a peristaltic pump. The fermentation was conducted in a jar fermentor (MDL 200 B.E. Marubishi Co. Ltd., Japan) with a working volume of 2 L, equipped with gas flow meter, pH and temperature control.
The SSF performance was evaluated based on the ethanol yield (YP/S) (L-ethanol/kg-substrate), obtained using equation 2.
P/S
Ethanol produced (L)
Y
=
Substrate (kg)
(2)
Production of Alcohol by Simultaneous Saccharification and Fermentation of Low-grade Wheat Flour 483
was inoculated into 1L of slurry containing10 % (w/v) of LG1 and the SSF was conducted. Aliquots were withdrawn at determined intervals of time, plated into YM agar, incubated at 28°C for 48h, and the number of colonies (N, CFU/mL) was evaluated.
The specific growth rate (µ) was calculated by linear regression of the logarithmic number of yeast cell (Log N) during the exponential growth phase (Moon et al., 2005), and equation 3.
µ
Slope =
2.303 (3)
The generation time (g) was calculated according to equation 4 (Barker, 1998).
µ=ln 2
g (4)
Analytical methods: Samples were withdrawn regularly in every process for posterior analysis; except for ATP analysis. All samples were centrifuged at 4,000 rpm for 20 min. Glucose, maltose and ethanol concentrations were analyzed using HPLC, as previously described by Shiiba et. al.(1993). After centrifugation, the supernatant was filtered through chromato-disk filters (pore size = 0.45 µm). HPLC system used was JASCO consisting of a pump PU-980, detector RI-930, sampler AS-950 (20 µl injection loop), and column Sugar KS-801 (Shodex Co., Japan) at 80°C; eluent: water at a flow rate of 0.6 ml/min and elution time 30 min. Reducing sugar content was analyzed using the 3,5-Dinitrosalisylic acid (DNS) method (Bernfeld, 1955), and the initial starch content in low-grade flour was analyzed
using the phenol-H2SO4 method (Dubois et al., 1956). The ATP concentration was analyzed using a luminometer AF-100 ATP analyzer, TOA Electronics Ltd., equipped with a Turn Table AF-30TB, TOA Electronics Ltd, and the Luciferin-Luciferase bioluminescence method (Horiuchi et al., 2003).
RESULTS AND DISCUSSION
Starch liquefaction optimization
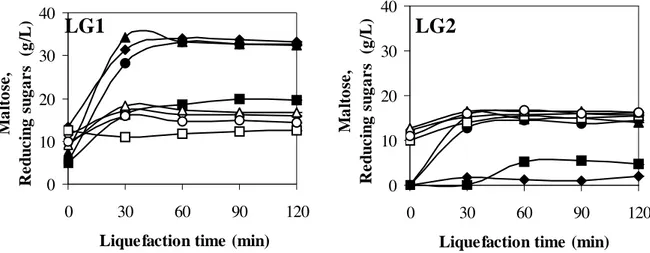
This experiment was conducted up to 2 h, reaction time necessary for complete hydrolysis of starch, in case of LG1, when 100 U-α-amylase/g-flour and 75°C were used for liquefaction, as shown in Fig. 1. As reported in the literature (Montesinos and Navarro, 2000), 2 h liquefaction were absolutely necessary for complete starch hydrolysis using raw wheat flour as substrate. A shorter liquefaction time (0.5 or 1 h) brought to a wort with higher viscosity, which did not allow an efficient hydrolysis of glucose polymers.
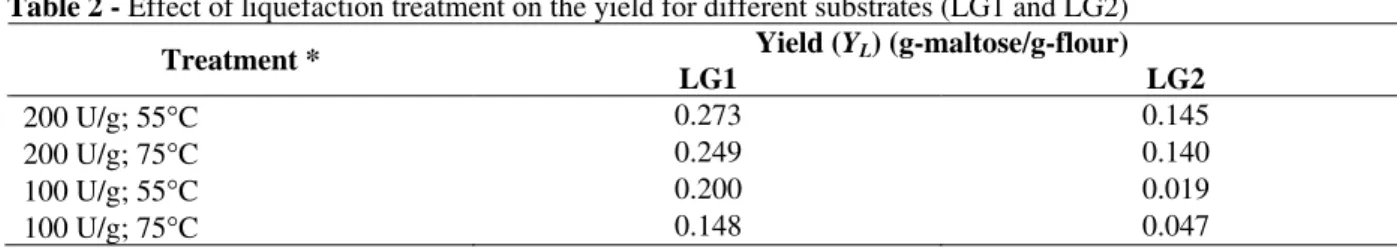
Maltose production after 2 h liquefaction was considerable higher in case of LG1. The process conducted at lower temperature (55°C) with higher enzyme activity (200 U/g-flour) resulted in the highest liquefaction yield (0.273 g-maltose/g-flour), as indicated in Table 2. On the other hand, liquefaction conducted at 55°C using 100 U/g-flour resulted in the lowest yield (0.019) in case of LG2.
Table 2 - Effect of liquefaction treatment on the yield for different substrates (LG1 and LG2)
Yield (YL) (g-maltose/g-flour)
Treatment *
LG1 LG2
200 U/g; 55°C 0.273 0.145
200 U/g; 75°C 0.249 0.140
100 U/g; 55°C 0.200 0.019
100 U/g; 75°C 0.148 0.047
* Two levels of α-amylase (100 or 200 U/g-flour) and temperature (55 and 75°C) were used for liquefaction.
The liquefaction conducted at lower temperature resulted in higher yield, which might be related to the type of enzyme utilized. Thermostable α -amylases (which support well high temperatures without loss in their activity) are utilized for industrial liquefaction, the commercial α-amylase utilized in this study had an optimum temperature
pressure batches or continuous liquefaction, in which crude starch slurries containing as much as 40 % (w/w) solids can be used.
Liquefaction with αααα- and ββββ-amylase
In order to obtain high ethanol productivities, a key factor is to optimize the amount of maltose available for saccharification so as to release more glucose for fermentation. Aiming to increase the liquefaction efficiency, β-amylase was used for starch hydrolysis, and its performance was compared to α-amylase. Generally, β-amylase should release higher amounts of maltose from starch hydrolysis, if compared to α-amylase (Brautlecht, 1953). It has the capacity of decomposing into maltose all polysaccharides which are built up of glucose residues united by α -1,4 glycosidic bonds. Furthermore, this enzyme is
commonly used in commercial ethanol processing plants (Mann, 2003).
The flour LG2 was used as substrate and three different levels of enzyme activity were tested: 200, 400 and 800 U/g-flour (Chi and Liu, 1993). The hydrolysis was conducted up to 4 h, considering the gradual increase in maltose content when 800 U/g-flour of β-amylase were used for liquefaction. The results are presented in Fig. 2. Maltose production from LG2 increased proportionally with activity, for both enzymes α- or β-amylase. Furthermore, the enzyme α-amylase presented a considerably higher maltose production, compared to β-amylase.
In view of these results, the process conducted for 2 h at 55°C using 200 U α-amylase/g-flour was selected as the most suitable for low-grade wheat flour liquefaction, and used hereafter as previous step for every fermentation experiments.
0 10 20 30 40
0 30 60 90 120
Liquefaction time (min)
M a lt o se , R e d u c in g s u g a r s ( g /L ) 0 10 20 30 40
0 30 60 90 120
Liquefaction time (min)
M a lt o se , R e d u c in g s u g a r s ( g /L )
Figure 1 - Profiles of maltose (filled) and reducing sugars (hollow) during liquefaction optimization. Symbols: ▲△, 75°C, 200 U/g-flour;●○, 55°C, 200 U/g; ◆◇, 55°C, 100 U/g; ■□, 75°C, 100 U/g(Left: LG1; right: LG2).
Simultaneous Saccharification-Fermentation of low-grade flour (SSF)
When LG1 was used as substrate, the ethanol production after 24 h of SSF (38.6 g/L) was notably higher compared to the peak ethanol production from LG 2 (24.9 g/L) obtained after 12 h of SSF, as shown in Fig. 3, which agreed well with the higher initial starch content in LG1 (Table 1), releasing more fermentable sugars during the liquefaction. After nearly 6h of SSF, glucose in the fermentation mash was completely consumed in
both cases (using LG1 or LG2 as substrate), remaining nearly constant thereafter.
Sree et al. (1999) reported ethanol production by SSF of wheat products using Saccharomyces cerevisiae; which was 44.2 g-ethanol/L when fine wheat flour was used as substrate, and 34.1 g/L using damaged wheat flour. The ethanol produced from LG1 in this experiment (38.6 g/L) was considerably higher than that obtained from damaged wheat. When the starch content in LG1 was c.a. 25% (Table 1), the final ethanol
Production of Alcohol by Simultaneous Saccharification and Fermentation of Low-grade Wheat Flour 485
production from LG1 represented about 87 % of the ethanol produced from fine wheat flour (44.2 g/L). Lee et al. (1992) studied ethanol production using Zymomonas mobilis and slurries containing 100 g/L of sago starch and found c.a. 40 g/L of ethanol, which was nearly the same from LG1 in this experiment.
Ethanol yield from LG1 (0.49 L-ethanol/kg-flour) was nearly 61 % higher than that obtained from LG2 (Table 3); the LG1 yield was comparable to the average ethanol yield from sugarcane (0.50 L-ethanol/kg-dry biomass) (Kim and Dale, 2004). Furthermore, ethanol yield obtained during this study using either substrate (LG1 or LG2) was considerably higher compared to other agricultural
crops residues, such as wheat straw (0.29 L/kg) or sugarcane bagasse (0.28 L/kg) (Daishou, 2004). Taking into account that saccharification occurred simultaneously with fermentation, some glucose should be produced during that process. In this work, glucose released from starch was promptly used for fermentation, and was rarely detected during the SSF. Various authors have reported about this early glucose extinction during the SSF, using e.g., soluble starch (Fujii et al., 2001) or raw cassava starch (Roble, 2003) as substrate and immobilized yeast for fermentation. The nutrient starvation might play an important role in the saccharification performance (Suresh et al., 1999).
0 10 20 30 40 50
0 1 2 3 4
Liquefaction time (h)
M
a
lt
o
se
(g
/L
)
Figure 2 - Time course of LG2 liquefaction using α-amylase (filled) or β-amylase (hollow). Symbols:
◆◇, 200; ■□, 400; ▲△, 800 U/g-flour. The bars represent the standard deviation (n=3).
0 10 20 30 40
0 4 8 12 16 20 24
Fermentation time (h)
G
lu
co
se
(
g
/L
)
0 10 20 30 40
E
th
a
n
o
l
(g
/L
)
.
Table 3 - Ethanol yield using different substrates.
Substrate Ethanol Yield (YP/S)
(L-ethanol/kg-flour)
LG1 0.489
LG2 0.304
The difference between the optimum temperature for amyloglucosidase activity (55°C) and yeast growth (35°C) also might play an important role in the process. Lower temperatures are preferred because the metabolic activity of the yeast is increased, and this normally results in faster completion of fermentation (Thomas et al., 1993). An alternative proposed in the literature is to use thermo-tolerant yeast strains, allowing to conduct the fermentation at 42°C with increased ethanol production (Sree et al, 1999). Some other factors should be considered in order to clarify this low
saccharification performance, such as the nutrients exhaustion and/or the amylolytic activity of S. cerevisiae, which should contribute partially to the saccharification (Suresh et al., 1999).
Based on the higher performance of LG1 as substrate, the following SSF experiments were conducted using LG1. As illustrated in Fig. 4 both glucose and maltose produced during the previous liquefaction were completely consumed after 12 h SSF of LG 1, along with the nearly constant reducing sugar content thereafter, indicating the end of fermentation.
0 10 20 30 40
0 4 8 12 16 20 24
Fermentation time (h)
G
lu
co
se
,
M
a
lt
o
se
R
ed
u
ci
n
g
s
u
g
a
rs
(g
/L
)
0 10 20 30 40
E
th
a
n
o
l
(g
/L
)
.
Figure 4 - Time course of SSF of LG1. Symbols: ○, glucose; △, maltose; ◇, reducing sugar; ■, ethanol.
The glucose production rate has been reported to increase at early stages of the SSF from raw wheat flour (Montesinos and Navarro, 2000); this increase is closely associated to the fast decrease of maltose consumption. Using raw wheat flour as substrate for SSF, maximum ethanol production was 69 g/L.
Some authors were able to obtain even higher ethanol production, such as 93 g/L or 140 g/L (Sree et al, 1999 ; Chi et al., 1999), utilizing yeast
Production of Alcohol by Simultaneous Saccharification and Fermentation of Low-grade Wheat Flour 487
In order to access the kinetic parameters of dry baker’s yeast growth, LG1 was used as substrate for SSF; the results of this experiment are shown in Fig. 5. During the first hour of SSF the lag phase was observed, after which the exponential growth phase started. Reaching the stationery phase (assumed to be at 8 h of SSF) a slight reduction on cell density was observed, indicating the nutrients depletion on the fermentation broth. Further increase was observed at the end of the process; this late microbial growth might be related to the ethanol consumption by yeast at the end of starch saccharification (Fujii et al., 2001). The logarithm number of yeast cells (Log N) was plotted as a function of time (Fig. 5). The data obtained during the exponential phase were linearized and correlated well (R2=0.976); the slope of the resulting equation (0.1685) was substituted in equation 3 to calculate the specific growth rate: µ = 0.388 h-1.
The generation time (g) for dry baker’s yeast was than calculated using equation 4, obtaining g = 1.78 h, which was the time required for the population to double the number of cells. This result indicated that the average time required for
dry baker’s yeast cells to complete one cell cycle was considerably faster than that of Zymomonas mobilis (5.8 h) growing under the same conditions using the same substrate (Neves et al., 2005). ATP concentration was used to monitor the yeast growth during the fermentation process (Fig. 6). During the SSF onset, ATP concentration increased rapidly, reaching a peak after about 8 h; these results agreed well with the microbial growth data (Fig. 5), indicating that the exponential growth phase occurred between 1 and 8 h of SSF. Furthermore, the peak ethanol production was also observed within this period (Fig. 4), as mentioned in the literature (Sree et al, 1999).
In this study, all experiments were conducted using dry baker’s yeast as inoculum, a common technique used for alcohol production, reaching a peak ethanol concentration of 36.8 g/L. Other yeast strains have already been reported to produce relatively higher amounts of ethanol (Ernandes et al., 1990; Bertolini et al., 1991); such yeast strains might be used in future experiments as well, aiming to increase the ethanol productivity.
y = 0.1685x + 6.7621
6
7
8
9
0
4
8
12
16
20
24
Fermentation time (h)
L
o
g
N
(C
F
U
/m
L
)
0 10 20 30 40 50
0 4 8 12 16 20 24
Fermentation time (h)
A
T
P
(
n
m
o
l/
l)
Figure 6 - ATP pattern during SSF of LG1.
CONCLUSIONS
In terms of liquefaction, the process conducted at 55°C using 200 U/g-flour of α-amylase for 2 h was found to be the most suitable, considering both higher liquefaction yield, and the higher amount of fermentable sugar released from low-grade flour. In the present study, various levels of α- and β-amylase, and several experimental conditions were tested for liquefaction, revealing the higher performance of α-amylase.
As for the SSF, in case of LG1, the ethanol production after 72 h of fermentation was higher (38.6 g/L), if compared to LG2 (24.9 g/L). Although the amount of low-grade flour produced during wheat milling represented only 5% of whole-wheat flour produced (Pomeranz, 1988), the SSF of LG1 represented about 87% of total ethanol production , based on reference data (44.2 g/L) when fine wheat was used as substrate (Sree et al., 1999), depicting LG1 with a higher potential as substrate for ethanol production.
In conclusion, low-grade wheat flour was revealed as a substrate suitable for ethanol production by simultaneous saccharification and fermentation.
RESUMO
Dois lotes de amostras de resíduo de farinha de trigo com teor reduzido de amido, especificamente designadas como amostra 1 (LG1) e amostra 2 (LG2), foram utilizados como substrato para fermentação alcoólica. Inicialmente as amostras
foram hidrolisadas utilizando-se diferentes concentrações de alfa- ou beta-amilase, com o objetivo de otimizar a produção de açúcares fermentáveis; a enzima alfa-amilase apresentou melhor desempenho. O processo simultâneo de sacarificação e fermentação foi conduzido logo após a hidrólise do amido, em um fermentador com volume de 2 L; o meio contendo amido hidrolisado foi inoculado com amiloglucosidase (enzima utilizada para sacarificação) e levedura de panificação desidratada (para fermentação), simultaneamente. Amostras do meio de fermentação foram retiradas regularmente para análise dos teores de glucose, maltose, açúcares redutores e etanol. O teor de Adenosina Tri-Fosfato (ATP) também foi analisado. O açúcar glucose foi completamente consumido no início da fermentação, tanto no caso da amostra LG1, quanto LG2, sendo que a produção de etanol no caso de LG1 (38.6 g/L) foi superior aquela obtida com LG2 (24.9 g/L). A produção máxima de ATP foi observada no início do processo. A amostra LG1 apresentou um maior potencial como substrato para a produção de etanol.
REFERENCES
Production of Alcohol by Simultaneous Saccharification and Fermentation of Low-grade Wheat Flour 489
Barker, K. (1998), At the bench. A laboratory navigator. New York: Cold Spring Harbor Lab. Press. pp. 267-277.
Bernfeld, P. (1955), Amylases, α and β. Methods in Enzymology, 1, 149.
Bertolini, M. C.; Ernandes, J. R. and Laluce, C. (1991), New yeast strains for alcoholic fermentation at higher sugar concentration. Biotechnol. Lett., 13, 197-202. Brautlecht, C. A. (1953). Starch. Its sources, production
and uses. New York: Reinhold Pub.
Chi, Z.; Kohlwein, S. D. and Paltauf, F. (1999), Role of phosphatidylinositol (PI) in ethanol production and ethanol tolerance by a high ethanol producing yeast.
J. Ind. Microbiol. Biotechnol., 22, 58-63.
Chi, Z. M. and Liu, Z. R. (1993), High-concentration alcoholic production from hydrolysate of raw ground corn by a tetraploid yeast strain. Biotechnol. Lett.,
15, 877-882.
Daishou, Y. (2004) Bioethanol, Kougyou Chyousakai, Tokyo [in Japanese].
Dubois, M.; Gilles, K. A.; Hamilton, J. K.; Rebers, P. A. and Smith, F. (1956), Colorimetric method for determination of sugars and related substances. Anal. Chem., 28, 350-356
Ernandes, J. R.; Matulionis, M.; Cruz, S. H.; Bertolini, M. C. and Laluce, C. (1990), Isolation of new ethanol-tolerant yeasts for fuel ethanol production from sucrose. Biotechnol. Lett., 12, 463-468.
FIBGE (2001), Anuário Estatístico do Brasil 2000-2001, Fundação Instituto Brasileiro de Geografia e Estatística [in Portuguese].
Fujii, N.; Sakurai, A.; Suye, S. and Sakakibara, M. (2001), Ethanol production from starch by immobilized A. awamori and S. pastorianus using cellulose carriers. J. Ind. Microbiol. Biotechnol.,
27, 52-57.
Haq, I. U.; Ashraf, H.; Iqbal, J. and Qadeer, M. A. (2003), Production of alpha-amylase from Bacillus licheniformis using an economical medium. Biores. Technol., 87, 57-61.
Horiuchi, J. I.; Ebie, K.; Tada, K.; Kobayashi, M. and Kanno T. (2003), Simplified method for estimation of microbial activity in compost by ATP analysis. Biores. Technol., 86, 95-98.
Hoseney, R. C. (1986), Principles of cereal science and technology. A.A.C.C. Inc.
Kim, S. and Dale, B. E. (2004), Global potential bioethanol production from wasted crops and crop residues. Biomass Bioenergy, 26, 361-375.
Krishnan, M. S.; Xia, Y.; Ho, N. W. Y. and Tsao, G. T. (1997) Fuel ethanol production from lignocellulosic sugars. In: Badal, C. and Woodward, J. (Eds.). Fuels and chemicals from biomass. ACS. pp. 74-92. Lee, C. G.; Kim, C. H. and Rhee, S. K. (1992), A
kinetic model and simulation of starch saccharification and simultaneous ethanol fermentation by amyloglucosidase and Zymomonas mobilis. Bioprocess Eng., 7, 335-341.
Licht, F. O. (2005), World Ethanol and Biofuels Report,
3, 15.
Mann, M. (2003), Ethanol production from potato waste. Topical Report. Grank Forks, ND.
Miguel, N. G. and Belloso, O. M. (1999), Comparison of dietary fiber from by-products of processing fruits and greens and from cereals. LWT Food Sci. Technol., 32, 503-508.
Monte Alegre, R.; Rigo, M. and Joekes, I. (2003), Ethanol fermentation of a diluted molasses medium by Saccharomyces cerevisiae immobilized on Chrysotile. Braz. Arch. Biol. Technol., 46, 751-757. Montesinos T. and Navarro, J. M. (2000), Production of
alcohol from raw wheat flour by Amyloglucosidase and Saccharomyces cerevisiae. Enzyme Microb. Technol., 27, 362-370.
Moon, H. C.; Wakisaka, M.; Shirai Y. and Taniguchi M. (2005), Preferential substrate utilization by
Propionibacterium shermanii in kitchen refuse medium. Jpn. J. Food Eng., 6 : (1), 37-43.
Neves, M. A.; Kimura, T.; Shimizu, N. and Shiiba, K. (2005), Bioethanol production from wheat milling by-products using enzymatic hydrolysis and simultaneous fermentation with Zym. mobilis. Jpn. J. Food Eng. [Submitted, under revision].
Pomeranz, Y. (1988), Wheat: Chemistry and Technology. A.A.C.C. Inc. v. 2.
Pomeranz, Y. and Nagao, S. (1992), Saishin no kokumotsu kagaku to gijyutsu. Pannyuusu Co. Tokyo [in Japanese].
Roble, N. (2003), Development of production systems for raw cassava starch bioconversion in novel bioreactors with cells immobilized in loofa (Luffa cylindrica) sponge. Ph.D. Thesis, University of Tsukuba, Japan.
Sharma, S., Pandey, M. and Saharan, B. (2002), Fermentation of ethanol by an amylolytic yeast Saccharomyces diastaticus SM-10. Indian J. Exp. Biol., 40, 325-328.
Shiiba, K.; Yamada, H.; Hara, H.; Okada, K. and Nagao, S. (1993), Purification and characterization of two arabinoxylans from wheat bran. Cereal Chem.,
70, 209-214.
Sree, N. K.; Sridhar, M.; Suresh, K.; Banat, I. M. and Rao, L. V. (2000), High alcohol production by repeated batch fermentation using an immobilized osmotolerant Sacch. cerevisiae. J. Ind. Microbiol., 24, 222-226.
Sree, N. K.; Sridhar, M.; Suresh, K. and Rao, L. V. (1999), High ethanol production by solid substrate fermentation from starchy substrates using thermotolerant Saccharomyces cerevisiae. Bioprocess Eng., 20, 561-563.
Thomas, K. C.; Hynes, S. H.; Jones, A. M. and Ingledew, W. M. (1993), Appl. Biochem. Biotechnol.,
43, 211-226.