ISSN 0101-2061 Food Science and Technology
OI:
D http://dx.doi.org/10.1590/1678-457X.0010
1 Introduction
With increased production and consumption of foods, alternatives are needed to implement cleaner production, with the aim of preserving the environment and reducing costs. The industrial processing of grapes generates a high quantity of a by-product called pomace, which includes skin, seeds and rachis, and which corresponds to about 20% of the grapes used in processing. In Brazil, grapes are produced in all regions, totaling an area of 81,000 hectares. The largest amount of production of wine, grape juice and derivatives is in the state of Rio Grande do Sul, where nearly 330 million liters are produced every year (Piovesana et al., 2013; Brasil, 2015). The solid residues generated in this process are usually transformed into animal feed and fertilizers and they are often discarded incorrectly on the land. Taking this into consideration, grape pomace can be used as a food ingredient because it has a high content of fiber and antioxidant compounds, which not only add value to the final product but also be one more source of income for grape juice and wine industries (Sant’Anna et al., 2014).
Cookies are well accepted and eaten by people of all ages, and the addition of functional ingredients can add nutritional value to the product, as well as generating more purchase appeal (Santos et al., 2014). Cookies are snacks, which can be easily enriched with grape pomace, an underutilized coproduct from the wine-making industry that is rich in bioactive compounds (Iora et al., 2015). Bakery products have a high concentration
of carbohydrates and recent studies have indicated that the partial replacement of refined wheat flour by whole flours or flours made with fruits, such as barley flour and wheat bran, papaya pulp flour, apple fiber, lemon, grape and wheat flour is a valuable strategy to increase the fibers ingestion (Sharma & Gujral, 2014).
Polyphenols and their sources have been widely studied due to their effects on human health and they are considered to be a great potential ingredient for the composition of food formulations or supplements. Phenolic compounds have significant potential antimicrobial, anti-inflammatory, and antioxidant properties in humans (Lewis et al., 2013). Although some researchers still use the ‘one-factor -at-a-time’ approach to develop new products, the use of experimental design in the development of fortified foods has increased because it facilitates the investigation of the interaction between the effects of variables through mathematical models and response surface methodology. This statistical technique has been used to study the effects of orange pomace in the production of gluten-free bread (O’Shea et al., 2015), in the acceptance of a prebiotic beverage made with cashew nut and passion fruit juice (Rebouças et al., 2014), in the development of cookies enriched with added guava peel (Bertagnolli et al., 2014), and in the optimization of probiotic yogurts (Cruz et al., 2010). Based on the need to provide a better utilization of grape pomace from wine and grape juice companies, allied to the need
Effects of whole-wheat flour and bordeaux grape pomace (
Vitis labrusca
L.) on the
sensory, physicochemical and functional properties of cookies
Ariadne Roberto KARNOPP1, Amanda Miléo FIGUEROA1, Paulo Ricardo LOS1, Jéssica Cristine TELES1,
Deise Rosana Silva SIMÕES1, Ana Cláudia BARANA1, Fernanda Taborda KUBIAKI1,
João Guilherme Baggio de OLIVEIRA1, Daniel GRANATO1*
Received 12 Sept., 2015 Accepted 29 Oct., 2015
1Graduate Program in Food Science and Technology, Universidade Estadual de Ponta Grossa – UEPG, Ponta Grossa, PR, Brazil
*Corresponding author: granatod@gmail.com
Abstract
Grape pomace, which is derived from the skin and seeds, is the residue from the production of grape juice and wine. It corresponds to up to 20% of the total volume and it contains a high level of dietary fibers and bioactive compounds. In the Brazilian market, there is no product containing grape pomace as a replacement for conventional wheat flour. Thus, this study aimed to assess the effects of whole-wheat flour and organic Bordeaux grape pomace (Vitis labrusca L.) on the sensory, physicochemical and functional properties of cookies using response surface methodology (RSM). The regression models indicated that the addition of whole-wheat and organic grape pomace decreased (p < 0.0001) the water activity and significantly increased the content of fibers, hardness, brittleness, antioxidant activity and total phenolic content of the cookies. The RSM models presented suitable R2 and R2
adj values (> 65% of explained data variability), except for brittleness. The sensory evaluation results revealed that no significant differences (p > 0.05) were observed for the cookie samples, implying that the addition of grape pomace and whole-wheat flour did not negatively affect the preference of cookies.
Keywords: dietary fibers; antioxidants; sensory analysis; response surface methodology.
Practical Application: Food companies can use this article as a basis of food development by adding grape pomace in cookies,
to replace conventional (white) wheat flour in food products by adding whole-wheat flour, this study aimed to assess the effects of whole-wheat flour and organic Bordeaux grape pomace (Vitis labrusca L.) on the sensory, physicochemical, physical and functional properties of cookies using response surface methodology.
2 Materials and methods 2.1 Chemicals
Gallic acid and 2,2-diphenyl-1-picrylhydrazyl (DPPH) were acquired from Sigma Aldrich (St. Louis, USA); ethyl and methyl alcohols (UV/HPLC grade) as well the ascorbic acid (99% purity) were obtained from Vetec (Rio de Janeiro, Brazil). All solvents and other chemicals used in the physicochemical analyses were of analytical grade and the solutions were prepared using ultrapure water (Millipore, SP, Brazil).
2.2 Raw materials and characterization of grape pomace flour
The raw material used for the development of the cookies was acquired in local markets (Ponta Grossa, PR, Brazil). The dried organic Bordeaux grape pomace, which is composed of skin and partially defatted seeds, was donated by the Uva’Só company (Bento Gonçalves, RS, Brazil), which is certified for organic production of grape-based products. The grape pomace was ground and sieved (28 Tyler mesh) and chemically characterized by quantifying the dietary fiber content according to Association of Official Analytical Chemists (2005). To quantify the total phenolic content (Singleton et al., 1999) and free-radical scavenging activity toward DPPH radical (Granato et al., 2015), Bordeaux grape pomace (10 g) was extracted following the procedures described by Deng et al. (2011).
2.3 Experimental design and formulation of cookies
The cookies were made from a base formulation containing flour (46.5 g/100 g), organic brown sugar (25 g/100 g), water (12.4 g/100 g), vegetable oil (10 g/100 g), organic purple grape juice (5 g/100 g – Uva’Só Company), baking powder (0.8 g/100 g) and sodium chloride (0.3 g/100 g). One part of the added flour was substituted by 50% in the mixture of whole-wheat flour (WWF) and grape pomace flour (GP), according to a 22 factorial design with three central points, totaling seven cookie formulations. The independent factors were the organic Bordeaux grape pomace (20, 25, 30 g/100 g) and whole-wheat flour (30, 40, 50 g/100 g). These levels were established after an initial experiment which contained equal proportions of whole-wheat flour and grape pomace flour to adjust the formulation. According to the experimental design, assay 1 contained 30% WWF + 20% GP, assay 2 (50% WWF + 20% GP), assay 3 (30% WWF + 30% GP), assay 4 (50% WWF + 30% GP), and assays 5, 6, and 7 were the center point (40% WWF + 25% GP). For the development of cookies, the flours were mixed in the proportions as planned and then this mixture was added to the other ingredients, which were homogenized by hand until a homogeneous mass was obtained. Subsequently, the cookies were formed and patterned to 3 cm diameter and 0.5 cm thickness, arranged in baking sheets, and baked in an oven at 200 °C for 10 minutes.
2.4 Physicochemical composition and instrumental texture profile
The moisture, ash, protein, lipids and crude fiber contents were determined according to the Association of Official Analytical Chemists (2005) official procedures (methods 925-09, 923-03, 920-87, 920-85 and 978-19, respectively). The instrumental color parameters of the cookies were determined using a colorimeter (model MiniScan EZ 4500L, HunterLab, USA) and results were reported as L* (lightness), a* (red-green), and b* (yellow-blue). The expansion rate (Ec) of the cookies after baking was calculated by Ec = [(v2-v1)/v1] * 100, where v1 is the volume of the raw dough and v2 is the volume of the baked dough (final cookie) (Bolanho et al., 2014).The water activity was determined using an AquaLab device (Model Series 3TE, Pullman-WA, USA). The texture profile (hardness and brittleness) was determined using a texturometer (model TA-XT2 Plus Stable Micro Systems),
with Wedge Fracture (A/WEG) probe, and the parameters used in the tests were: test speed 2.0 mm/s, distance 12 mm, and 20 g of sensitivity of the device.
2.5 Sensory analysis
Sensory evaluation was performed in a Sensory Analysis Laboratory and the research protocol was approved by the Ethics Committee under number 673.493. Forty-five individuals, who regularly consumed cookies (at least once a week) were selected to participate. There were 32 females and 13 males, aged between 18 and 45, who analyzed each cookie monadically, in which the cookies (3 cm diameter) were served individually. To evaluate the five samples (only one cookie at the center point was assessed), a preference ranking test was applied, in which the assessors were presented with all the samples and asked to rank them from the “most preferred” to the “less preferred”. Using the Friedman test, significant differences between samples were investigated using Friedman’s Equation 1:
( )
(
12 2)
( )12
... 3 1
. 1 n
F value S S Ev t
Ev t t
− = + + − +
+ (1)
Where Ev is the evaluator, t is the number of treatments (samples) and Si is the sum of the orders for each treatment (International Organization for Standardization, 2006). The F-value needs to be compared to a critical value, i.e. if the F-value is higher than the critical value there is significant difference in preference between the samples.
means of the scores utilized in the scale and the results were expressed in percentage.
2.6 Determination of total phenolic content and antioxidant activity
The extracts of the cookies were prepared using the experimental procedures described by Pasqualone et al. (2014) with minor modifications. The total phenolic content in the cookie extracts was estimated using the Prussian-Blue assay (Margraf et al., 2015). The results were expressed as mg gallic acid equivalents/100 g of cookie. The DPPH scavenging activity of the extracts was analyzed according to Granato et al. (2015). The antioxidant capacity (% inhibition) was calculated as % of scavenging activity = [1-(A517 sample/A517 blank)] × 100.
2.7 Statistical analysis
Analyses were performed in triplicate and the results were expressed as means followed by the standard deviation. One-way analysis of variances (ANOVA) was used to assess the intrinsic differences between the cookie samples, and the mean values were compared using Fisher’s LSD test, when at least one pair of samples was shown to be different (pAnova < 0.05) (Granato et al., 2014a). In an attempt to assess the quantitative effects of the independent variables (organic grape pomace and whole-wheat flour) on the responses, multiple linear regression based on the response surface methodology was applied when a significant difference (pAnova < 0.05) was found for at least a pair of cookie samples (Granato et al., 2014b). The statistical quality of the RSM models was assessed by means of the coefficient of determination (R2) and adjusted (R2
adj) coefficient (Szydlowska-Czerniak et al., 2015). All statistical analyses were carried out using Statistica v.7 (Statsoft, Tulsa, USA) and Action v. 2.5 (Statcamp, Brazil) software.
3 Results and discussion
3.1 Sensory properties, proximate composition, and texture profile of cookies
The Bordeaux organic pomace presented total fibers = 63.88 ± 1.05 g/100 g, in which 55.84 ± 0.63 g/100 g represents insoluble fibers and 8.04 ± 0.77 g/100 g represents
soluble fibers, total phenolic content = 2.180 ± 35 mg gallic acid equivalents/100 g, and antioxidant activity toward DPPH radical = 1.574 ± 9 mg ascorbic acid equivalents/100 g. These data and bioactive compounds content are in-line with data on grape pomace produced in Brazil (Deng et al., 2011; Sousa et al., 2014).
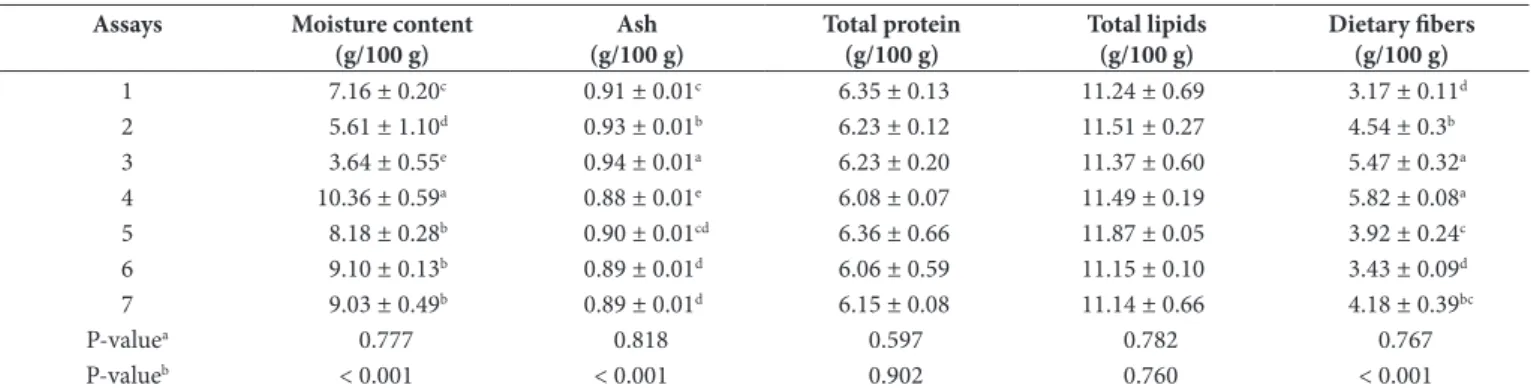
The results of the proximate composition of the cookies are shown in Table 1. The moisture content showed significant differences (p < 0.001) between the samples and obtained a maximum of 10.36 g/100 g and a minimum of 3.64 g/100 g. In Brazil, the National Health Surveillance Agency (Brasil, 2005) stipulates that the maximum moisture content is up to 15 g/100 g. The ash and crude fiber content also showed significant differences (p < 0.001) between the cookie formulations, while the contents of proteins (p = 0.902) and lipids (p = 0.760) were not affected by differences in the whole-wheat flour and grape pomace. In a similar study, which used the partial replacement of white flour by alternative ingredients in the preparation of cookies, Bolanho et al. (2014) achieved mean values of 11.18 g/100 g for moisture, 17.15 g/100 g for protein, 4.43 g/100 g of lipids and 5.60 g/100 g of crude fibers, using S. platensis biomass. Similarly, Bertagnolli et al. (2014) obtained a variation in moisture content (2.7 to 42 g/100 g) for cookies that were prepared using guava peel instead of wheat flour; they also found mean levels of 3.8 g/100 g for ash, 4.7 g/100 g for protein, 4.40 g/100 g for lipids, and 3.43 g/100 g for crude fiber.
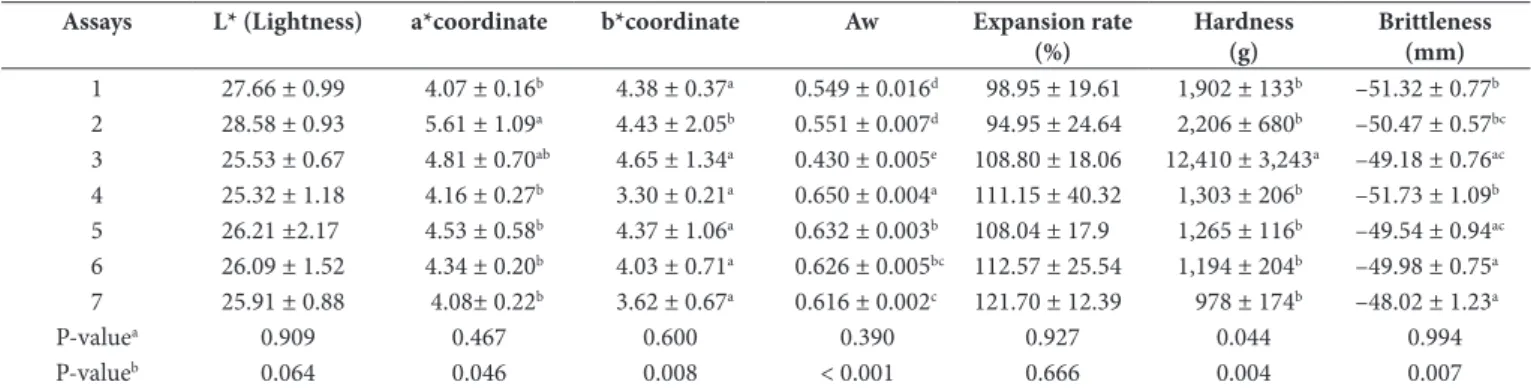
Table 2 shows the physical properties of the different cookie formulations. No evident discrepancy was observed for instrumental lightness (p = 0.064) and expansion rate (p = 0.666). On the other hand, the coordinates a* (p = 0.046) and b* (p = 0.008) were different between the cookie samples. The water activity ranged (p < 0.001) from 0.430 to 0.650, and this property was highly influenced by the fibers in the grape pomace and whole-wheat flour because the fibers have the ability to bind the available water, which helps to reduce moisture loss during storage. The Formulation 3 (13.95 g/100 g grape pomace and 13.95 g/100 g whole-wheat flour) was harder, differing statistically from the other formulations. It consisted of a lower percentage of whole-wheat flour and a higher percentage of grape pomace. Thus, this sample had a lower amount of gluten, which provided lower levels of hardness to the product and higher fiber content.
Table 1. Proximal composition of cookies.
Assays Moisture content
(g/100 g)
Ash (g/100 g)
Total protein (g/100 g)
Total lipids (g/100 g)
Dietary fibers (g/100 g)
1 7.16 ± 0.20c 0.91 ± 0.01c 6.35 ± 0.13 11.24 ± 0.69 3.17 ± 0.11d
2 5.61 ± 1.10d 0.93 ± 0.01b 6.23 ± 0.12 11.51 ± 0.27 4.54 ± 0.3b
3 3.64 ± 0.55e 0.94 ± 0.01a 6.23 ± 0.20 11.37 ± 0.60 5.47 ± 0.32a
4 10.36 ± 0.59a 0.88 ± 0.01e 6.08 ± 0.07 11.49 ± 0.19 5.82 ± 0.08a
5 8.18 ± 0.28b 0.90 ± 0.01cd 6.36 ± 0.66 11.87 ± 0.05 3.92 ± 0.24c
6 9.10 ± 0.13b 0.89 ± 0.01d 6.06 ± 0.59 11.15 ± 0.10 3.43 ± 0.09d
7 9.03 ± 0.49b 0.89 ± 0.01d 6.15 ± 0.08 11.14 ± 0.66 4.18 ± 0.39bc
P-valuea 0.777 0.818 0.597 0.782 0.767
P-valueb < 0.001 < 0.001 0.902 0.760 < 0.001
aProbability value obtained by the Brown-Forsythe test for homogeneity of variances. bProbability value obtained by one-way ANOVA. Different letters in the same column represent
The total phenolic content and free-radical scavenging activity toward the DPPH radical of the cookie extracts are shown in Table 3. The enrichment of the cookies with Bordeaux grape pomace promoted a significant increase (p = 0.005) in total phenolic compounds. The cookies formulated with the highest amount of grape pomace and whole-wheat flour had higher (p < 0.001) antioxidant activity. Similar results were found by Pasqualone et al. (2014), where cookies made with grape marc extract inhibited 48% of the DPPH radical. This result clearly indicates that the phenolic compounds present in grape pomace and whole-wheat flour (partially) remained in the cookies after baking at a high temperature.
The sensory ranking test applied to five different cookies (the replicates in the center point were not assessed) originated
a response for the Fobserved-value of 2.50. Comparing this value
with the Fcrictical of 9.49, it is possible to imply that there was no difference (p > 0.05) in sensory preference between the samples at 95% confidence. As is widely known, the preference that is checked in sensory evaluation does not indicate the acceptance or liking of a certain food. Therefore, an hedonic test based on a nine-point structured scale was chosen to compare the two samples that had the lowest sum of orders (cookies with 20 g/100 g grape pomace and 30 g/100 g whole-wheat flour added, or 50 g/100 g added whole wheat flour), which showed a tendency of preference in relation to the other samples, although it was not statistically significant. The results shown in Table 4 were obtained from overall acceptance, degree of liking of appearance, texture and flavor, and purchase intent for the two formulations and no difference was obtained.
Table 2. Instrumental color, water activity, and physical properties of cookies.
Assays L* (Lightness) a*coordinate b*coordinate Aw Expansion rate
(%)
Hardness (g)
Brittleness (mm)
1 27.66 ± 0.99 4.07 ± 0.16b 4.38 ± 0.37a 0.549 ± 0.016d 98.95 ± 19.61 1,902 ± 133b –51.32 ± 0.77b
2 28.58 ± 0.93 5.61 ± 1.09a 4.43 ± 2.05b 0.551 ± 0.007d 94.95 ± 24.64 2,206 ± 680b –50.47 ± 0.57bc
3 25.53 ± 0.67 4.81 ± 0.70ab 4.65 ± 1.34a 0.430 ± 0.005e 108.80 ± 18.06 12,410 ± 3,243a –49.18 ± 0.76ac
4 25.32 ± 1.18 4.16 ± 0.27b 3.30 ± 0.21a 0.650 ± 0.004a 111.15 ± 40.32 1,303 ± 206b –51.73 ± 1.09b
5 26.21 ±2.17 4.53 ± 0.58b 4.37 ± 1.06a 0.632 ± 0.003b 108.04 ± 17.9 1,265 ± 116b –49.54 ± 0.94ac
6 26.09 ± 1.52 4.34 ± 0.20b 4.03 ± 0.71a 0.626 ± 0.005bc 112.57 ± 25.54 1,194 ± 204b –49.98 ± 0.75a
7 25.91 ± 0.88 4.08± 0.22b 3.62 ± 0.67a 0.616 ± 0.002c 121.70 ± 12.39 978 ± 174b –48.02 ± 1.23a
P-valuea 0.909 0.467 0.600 0.390 0.927 0.044 0.994
P-valueb 0.064 0.046 0.008 < 0.001 0.666 0.004 0.007
aProbability value obtained by the Brown-Forsythe test for homogeneity of variances. bProbability value obtained by one-way ANOVA or Welch-ANOVA. Different letters in the same
column represent statistically different results.
Table 3. Total phenolic content and free-radical scavenging activity of cookies.
Assays Whole-wheat flour
(g/100 g)
Grape pomace (g/100 g)
Total phenolic content (mg GAE/100 g)
DPPH (% inhibition)
1 30 20 23.98 ± 8.28c 17.83 ± 2.55c
2 50 20 35.81 ± 1.25b 19.31 ± 1.74c
3 30 30 48.08 ± 2.66a 33.55 ± 1.84b
4 50 30 46.31 ± 1.09a 40.51 ± 4.51a
5 40 25 42.66 ± 3.12ab 32.70 ± 0.09b
6 40 25 45.09 ± 3.75a 35.39 ± 1.90ab
7 40 25 43.44 ± 1.41ab 34.37 ± 1.52b
P-valuea 0.582 < 0.001
P-valueb 0.005 0.033
aProbability value obtained by the Brown-Forsythe test for homogeneity of variances. bProbability value obtained by Welch-ANOVA. Different letters in the same column represent
statistically different results.
Table 4. Sensory analysis data of the two most preferred cookies.
Acceptancea Purchase intentb Appearancea Texturea Flavora
Formulation 1 6.84 ± 1.23 3.49 ± 0.86 6.47 ± 1.26 6.84 ± 1.72 7.23 ± 1.15
Formulation 2 7.05 ± 1.21 3.74 ± 0.82 6.54 ± 1.56 6.88 ± 1.48 6.91 ± 1.43
P-valuec 0.920 0.681 0.232 0.346 0.167
P-valued 0.429 0.245 0.877 0.893 0.247
Hedonic test (n = 45 consumers) comparing the cookies with added 20 g/100 g grape pomace + 30 g/100 g whole-wheat flour (Formulation 1) and 20 g/100 g grape pomace + 50 g/100 g whole-wheat flour (Formulation 2). aValues are based on the evaluation performed using a nine-point hedonic scale. bValues are based on the evaluation performed using a five-point
Table 5. Regression coefficients and statistical parameters obtained by response surface methodology.
Properties Regression
coefficients
Standard error t-value p-value -95% confidence 95% confidence
Moisture content (g/100 g)
Mean 42.258 3.728 11.334 < 0.0001 34.354 50.162
(1)Whole-wheat flour (g/100 g) –0.905 0.090 –10.002 < 0.0001 –1.097 –0.713
(2)Grape pomace (g/100 g) –1.594 0.146 –10.892 < 0.0001 –1.904 –1.283
1 by 2 0.041 0.004 11.656 < 0.0001 0.034 0.049
R2 0.719
Adjusted R2 0.670
Ash (g/100 g)
Mean 0.563 0.037 15.095 < 0.0001 0.484 0.642
(1)Whole-wheat flour (g/100 g) 0.009 0.001 9.942 < 0.0001 0.007 0.011
(2)Grape pomace (g/100 g) 0.016 0.001 10.838 < 0.0001 0.013 0.019
1 by 2 0.000 0.000 –11.616 < 0.0001 0.000 0.000
R2 0.742
Adjusted R2 0.697
a* color coordinate (redness)
Mean –6.489 3.289 –1.973 0.066 –13.462 0.484
(1)Whole-wheat flour (g/100 g) 0.297 0.057 5.235 0.035 0.053 0.542
(2)Grape pomace (g/100 g) 0.404 0.092 4.402 0.048 0.009 0.800
1 by 2 –0.011 0.002 –4.938 0.039 –0.021 –0.001
R2 0.834
Adjusted R2 0.670
b* color coordinate (yellowness)
Mean –14.323 2.330 –6.147 0.025 –24.349 –4.298
(1)Whole-wheat flour (g/100 g) 0.593 0.057 10.494 0.009 0.350 0.837
(2)Grape pomace (g/100 g) 0.688 0.091 7.528 0.017 0.295 1.082
1 by 2 –0.022 0.002 –9.935 0.010 -0.032 –0.012
R2 0.881
Adjusted R2 0.761
Water activity
Mean 1.471 0.053 27.801 < 0.0001 1.359 1.583
(1)Whole-wheat flour (g/100 g) –0.022 0.001 –16.900 < 0.0001 –0.024 –0.019
(2)Grape pomace (g/100 g) –0.045 0.002 –21.462 < 0.0001 –0.049 –0.040
1 by 2 0.001 0.000 21.642 < 0.0001 0.001 0.001
R2 0.683
Adjusted R2 0.626
Dietary fibers (g/100 g)
Mean –6.965 1.988 –3.504 0.003 –11.179 –2.751
(1)Whole-wheat flour (g/100 g) 0.171 0.048 3.556 0.003 0.069 0.274
(2)Grape pomace (g/100 g) 0.384 0.078 4.923 0.000 0.219 0.549
1 by 2 –0.005 0.002 –2.713 0.015 –0.009 –0.001
R2 0.679
Adjusted R2 0.622
Hardness (g)
Mean –55130.45 7175.57 –7.68 < 0.0001 –70341.97 –39918.92
(1)Whole-wheat flour (g/100 g) 1153.22 174.12 6.62 < 0.0001 784.10 1522.33
(2)Grape pomace (g/100 g) 2757.78 281.59 9.79 < 0.0001 2160.85 3354.72
1 by 2 –56.90 6.83 –8.33 < 0.0001 –71.38 –42.42
R2 0.763
Adjusted R2 0.721
Total phenolic content (mg GAE/100 g)
Mean –81.14 31.152 –2.605 0.040 –157.370 –4.916
(1)Whole-wheat flour (g/100 g) 1.95 0.756 2.581 0.042 0.101 3.800
(2)Grape pomace (g/100 g) 4.45 1.222 3.640 0.011 1.458 7.439
1 by 2 –0.07 0.030 –2.293 0.062 –0.141 0.005
R2 0.805
Adjusted R2 0.722
Antioxidant activity (% inhibition of DPPH radical)
Mean –16.634 4.860 –3.423 0.014 –28.526 –4.742
(1)Grape pomace (g/100 g) 1.479 0.243 6.072 0.001 0.883 2.075
1 by 2 0.009 0.004 2.439 0.050 –0.000 0.018
R2 0.842
The two formulations garnered similar means (p > 0.05) for the degree of liking of appearance, texture and flavor, and the values were close to “I like it moderately” in the hedonic scale, which indicates the viability of adding whole-wheat flour and grape pomace in cookie formulation. The calculated acceptance index was 76% for Formulation 1 and 78.3% for Formulation 2, indicating that they were well accepted by the taste panel. Summing the categories that included on the positive side of the scale, i.e. the intention to buy the product (scores 4 and 5), these two formulations obtained 49% and 63% respectively. This result indicates that cookie formulations need to be optimized to stimulate consumption.
3.2 Response Surface Modelling (RSM)
For the responses that presented differences (p < 0.05) for at least a pair of cookie formulations, RSM was applied to assess the effects of organic Bordeaux grape pomace and whole-wheat flour on the quality traits of the cookies (Table 5). According to the results, the moisture content was influenced (p < 0.001) by both whole-wheat flour and grape pomace, and the linear interaction was also significant. The regression model was able to explain up to 72% of data variability. The ash content had a positive increase (p < 0.001) due to the linear effects of the grape pomace and whole-wheat flour, as well as their linear interaction, and the multiple regression model was able to explain 74.2% of the experimental data.
The regression models indicated that the addition of whole-wheat flour and organic grape pomace decreased (p < 0.0001) the water activity and significantly increased the content of fibers, hardness, antioxidant activity and total phenolic content. The RSM models presented a considerable R2 and R2
adj (> 65% of explained data variability), except for brittleness, which means that in future experiments, if the exact experimental conditions adopted in the current study are followed, the models can be used to have an idea of the predicted mean values for those responses. A statistically significant difference between the cookie formulations was recorded for antioxidant activity (p = 0.033). From the regression equation shown in Table 5, only the linear effect of grape pomace and the interaction between whole-wheat flour and grape pomace significantly increased the antioxidant activity of the cookies. Indeed, both ingredients contain bioactive substances, such as tocopherols and phenolic compounds that present recognized antioxidant activity in relation to reactive oxygen/nitrogen species (Aksoylu et al., 2015). The content of phenolic compounds in the cookies was relatively low and this can be explained because phenolic compounds, especially phenolic acids and anthocyanins, as well as some lipophilic antioxidants, are degraded when temperatures are higher than 80 °C (Sólyom et al., 2014). Figure 1 contains the response surface plot for some of the response variables assessed in the current work and facilitates the visualization of the effects of whole-wheat flour and organic grape pomace on the quality traits of cookies.
The results obtained shows that Bordeaux grape pomace can be extensively used in the industrial field. Sensory, nutritional and physicochemical characteristics in different types of products are improved, these characteristics enhance the value of the
final product, being an alternative ingredient for the production of healthier foods. Besides this, the Bordeaux grape pomace showed a considerable antioxidant activity, transferring these characteristics to the cookies.
4 Conclusion
This study showed that the development of cookies with added grape pomace is feasible and the product contain a high-fiber content, with a significant antioxidant activity. The RSM modeling was effective in quantifying the effects of whole-wheat flour and grape pomace on several quality attributes of cookies and may be used as a tool to optimize the cookie formulation.
Lewis, W. E., Harris, G. K., Sanders, T. H., White, B. L., & Dean, L. L. (2013). Antioxidant and anti-inflammatory effects of peanut skin extracts. Food and Nutrition Sciences, 4(08), 22-32. http://dx.doi. org/10.4236/fns.2013.48A003.
Margraf, T., Karnopp, A. R., Rosso, N. D., & Granato, D. (2015). Comparison between Folin-Ciocalteu and Prussian Blue assays to estimate the total phenolic content of juices and teas using 96-well microplates. Journal of Food Science, 80(11), C2397-C2403. http:// dx.doi.org/10.1111/1750-3841.13077. PMid:26448565.
O’Shea, N., Rößle, C., Arendt, E., & Gallagher, E. (2015). Modelling the effects of orange pomace using response surface design for gluten-free bread baking. Food Chemistry, 166, 223-230. http://dx.doi. org/10.1016/j.foodchem.2014.05.157. PMid:25053049.
Paixão, J. A., Rodrigues, J. P., Esmerino, E. A., Cruz, A. G., & Bolini, H. M. A. (2014). Influence of temperature and fat content on ideal sucrose concentration, sweetening power, and sweetness equivalence of different sweeteners in chocolate milk beverage. Journal of Dairy Science, 97(12), 7344-7353. http://dx.doi.org/10.3168/jds.2014-7995. PMid:25606602.
Pasqualone, A., Bianco, A. M., Paradiso, V. M., Summo, C., Gambacorta, G., & Caponio, F. (2014). Physico-chemical, sensory and volatile profiles of biscuits enriched with grape marc extract. Food Research International, 65, 385-393. http://dx.doi.org/10.1016/j. foodres.2014.07.014.
Piovesana, A., Bueno, M. M., & Klajn, V. M. (2013). Elaboração e aceitabilidade de biscoitos enriquecidos com aveia e farinha de bagaço de uva. Brazilian Journal of Food Technology, 16(1), 68-72. http://dx.doi.org/10.1590/S1981-67232013005000007.
Rebouças, M. C., Rodrigues, M. C. P., & Afonso, M. R. A. (2014). Optimization of the acceptance of prebiotic beverage made from cashew nut kernels and passion fruit juice. Journal of Food Science, 79(7), 1393-1398. http://dx.doi.org/10.1111/1750-3841.12507. PMid:24961964.
Sant’Anna, V., Christiano, F. D. P., Marczak, L. D. F., Tessaro, I. C., & Thys, R. C. S. (2014). The effect of the incorporation of grape marc powder in fettuccini pasta properties. LWT-. Food Science & Technology International, 58, 497-501.
Santos, D. S. D., Storck, C. R., & Fogaça, A. O. (2014). Biscuit made with addition of lemon peel flour. Disciplinarum Scientia – Revista Brasileira de Ciências e Saúde, 15, 123-135.
Sharma, P., & Gujral, H. S. (2014). Cookie making behavior of wheat– barley flour blends and effects on antioxidant properties. LWT – Food Science and Technology, 55(1), 301-307. http://dx.doi.org/10.1016/j. lwt.2013.08.019.
Singleton, V. L., Orthofer, R., & Lamuela-Raventos, R. M. (1999). Analysis of total phenols and other oxidation substrates and antioxidants by means of Folin-Ciocalteu reagent. Methods in Enzymology, 299, 152-178. http://dx.doi.org/10.1016/S0076-6879(99)99017-1. Sólyom, K., Solá, R., Cocero, M. J., & Mato, R. B. (2014). Thermal
degradation of grape marc polyphenols. Food Chemistry, 159, 361-366. http://dx.doi.org/10.1016/j.foodchem.2014.03.021. PMid:24767067. Sousa, E. C., Uchôa-Thomaz, A. M. A., Carioca, J. O. B., Morais, S.
M., Lima, A., Martins, C. G., Alexandrino, C. D., Ferreira, P. A. T., Rodrigues, A. L. M., Rodrigues, S. P., Silva, J. N., & Rodrigues, L. L. (2014). Chemical composition and bioactive compounds of grape pomace (Vitis vinifera L.), Benitaka variety, grown in the semiarid region of Northeast Brazil. Food Science and Technology, 34, 135-142. Szydlowska-Czerniak, A., Tulodziecka, A., Karlovits, G., & Szlyk, E.
(2015). Optimisation of ultrasound-assisted extraction of natural antioxidants from mustard seed cultivars. Journal of the Science of Food and Agriculture, 95(7), 1445-1453. PMid:25060714.
Acknowledgements
Authors express their gratitude to CAPES for the MSc scholarships and to Econatura-Uva’Só (Bento Gonçalves, RS, Brasil) for providing the grape pomace.
References
Aksoylu, Z., Cagindi, O., Kose, E. (2015). Effects of blueberry, grape seed powder and poppy seed incorporation on physicochemical and sensory properties of biscuit. Journal of Food Quality, 38(3), 164-174. Association of Official Analytical Chemists – AOAC. (2005). Official
methods of analysis of the Association of Official Analytical Chemists
(18th ed.). Gaithersburg: AOAC International.
Bertagnolli, S. M. M., Silveira, M. L. R., Fogaça, A. O., Umann, L., & Penna, N. G. (2014). Bioactive compounds and acceptance of cookies made with guava peel flour. Food Science and Technology (Campinas.), 34(2), 303-308. http://dx.doi.org/10.1590/fst.2014.0046. Bolanho, B. C., Egea, M. B., Jácome, A. L. M., Campos, I., Carvalho,
J. C. M., & Danesi, E. D. G. (2014). Antioxidant and nutritional potential of cookies enriched with Spirulina platensis and sources of fibre. Journal of Food & Nutrition Research, 53, 171-179. Brasil, Agência Nacional de Vigilância Sanitária. (2005, September
22). Resolução RDC nº 263, de 22 de setembro de 2005: aprova o regulamento técnico para produtos de cereais, amidos, farinhas e farelos. Diário Oficial [da] República Federativa do Brasil.
Brasil, Ministério da Agricultura, Pecuária e Abastecimento. (2015).
Uva. Brasília, MAPA. Retrieved from http://www.agricultura.gov. br/vegetal/culturas/uva.
Cruz, A. G., Faria, J. A. F., Walter, E. H. M., Andrade, R. R., Cavalcanti, R. N., Oliveira, C. A. F., & Granato, D. (2010). Processing optimization of probiotic yogurt containing glucose oxidase using response surface methodology. Journal of Dairy Science, 93(11), 5059-5068. http:// dx.doi.org/10.3168/jds.2010-3336. PMid:20965320.
Deng, Q., Penner, M. H., & Zhao, Y. (2011). Chemical composition of dietary fiber and polyphenols of five different varieties of wine grape pomace skins. Food Research International, 44(9), 2712-2720. http://dx.doi.org/10.1016/j.foodres.2011.05.026.
Granato, D., Calado, V. M. A., & Jarvis, B. (2014a). Observations on the use of statistical methods in food science and technology. Food Research International, 55, 137-149. http://dx.doi.org/10.1016/j. foodres.2013.10.024.
Granato, D., Grevink, R., Zielinski, A. A. F., Nunes, D. S., & van Ruth, S. M. (2014b). Analytical strategy coupled with response surface methodology to maximize the extraction of antioxidants from ternary mixtures of green, yellow, and red teas (Camellia sinensis
var. sinensis). Journal of Agricultural and Food Chemistry, 62(42), 10283-10296. http://dx.doi.org/10.1021/jf504480f. PMid:25270398. Granato, D., Koot, A., Schnitzler, E., & Van Ruth, S. M. (2015).
Authentication of geographical origin and crop system of grape juices by phenolic compounds and antioxidant activity using chemometrics. Journal of Food Science, 80(3), C584-C593. http:// dx.doi.org/10.1111/1750-3841.12794. PMid:25675840.
International Organization for Standardization – ISO. (2006). ISO 8587: sensory analysis: methodology: ranking. Geneva: ISO.
International Organization for Standardization – ISO. (2014). ISO 11136: sensory analysis: methodology: general guidance for conducting hedonic tests with consumers in a controlled area. Geneva: ISO.
Iora, S. R. F., Maciel, G. M., Zielinski, A. A. F., Silva, M. V., Pontes, P. V. A., Haminiuk, C. W. I., & Granato, D. (2015). Evaluation of the bioactive compounds and the antioxidant capacity of grape pomace.