Evaluation of special grains bean lines for grain yield, cooking time
and mineral concentrations
Nerinéia Dalfollo Ribeiro1*, Josana de Abreu Rodrigues1, Marina Prigol1, Cristina Wayne Nogueira1, Lindolfo Storck1 and Eduardo Muller Gruhn1
Received 14 March 2013
Accepted 10 November 2013
Abstract – Genetic variability of 32 inbred special grains bean lines was investigated for grain yield, mass of 100 grains, cooking time, and mineral concentrations in grains, and Z index was used for selection of superior lines in most of the characters. IAC Cen-tauro, IAC Galante, Xamego, Ouro Branco, Montcalm, and Hooter lines presented high yield grain, short cooking time (less than 24 min), and high potassium (>14 g kg-1 dry matter [DM]), calcium (>1.42 g kg-1 DM), iron (>97.60 mg kg-1 DM), zinc (>29.05 mg kg-1
DM) and copper (>8.67 mg kg-1 DM) concentrations, and their dietary use is therefore recommended. Cal-96 line presents higher Z
index for grain yield and for the most of the minerals, and its use is recommended for crosses for the development of superior lines.
Key words:Phaseolus vulgaris, nutritional quality, genetic variability, Z index. Crop Breeding and Applied Biotechnology 14: 15-22 2014
Brazilian Society of Plant Breeding. Printed in Brazil
ARTICLE
1 Universidade Federal de Santa Maria, Departamento de Fitotecnia, 97.105-900, Santa Maria, RS, Brasil. *E-mail: [email protected] INTRODUCTION
Common bean (Phaseolus vulgaris L.) presents two centers of domestication: the Middle American, with Me-soamericana, Jalisco and Durango races of small grains; and the Andean, with Nueva Granada, Peru and Chile races with medium to large grains (Singh et al. 1991). Beans were gradually dispersed around different countries, and today there is a marked regional preference for grains of different colors, sizes and forms.
In Brazil, 85% of beans consumed belong to the Meso-americana race, with carioca tegument (beige with brown streaks) and black color. These grains present mass of 100 grains lower than 25 g; therefore, they are considered
small by the classification of Blair et al. (2010). There are
no countries importing carioca beans, and its consumption is restricted to the Brazilian market. National black beans
production is sometimes insufficient for supplying the do
-mestic market, and they may be imported from Argentina, or from the United States. Since Brazil is the biggest bean producer and consumer worldwide (FAO 2011), a
diver-sification in bean crops would be a determining factor for
the culture sustainability.
Beans of white, red, cream and yellow tegument – with coat pattern absent, or striped, or mottled, are well accepted in the international market, but the Brazilian production is
quite inexpressive due to the lack of the adapted cultivars with high grain yield. Grains nutritional value varies with the different types of beans. Islam et al. (2002) evaluated the mineral concentration of 1072 bean accessions stored in the Germplasm Bank of the International Center for Tropical Agriculture (CIAT), in Colombia, and evidenced that the germplasm of the Middle American gene pool presented higher calcium, phosphorus, sulphur and zinc concentrations, and lower iron concentration in the grains. Middle American beans accessions of the Institute of Agronomic Sciences of Rwanda also presented high zinc and low iron concentra-tions in the grains (Blair et al. 2010). However, Talukder et al. (2010), while evaluating bean genotypes grown in Colombia, the United States, Brazil and India observed that Middle American genotypes presented, on average, 16.1% more zinc and 11.3% more iron than Andean genotypes.
Beans of different tegument colors of Middle American or Andean origin, known as special grains bean, are more acceptable if, they present faster cooking times and higher grain yield, besides high nutritional value. Grains that in a few minutes of cooking acquire an adequate softness are preferable due to the economy of energy, and to the lower time taken for meals preparation (Rodrigues et al. 2005). Moreover, grain yield must be increased so that cultivation
When the selection is performed for many characters simultaneously, the use of selection indexes must be taken into consideration. Z index considers the sum of standardized variables for each plot (Mendes et al. 2009). Lines with the highest Z index sums are considered promising for selection, since they have presented superiority for most of the desir-able characters. The use of Z indexes endesir-abled the selection of common bean lines for each particular nutrient, or for the chemical composition as a whole (Silva et al. 2012).
Combined selection for grain yield, mass of 100 grains, and cooking and nutritional quality is a recent standard for
special grains bean, and literature in this field is extremely
scarce. Therefore, this work aimed at evaluating the genetic variability of special grains bean lines for grain yield, mass of 100 grains, cooking time and mineral concentration, and at using Z index for selection of superior lines in the most of characters.
MATERIAL AND METHODS
Seeds of 32 inbred special grains bean lines (Ph. vul-garis) were obtained from field experiments carried out in two growing season: normal rainy season (with sowing in October 2010), and dry season (with sowing in February 2011). All experiments were carried out in the Bean Breed-ing Program area at the Plant Science Department of the Federal University of Santa Maria, Brazil. Santa Maria lies in the Central Depression region of Rio Grande do Sul, southern Brazil (lat 29º 42’ S, long 53º 49 ’W and alt 95 m asl). Climate is temperate and rainy, with well-distributed rainfall throughout the year, and subtropical temperatures.
A randomized block experimental design was used, with three replications. Treatments consisted of evaluation of 32 inbred special grains bean lines, where 14 of them were of common lines at the two growing seasons (Light Red Kidney, Red Kanner, Ouro Branco, Montcalm, IPR Garça, Chinook, Hooter, BRS Radiante, Cal-96, Branco Graúdo, WAF 75, BRS Executivo, WAF 141 and BRS Embaixador). In the 2011 dry season, another 18 lines were included (IAC Galante, IAC Centauro, Xamego, BRS MG Realce, Rosinha G2, Vermelho Graúdo, Iraí, IAC Harmonia, IAC Jabola, OTG 01, Cranberry, OTG 07-09, TB 02-24, OTG 07-03, IAC Boreal, Dark Red Kidney, 38 MON p5-13 and IAC Esperança). In the experiment of 2010 normal rainy season, each plot consisted of four rows 4 m long, spaced 0.5 m apart, and the two central lines were used as useable area of 4 m2. In the experiment of 2011 dry season, plots consisted of two rows 4 m long, spaced 0.5 m apart, and with a useable area of 4 m2. In this in case, the use of smaller plots was necessary for homogeneity inside the block due to the great number of lines evaluated in the 2011 dry season.
Soil was typical alitic Argisol, Hapludalf, with the follow-ing chemical composition in the 2010 normal rainy season: pH (H20) = 5.7; organic matter = 2.0%; phosphorus = 4.5 mg dm-3; potassium = 112 mg dm-3; calcium = 6.3 cmol
c dm-3; and magnesium =2.8 cmol
c dm
-3. Soil was prepared in a conventional manner, and fertilization was performed based on the chemical soil analysis. Fertilizer used in sowing furrow was250 kg ha-1 of the 5-30-20 formula (nitrogen, phosphorus and potassium). In addition, nitrogen
fertiliza-tion was split in the growth stage of the first trifoliate leaves
(V3), at 20 kg ha-1 urea (45% of nitrogen). Micronutrients were not added to the fertilizer.
In the 2011 dry season, the experiment was carried out at the same location of the 2010 normal rainy season. Therefore, fertilization maintenance was carried out, as well as replacement of nutrient export. Fertilizer used in sowing furrow was 190 kg ha-1 of the 5-30-20 formula, and 20 kg ha-1 urea was split in the V3 growth stage.
Cultural treatments, and insect and weed control were carried out whenever necessary to rule out competition. Disease control was not carried out.
Plants were harvested and threshed by hand when ma-ture. Agricultural machinery and equipment were not used in the harvesting and processing of grains for avoiding contamination of samples with heavy metals. After manual removal of broken grains and impurities, grains were dried in a drying and sterilization oven with forced air circulation (65-70 °C) until they reached an average moisture content of 13%. Thus, grain yield (kg ha-1) and mass of 100 grains (g) were determined.
Evaluation of cooking time was carried out with 25 grains of each replication. Grains (25) were put in plastic cups of 200 ml and 50 ml distilled water were added. After eight hours of imbibition at room temperature (20 ± 2 oC), water was eliminated and grains were partially dried with paper towel and placed on the support plate of a Mattson’s cooking. The device has 25 pegs of 90 g, and 1.0 mm of diameter at the tip of the pegs. Each grain was positioned under a peg and the device was placed inside of a domestic
pressure pan of 7 liters, filled with 3 liters of boiling dis
-tilled water. The pan was kept over heating (with no lid) at
medium fire, and when the grain was cooked, peg fell and perforated the grain. The fall average time of the first 13 pegs
was registered as the cooking average time of each sample (Ribeiro et al. 2007). For minimizing the environmental effect, the cooking was carried out in air conditioned room
(20 oC), in the same position of the stove, at medium fire
and in the same pan.
For determination of mineral concentrations, 10 g grain samples from each line were randomly collected from each repetition. Samples were dried in an oven (65 to 70 ºC) until they reached an average moisture content of 13%, and then were weighed. Samples were ground in an analytical knife micromill for producing particles smaller than 1 mm.
Raw beans flour was digested with concentrated nitric
acid (HNO3),and perchloric acid (HClO4) (1/5, v/v) at 60 °C for 12 hours, according to the method described by Ribeiro et al. (2012). The analysis was carried out using an optical emission spectrometer with inductively coupled plasma (ICP-OES) equipped with a Cross Flow nebulizer. The operating conditions of ICP-OES equipment were previously established by Ribeiro et al. (2012), and selected analytical emission lines were automatically determined by the instrument.
Data obtained were submitted to analysis of variance, according to the random block model for grain yield (three replications), and completely randomized design for mass of 100 grains and cooking time (three replications), and mineral concentrations (two replications). Bartlett test (Steel et al. 1997) was applied to check homogeneity of variances of errors found at the two growing season. F test (p-value <0.05), was used for testing the hypotheses of main effects and interactions of growing season x line. Effect of lines
was considered fixed and the other ones (block, growing
season and interaction), random effects. In the joint vari-ance analysis, the interaction was estimated for the common lines at the two growing season, and for the comparison of
means, it was used the error mean square and degrees of freedom joint. Comparison of means was carried out using Scott-Knott’s test for lines (p-value =0.05).
Data of grain yield, mass of 100 grains, cooking time, potassium, calcium, iron, zinc and copper were standard-ized for parcel, making them directly comparable. Selection index (Z index) was estimated as described by Mendes et al. (2009). However, as the characters were determined using a different number of replications, Z index mean was considered for those characters present in j replication, and the constant with a value of three was added to avoid nega-tive values. Charts were marked to check the contribution given by each standardized character for Z index value,
facilitating the visual identification among lines with higher
Z index mean for all characters, using the same procedure described by Mendes et al. (2009). Analyses were carried
out with the aid of Microsoft Office Excel spreadsheets,
and Genes software (Cruz 2006).
RESULTS AND DISCUSSION
Variance of experimental error in the two growing seasons was homogeneous (p value >0.05), making the analysis of joint variance possible for all evaluated characters. Growing
season x line interaction was significant (p value <0.05) in
relation to grain yield, mass of 100 grains, cooking time and Z index (Table 1), characterizing a differentiated effect for special grains bean lines in reaction to the environment variation. For potassium, calcium, iron and copper
con-centrations, a significant effect was observed for growing
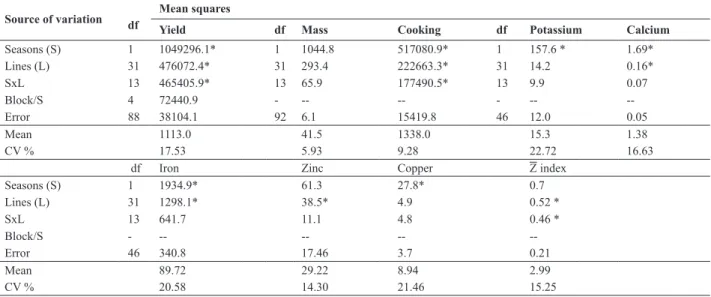
Table 1.Analysis of variance for grain yield (yield, in kg ha-1), mass of 100 grains (mass, g), cooking time (cooking, seconds), mineral concentration
in grains: potassium (g kg-1 of dry matter - DM), calcium (g kg-1 of DM), iron (mg kg-1 of DM), zinc (mg kg-1 of DM) and copper (g kg-1 of DM), and Z
index mean for special grains bean lines obtained in normal rainy and dry seasons
Source of variation df Mean squares
Yield df Mass Cooking df Potassium Calcium
Seasons (S) 1 1049296.1* 1 1044.8 517080.9* 1 157.6 * 1.69*
Lines (L) 31 476072.4* 31 293.4 222663.3* 31 14.2 0.16*
SxL 13 465405.9* 13 65.9 177490.5* 13 9.9 0.07
Block/S 4 72440.9 - -- -- - --
--Error 88 38104.1 92 6.1 15419.8 46 12.0 0.05
Mean 1113.0 41.5 1338.0 15.3 1.38
CV % 17.53 5.93 9.28 22.72 16.63
df Iron Zinc Copper Zindex
Seasons (S) 1 1934.9* 61.3 27.8* 0.7
Lines (L) 31 1298.1* 38.5* 4.9 0.52 *
SxL 13 641.7 11.1 4.8 0.46 *
Block/S - -- -- --
--Error 46 340.8 17.46 3.7 0.21
Mean 89.72 29.22 8.94 2.99
CV % 20.58 14.30 21.46 15.25
seasons. Calcium, iron and zinc concentrations showed a
significant effect for the lines.
Grain yield showed greater variation amplitude in nor-mal rainy season, from 354 kg ha-1 (BRS Embaixador) to 1,966 kg ha-1 (Light Red Kidney) (Table 2). The existence
of genetic variability provides the identification of more
productive lines for normal rainy season (Light Red Kid-ney, Red Kanner, Ouro Branco, Montcalm and IPR Garça), and for dry season (Cal-96, Branco Graúdo, IAC Galante e IAC Centauro).
A common accentuated reduction in bean grain yield can be observed during dry season in the south region of
Brazil since grain filling to harvest period often coincides
with the rainfall high intensity period, and small minimum temperature. However, Red Kanner, Chinook, BRS Radiante, and Cal-96 lines showed grain yield above 1,187 kg ha-1 at the two growing seasons, and could be indicated for the normal rainy and dry seasons.
Mass of 100 grains varied from 26.33 g (BRS Embaixa-dor, 2010 normal rainy season) to 55.60 g (WAF 75, 2011 dry season) (Table 2). In the normal rainy season, lines
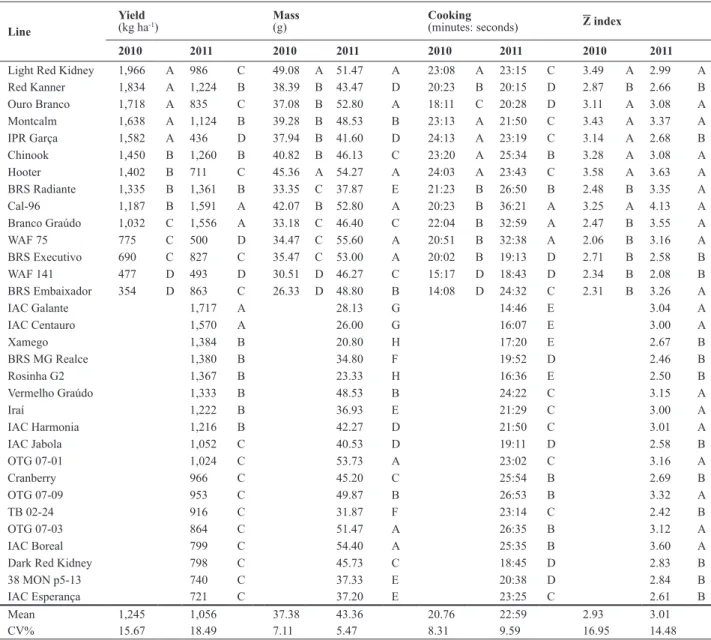
Table 2.Mean of grain yield (yield), mass of 100 grains (mass), cooking time (cooking), and Z index of special grains bean lines obtained in 2010 normal rainy season, and 2011 dry season
Line
Yield (kg ha-1)
Mass (g)
Cooking
(minutes: seconds) Z index
2010 2011 2010 2011 2010 2011 2010 2011
Light Red Kidney 1,966 A 986 C 49.08 A 51.47 A 23:08 A 23:15 C 3.49 A 2.99 A
Red Kanner 1,834 A 1,224 B 38.39 B 43.47 D 20:23 B 20:15 D 2.87 B 2.66 B
Ouro Branco 1,718 A 835 C 37.08 B 52.80 A 18:11 C 20:28 D 3.11 A 3.08 A
Montcalm 1,638 A 1,124 B 39.28 B 48.53 B 23:13 A 21:50 C 3.43 A 3.37 A
IPR Garça 1,582 A 436 D 37.94 B 41.60 D 24:13 A 23:19 C 3.14 A 2.68 B
Chinook 1,450 B 1,260 B 40.82 B 46.13 C 23:20 A 25:34 B 3.28 A 3.08 A
Hooter 1,402 B 711 C 45.36 A 54.27 A 24:03 A 23:43 C 3.58 A 3.63 A
BRS Radiante 1,335 B 1,361 B 33.35 C 37.87 E 21:23 B 26:50 B 2.48 B 3.35 A
Cal-96 1,187 B 1,591 A 42.07 B 52.80 A 20:23 B 36:21 A 3.25 A 4.13 A
Branco Graúdo 1,032 C 1,556 A 33.18 C 46.40 C 22:04 B 32:59 A 2.47 B 3.55 A
WAF 75 775 C 500 D 34.47 C 55.60 A 20:51 B 32:38 A 2.06 B 3.16 A
BRS Executivo 690 C 827 C 35.47 C 53.00 A 20:02 B 19:13 D 2.71 B 2.58 B
WAF 141 477 D 493 D 30.51 D 46.27 C 15:17 D 18:43 D 2.34 B 2.08 B
BRS Embaixador 354 D 863 C 26.33 D 48.80 B 14:08 D 24:32 C 2.31 B 3.26 A
IAC Galante 1,717 A 28.13 G 14:46 E 3.04 A
IAC Centauro 1,570 A 26.00 G 16:07 E 3.00 A
Xamego 1,384 B 20.80 H 17:20 E 2.67 B
BRS MG Realce 1,380 B 34.80 F 19:52 D 2.46 B
Rosinha G2 1,367 B 23.33 H 16:36 E 2.50 B
Vermelho Graúdo 1,333 B 48.53 B 24:22 C 3.15 A
Iraí 1,222 B 36.93 E 21:29 C 3.00 A
IAC Harmonia 1,216 B 42.27 D 21:50 C 3.01 A
IAC Jabola 1,052 C 40.53 D 19:11 D 2.58 B
OTG 07-01 1,024 C 53.73 A 23:02 C 3.16 A
Cranberry 966 C 45.20 C 25:54 B 2.69 B
OTG 07-09 953 C 49.87 B 26:53 B 3.32 A
TB 02-24 916 C 31.87 F 23:14 C 2.42 B
OTG 07-03 864 C 51.47 A 26:35 B 3.12 A
IAC Boreal 799 C 54.40 A 25:35 B 3.60 A
Dark Red Kidney 798 C 45.73 C 18:45 D 2.83 B
38 MON p5-13 740 C 37.33 E 20:38 D 2.84 B
IAC Esperança 721 C 37.20 E 23:25 C 2.61 B
Mean 1,245 1,056 37.38 43.36 20.76 22:59 2.93 3.01
CV% 15.67 18.49 7.11 5.47 8.31 9.59 16.95 14.48
with higher mass of 100 grains were Light Red Kidney and Hooter. In the dry season, Light Red Kidney, Ouro Branco, Hooter, Cal-96, WAF 75, BRS Executivo, OTG 07-01, OTG 07-03, and IAC Boreal lines were the top rank. Only Xamego and Rosinha G2 lines, of the Middle American gene pool, showed small grains, in accordance
with the classification proposed by Blair et al. (2010). The
other lines belong to the Andean gene pool, where 11 of them presented medium grains (25 to 40 g 100 grains-1), and 19 lines presented large grains (> 40 g 100 grains-1) (Table 2). Large grains with white, red or cream tegument have high commercial value, and they often receive small offer in the international market.
Bean lines obtained from different growing seasons pre-sented variable cooking time (Table 2). In the 2010 normal rainy season, lines with shorter cooking times were WAF 141 (15 min and 17s), and BRS Embaixador (14 min and 08s). On the other hand, in the 2011 dry season, lines with shorter cooking time were IAC Galante, IAC Centauro, Xamego and Rosinha G2. Considering that bean cultivars with cooking times lower than 30 minutes are more desirable for the consumers, since it means economy of money and energy (Rodrigues et al. 2005), only Cal-96, Branco Graúdo, and WAF 75 lines may presented restriction to consumption due to the longer cooking time needed for grain softness, if grains originate from crops of the dry season. Moreover, long cooking times are not recommended for they may cause structural alterations at cellular level, and consequently loss of nutrients (Wassimi et al. 1988).
No significant difference (p value >0.05) was observed
for potassium (mean of 15.30 g kg-1 of dry matter - DM) and copper concentrations (mean of 8.94 mg kg-1 of DM) among special grains bean lines (Tables 1 and 3). However, Mesquita et al. (2007) evaluated copper and potassium concentrations in 21 bean lines with varied tegument col-ors, and observed genetic variability for these minerals. In
this case, differences observed can be justified by a genetic
variability among lines of different gene pool, by the type of soil, and by differences in meteorological conditions.
Bean lines were classified, according to Skott-Knott
test (p value =0.05), in two groups for calcium concentra-tion: low (0.88 to 1.29 g kg-1 of dry matter - DM), and high (1.38 to 1.80 g kg-1 of DM) (Table 3). In previous studies, identical amplitude was observed for calcium concentration in Middle American bean lines, of carioca and black tegu-ments, grown in Brazil (Jost et al. 2009), and in 29 Andean and Middle American bean lines, of different tegument colors, cultivated in Brazil, the United States and Colombia
(Akond et al. 2011). Nevertheless, it was possible to find
bean lines with calcium values up to 3.15 g kg-1 of DM in the Bank of Germplasm of the International Center for
Tropical Agriculture (Beebe et al. 2000).
Through Scott-Knott test it was possible to develop
stratifications for the three groups of lines concerning iron
concentration in grains: moderate (57.15 to 90.95 mg kg-1 of DM), high (95.05 to 108.20 mg kg-1 of DM) and very high (129.50 to 159 mg kg-1 of DM). This classification was similar to the one presented by Tryphone and Nchimbi-Msolla (2010) for 90 bean lines evaluated in Tanzania: low iron (23.6 to 42.0 mg kg-1 of DM), moderate iron (43.0 to 59.6 mg kg-1 of DM) and high iron (60.4 to 105.5 mg kg-1 of DM).
Special grains bean lines with very high iron concentra-tion (Ouro Branco, Hooter, 38 MON p5-13, BRS Radiate and IAC Harmonia) showed higher values than the observed in bean accesses stored in one of the largest worldwide col-lections of wild and cultivated bean species (Beebe et al 2000). Such high values for iron in bean grains had already been described in bean cultivars grown in many countries (Welch et al. 2000), and in crioule bean cultivars cultivated in Brazil (Pereira et al. 2011). Moreover, 10 lines presented high iron concentration in grains (95.05 to 108.20 mg kg-1 of DM): IAC Centauro, IAC Galante, WAF 141, Xamego, BRS Embaixador, Montcalm, IAC Boreal, OTG 07-09, Iraí and Chinook. Therefore, 46.87% of the special grains bean lines evaluated presented high or very high concentrations
of iron, and thus, they are indicated for biofortification
programs. The use of these lines in diet can contributes to prevent anemia, which is a serious problem of public health in the world.
Zinc concentration varied from 21.85 (BRS MG Realce) to 34.85 mg kg-1 of DM (IAC Centauro), and although a
significant difference was identified by the F test (p value
<0.05) for the lines, the application of Scott-Knott test did
not lead to stratification between treatments for the same level of significance (Table 3). Similar zinc concentration
was observed in bean lines evaluated in the United States (Moraghan and Grafton 2001), in Colombia (Cichy et al. 2009) and in Ruanda (Beebe et al. 2000). However, greater zinc concentration was observed in bean lines of the Middle American gene pool cultivated in Brazil (Mesquita et al. 2007, Rosa et al. 2010). Considering that 49% of the world
population present a risk for developing zinc deficiency
symptoms due to a low ingestion of this mineral in their meals (Brown et al. 2001), the increase of zinc concentrations
by biofortification may contribute for preventing malnutri
-tion symptoms. There is an expecta-tion that it is possible to increase zinc concentration in bean grains in 50% by genetic improvement, based on the genetic variability available in accesses stored in CIAT (Beebe et al. 2000).
iron (>95.05 mg kg-1 DM) and zinc (>29.05 mg kg-1 DM) concentrations in grains, and therefore, are recommended
for biofortification programs. If grains of these lines were
used as part of a balanced diet, they could contribute to minimize the lack of nutrition that causes risk to the health,
such as deficiencies of calcium, iron or zinc.
However, WAF 141, BRS Embaixador e IAC Boreal lines showed low grain yield (Table 2). Therefore, regard-ing high nutritional value, reduced cookregard-ing time and high grain yield, IAC Centauro, IAC Galante, Xamego, Ouro Branco, Montcalm, and Hooter lines are indicated for the conditions evaluated in the present study.
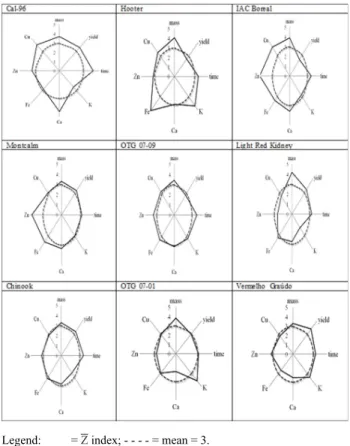
Z index obtained for all characters with the graphic
representation for the lines facilitates the selection of inbred lines with higher Z indexes for the most of the characters. Therefore, Figure 1 represents nine lines with the highest Z indexes mean for all the characters. Cal-96 line calls atten-tion for its highest Z indexes for grain yield, mass of 100 grains, calcium, zinc and copper concentrations. However, cooking time was long (not recommended), and potassium concentration was low, which can be an advantage for pa-tients with compromised kidney functions. For this case, Louis and Dolan (1970) have recommended potassium restrictions in dietary programs. Hooter line, on the other hand, displayed a differentiated mass of 100 grains, potas-sium, iron and copper concentrations. Controlled crossing between Cal-96 and Hooter is recommended, and selection
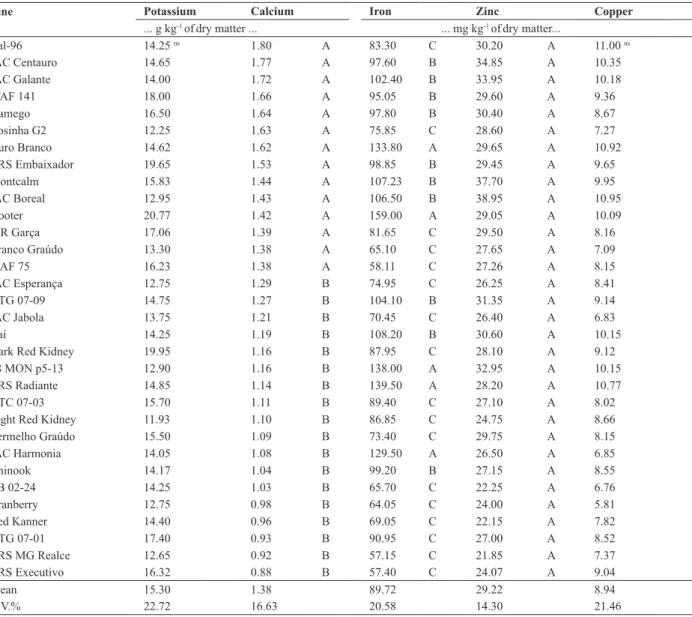
Table 3. Mean* of potassium, calcium, iron, zinc and copper concentrations of special grains bean lines obtained in normal rainy and dry seasons
Line Potassium Calcium Iron Zinc Copper
... g kg-1 ofdry matter ... ... mg kg-1 ofdry matter...
Cal-96 14.25 ns 1.80 A 83.30 C 30.20 A 11.00 ns
IAC Centauro 14.65 1.77 A 97.60 B 34.85 A 10.35
IAC Galante 14.00 1.72 A 102.40 B 33.95 A 10.18
WAF 141 18.00 1.66 A 95.05 B 29.60 A 9.36
Xamego 16.50 1.64 A 97.80 B 30.40 A 8.67
Rosinha G2 12.25 1.63 A 75.85 C 28.60 A 7.27
Ouro Branco 14.62 1.62 A 133.80 A 29.65 A 10.92
BRS Embaixador 19.65 1.53 A 98.85 B 29.45 A 9.65
Montcalm 15.83 1.44 A 107.23 B 37.70 A 9.95
IAC Boreal 12.95 1.43 A 106.50 B 38.95 A 10.95
Hooter 20.77 1.42 A 159.00 A 29.05 A 10.09
IPR Garça 17.06 1.39 A 81.65 C 29.50 A 8.16
Branco Graúdo 13.30 1.38 A 65.10 C 27.65 A 7.09
WAF 75 16.23 1.38 A 58.11 C 27.26 A 8.15
IAC Esperança 12.75 1.29 B 74.95 C 26.25 A 8.41
OTG 07-09 14.75 1.27 B 104.10 B 31.35 A 9.14
IAC Jabola 13.75 1.21 B 70.45 C 26.40 A 6.83
Iraí 14.25 1.19 B 108.20 B 30.60 A 10.15
Dark Red Kidney 19.95 1.16 B 87.95 C 28.10 A 9.12
38 MON p5-13 12.90 1.16 B 138.00 A 32.95 A 10.15
BRS Radiante 14.85 1.14 B 139.50 A 28.20 A 10.77
OTC 07-03 15.70 1.11 B 89.40 C 27.10 A 8.02
Light Red Kidney 11.93 1.10 B 86.85 C 24.75 A 8.66
Vermelho Graúdo 15.50 1.09 B 73.40 C 29.75 A 8.15
IAC Harmonia 14.05 1.08 B 129.50 A 26.50 A 6.85
Chinook 14.17 1.04 B 99.20 B 27.15 A 8.55
TB 02-24 14.25 1.03 B 65.70 C 22.25 A 6.76
Cranberry 12.75 0.98 B 64.05 C 24.00 A 5.81
Red Kanner 14.40 0.96 B 69.05 C 22.15 A 7.82
OTG 07-01 17.40 0.93 B 90.95 C 27.00 A 8.52
BRS MG Realce 12.65 0.92 B 57.15 C 21.85 A 7.37
BRS Executivo 16.32 0.88 B 57.40 C 24.07 A 9.04
Mean 15.30 1.38 89.72 29.22 8.94
C.V.% 22.72 16.63 20.58 14.30 21.46
of recombinants obtained may result in the development of new bean cultivars with higher grain yield and nutritional qualities characters.
IAC Boreal line showed higher Z indexes for most of
the minerals (calcium, iron, zinc and copper). Similarly,
Safira line showed higher Z indexes for minerals and protein
of 100 lines of the Bean Germplasm Bank of the Federal University of Lavras. In the present study, OTG 07-09 line called attention for its high potassium, iron, zinc and cop-per Z indexes. IAC Boreal and OTG 07-09 lines presented higher mass of 100 grains and were more complete for the evaluated minerals, although grain yield was low (Table
2). Therefore, difficulties will permeate the selection of
special grains bean lines with high grain yield, high mass of 100 grains, reduced cooking time and higher mineral concentrations. The strategy for identifying special grains bean lines, when most of the characters are combined, is a situation to be considered by bean breeding programs.
CONCLUSIONS
Special grains bean lines show genetic variability for grain yield, mass of 100 grains, cooking time, and calcium, iron and zinc concentrations in grains. IAC Centauro, IAC Galante, Xamego, Ouro Branco, Montcalm, and Hooter lines have high nutritional value, reduced cooking time and high grain yield, and their use is recommended for diets. Cal-96 line presents higher Z indexes for grain yield, and most of the minerals, in special grain bean line, and its use is recom-mended by crosses for the development of superior lines.
ACKNOWLEDGEMENTS
We thank the National Council of Technological and
Scientific Development (CNPq) for the financial aid and
scholarships granted. To Embrapa Rice and Beans, and the Agronomy Institute of Campinas, for availability of bean seeds. The authors would also like to thank Fabiano Kauer (Shimadzu) for technical support in ICP-OES analyses.
Legend: ____ = Z index; - - - - = mean = 3.
Figure 1. Graphic representation of Z indexes for grain yield (yield), mass of 100 grains (mass), cooking time (time), potassium (K), calcium (Ca), iron (Fe), zinc (Zn), and copper (Cu) concentrations in grains of nine special grains bean lines which presented the highest Z index mean for all characters.
Avaliação de linhagens de feijão de grãos especiais para produtividade, tempo
de cozimento e concentração de minerais
Resumo – A variabilidade genética de 32 linhagens de feijão de grãos especiais foi investigada para produtividade de grãos, massa de 100 grãos, tempo de cozimento e concentração de minerais nos grãos, e o índice Z foi usado para a seleção de linhagens com
superioridade para a maioria dos caracteres. As linhagens IAC Centauro, IAC Galante, Xamego, Ouro Branco, Montcalm e Hooter apresentaram alta produtividade de grãos, reduzido tempo de cozimento (menor do que 24 min) e alta concentração de potássio (>14 g kg-1 de matéria seca [MS]), cálcio (>1,42 g kg-1 MS), ferro (>97,60 mg kg-1 MS), zinco (>29,05 mg kg-1 MS) e cobre (>8,67 mg kg-1
MS), e seu uso na dieta é recomendado. A linhagem Cal-96 tem maior índice Z para produtividade de grãos e para a maioria dos
minerais, e seu uso é recomendado para cruzamentos para o desenvolvimento de linhagens superiores.
Palavras-chave:Phaseolus vulgaris, qualidade nutricional, variabilidade genética, índice Z. REFERENCES
Akond ASMGM, Crawford H, Berthold J, Talukder ZI and Hossain
K (2011) Minerals (Zn, Fe, Ca and Mg) and antinutrient (phytic
acid) constituents in common bean. American Journal of Food
Technology6: 35-243.
Beebe S, Gonzalez V and Rengifo J (2000) Research on trace minerals
in the common bean. Food and Nutrition Bulletin 21: 387-391.
Blair MW, González LF, Kimani PM and Butare L (2010) Genetic diversity,
inter-gene pool introgression and nutritional quality of common beans
Genetic121: 237-248.
Brown KH, Wuehler SE and Peerson JM (2001) The importance of zinc in human nutrition and estimation of the global prevalence of zinc deficiency. Food and Nutrition Bulletin22: 113-125.
Cichy KA, Caldas GV, Snapp SS and Blair MW (2009) QTL analysis of seed iron, zinc, and phosphorus levels in a Andean bean population. Crop Science49:1742-1750.
Cruz CD (2006) Programa Genes: estatística experimental e matrizes.
Editora UFV, Viçosa, 382p.
FAO (2011) Food and Agriculture Organization of the United Nations.
FAOSTAT. Available at <http://www.faostat.fao.org> Assessed on March 24, 2011.
Islam FMA, Basford KE, Jara C, Redden RJ and Beebe S (2002) Seed composition and disease resistance differences among gene pools in
cultivated common bean. Genetic Resources and Crop Evolution
49: 285-293.
Jost E, Ribeiro ND, Maziero SM, Cerutti T and Rosa DP (2009) Efeitos
gênicos do teor de cálcio em grãos de feijão. Ciência Rural39: 31-37.
Louis CJ and Dolan EM (1970) Removal of potassium in potatoes by
leaching. Journal of the American Dietetic Association57: 42-43.
Mendes FF, Ramalho MAP and Abreu AFB (2009) Índice de seleção para
escolha de populações segregantes de feijoeiro-comum. Pesquisa
Agropecuária Brasileira44: 1312-1318.
Mesquita FR, Corrêa AD, Abreu CMP, Lima, RAZ and Abreu AFB (2007)
Linhagens de feijão (Phaseolus vulgaris L.): composição química e
digestibilidade protéica. Ciência e Agrotecnologia31: 1114-1121.
Moraghan JT and Grafton K (2001) Genetic diversity and mineral
composition of common bean seed. Journal of the Science of Food
and Agriculture81: 404-408.
Pereira T, Coelho, CMM, Santos JCP, Bogo A and Miquelluti DJ (2011) Diversidade no teor de nutrientes em grãos de feijão crioulo no Estado
de Santa Catarina. Acta Scientiarum Agronomy33: 477-485.
Ribeiro ND, Cargnelutti Filho A, Poersch NL and Rosa SS (2007)
Padronização de metodologia para avaliação do tempo de cozimento
dos grãos de feijão. Bragantia66: 335-348.
Ribeiro ND, Maziero SM, Prigol M, Nogueira CW, Rosa DP and Possobom MTDF (2012) Mineral concentrations in the embryo and seed coat of
common bean cultivars. Journal of Food Composition and Analysis
doi:10.1016/j.jfca.2012.03.003 (in press).
Rodrigues JA, Ribeiro ND, Londero PMG, Cargnelutti Filho A and Garcia DC (2005) Correlação entre absorção de água e tempo de cozimento
de cultivares de feijão.Ciência Rural 35: 209-214.
Rosa SS, Ribeiro ND, Jost E, Reiniger LRS, Rosa DP and Cerutti T (2010) Potential for increasing the zinc content in common bean using genetic
improvement. Euphytica 175: 207-213.
Silva CA, Abreu AFB, Ramalho MAP and Maia LGS (2012) Chemical
composition as related to seed color of common bean. Crop Breeding
and Applied Biotechnology12: 132-137.
Singh SP, Gepts P and Debouch DG (1991) Races of common bean (Phaseolus vulgaris, Fabaceae). Economic Botany 45: 379-396.
Steel RGD, Torrie JH and Dickey DA (1997) Principles and procedures
of statistics: a biometrical approach. 3rd ed., McGraw Hill Book,
New York, 666p.
Talukder ZI, Anderson E, Miklas PN, Blair MW, Osorno J, Dilawari M and Hossain KG (2010) Genetic diversity and selection of genotypes
to enhance Zn and Fe content in common bean. Canadian Journal
of Plant Science 90: 49-60.
Tryphone GM and Nchimbi-Msolla S (2010) Diversity of common bean (Phaseolus vulgaris L.) genotypes in iron and zinc contents under
screenhouse conditions. African Jounal of Agricultural Research
5: 738-747.
Wassimi NN, Hosfield GL and Uebersax MA (1988) Combining ability of tannin content and protein characteristics of raw and cooked dry
beans. Crop Science 28: 452-458.
Welch RM, House WA, Beebe S and Cheng Z (2000) Genetic selection for
enhanced bioavailable levels of iron in bean (Phaseolus vulgaris L.)