Vol. 52, n. 1 : pp. 221-232, January-February 2009
ISSN 1516-8913 Printed in Brazil BRAZILIAN ARCHIVES OF
BIOLOGY AND TECHNOLOGY
A N I N T E R N A T I O N A L J O U R N A L
Anthropic Influence in the Water Quality of the River Basin
that Supplies the Pato Branco Municipality-PR
William César Polônio Machado
1*, Valter Antonio Becegato
2and André Virmond Lima
Bittencourt
31Departamento de Agronomia; Universidade Federal Tecnológica do Paraná; 88503-390; Pato Branco - PR -
Brasil. 2Departamento de Engenharia Ambiental; Universidade do Estado de Santa Catarina; C.P.:281; 88520-000; Lages - SC - Brasil. 3Departamento de Geologia; Universidade Federal do Paraná; C.P.: 19001; 81531-990; Curitiba - PR - Brasil
ABSTRACT
The Pato Branco river basin, which supplies water to Pato Branco city (70,000 inhabitants) in southwestern Paraná State, was monitored during two hydrological cycles, totaling 22 campaigns at two monitoring stations on the Conrado river: the Conrado station upstream (RC01) and the Conrado station downstream (RC02). The main characteristics of the basin here: area - 29.69 km2, length - 9,300 m, height difference - 170 m, declivity - 18.62 m km-1, and concentration time - 102 min. Physico-chemical variables were analyzed, using samples collected after a minimum three-day period without rain. The data set comprising seven variables yielded the following averages respectively for monitoring stations RC01 and RC02: variables that characterized the organic matter: BOD5 (5.2 –
4.31mg L-1 O2) and COD (11.04 – 11.2 L -1
O2), and variables that characterized the eutrophication processes:
ammoniacal N (0.16 – 0.09 mg L-1 N); nitrate (0.67 – 0.78 mg L-1 N); nitrite (0.06 – 0.029 mg L-1 N); total N (0.48 – 0.33 mg L-1 N), and total phosphorous (0.13 – 0.07 mg L-1). The lowest and the highest variation coefficients for data downstream and upstream corresponded to: nitrate and nitrite (46.1 and 166%); phosphorous and nitrite (56.8 and 229.6%).
Key words: Water quality, environment, anthropic influence
*Author for correspondence: [email protected]
INTRODUCTION
The definition of environment as “the cycle of all natural components and their conditions, laws, influences and interactions of physical, chemical, biologic and social nature that enable, shelter and support life in every form” (SEMA, 1996), enables the analysis of what effectively is an environmental system, which and how the interactions between natural factors occur,
Machado, W. C. P. et al. 222
exploration of natural resources is generated, more and more supported by modern technological processes, faster extraction speed, and use of large quantities of energy. This analysis leads to a wider exploration of natural resources that, without proper management, produces degradation leading to irreversible effects on natural cycles, among which the hydrologic cycle.
In this aspect, water resources point to a limiting factor with economic values of present and future use, respectively known as option value and existence value, variables difficult to be measured without a high degree of subjectivity. Therefore, water resources are considered of major importance under the point of view of survival of the urban centers and consequently play a fundamental rule in environmental issues, considering their scarcity.
From this point on, it is necessary to better understand the hydrographic basins, considering their present use, as well as their maximum use capacity, under the point of view of all existing activities in their contribution areas, aiming at a water quality control that can be applied to similar basins. Another factor is the identification of environmental variables that really represent the situation of real use and by doing so propose a control model built with the most significant environmental variables (Marques et al., 2003; Becegato et al., 2008). The present work aimed at
monitoring the water quality of the Conrado River. The samples for analysis were collected upstream and downstream during two hydrological cycles, focusing the inflow of organic and inorganic matter and nitrogenated compounds during drainage periods of water bodies reaching base flow.
MATERIALS AND METHODS
Characterization of the area
The study area was located in the Terceiro Planalto Paranaense (Fig. 1), the coordinates being: northernmost point E=341769, N=7091983; westernmost point: E=331010, N=7087501; southernmost point: E=340438, N=7077212; easternmost point: E=347288, N=7079699. The Pato Branco River hydrographic basin has a contribution area of 130.43 km² and is inserted in the Iguaçu river hydrographic basin.
The study area has been affected by intense anthropic action due to its strategic location for the initial development of the municipality. It attracted colonizers in the 1950’s, 1960’s and 1970’s, as well as being the route for those who migrated to Rio Grande do Sul and Santa Catarina states. The land use has been for agriculture, cattle, swine and poultry raising, and industrial activities.
PARANÁ
49 54
26 23
26 23
49
54o o
o
o
o o
o o
IV III II I
I - Bauru Basin II - Serra Geral Formation III - Paleozoic sedimentary
cover
IV - Precambrian shield
N
Figure 1 - Location of the Pato Branco river basin and respective water quality monitoring
stations.
The Pato Branco river basin is totally encompassed by the Terceiro Planalto Paranaense. It constitutes a large plane plunging westwards, limited to the east by the Serra da Boa Esperança,
flows, differential erosion and height differences between faulted blocks. The slopes in general present a series of steps corresponding to different flows or variations of the rock structure. The rivers sculpted either open valleys, forming lajeados and
originating rapids, streams and waterfalls, or closed valleys, forming canyons (COPEL, 2001). The landscape in characterized by smoothly undulated, undulated and strongly undulated forms (Teixeira et al., 2000).
Methods
The main activities of the project of qualitatively and quantitatively monitoring of the Conrado river hydrographic basin waters were concentrated in October 2003 and July 2005, with manual sampling of the Conrado river upstream and downstream. The monitoring stations were named RC01 (upstream) and RC02 (downstream), totaling 22 monthly campaigns, complying with a period of at least three days with no rain. Such
procedure aimed at checking the trend of river base drainage, as well as characterizing the waters close to their natural constitution. The samples were sent to the laboratories of the Instituto
Ambiental do Paraná (IAP) in Curitiba and
UFTPR (Universidade Federal Tecnológica do
Paraná – Pato Branco Campus), taking into
consideration all the requirements for sample conservation: stainless steel containers; sample conservation in ice (in the field), transport to the laboratories as soon as possible. They also take part in the PNMA project (Plano Nacional de
Monitoramento Ambiental – Projeto Suinocultura
do Estado do Paraná).
To select the variables (Table 1), several uses of the natural capital were taken into account, as well as the activities developed in the hydrographical basin area that could represent or show alterations in water quality. Table 2 presents the main uses and their respective variables.
Table 1 - Physico-chemical variables examined at the Conrado river monitoring stationsRC01 (upstream) and RC02
(downstream).
Variable Determination Method
Ammoniacal N Laboratory phenate method
Nitrate Laboratory Reduction with cadmium
Nitrite Laboratory Reaction with N (1-naftyl-)ethylene-diamine
Total Nitrogen Laboratory phenate method
Total phosphorous Laboratory Ascorbic acid
biochemical oxygen demand (BOD) Laboratory Incubation (20ºC 5 days) Chemical oxygen demand (COD) Laboratory Reflow chamber
Table 2 - Main soil uses and activities developed in the Conrado river basin.
Activities developed Variables related to use Activity period (months)
Culture rotation Turbidity, color and total solids January to July September to October
Soil fertilization Nitrogenated series, total phosphorous, BODOD, copper, zinc, pH, series of solids, total and fecal 5, COD, coliforms
February to August October to November
Cattle raising Nitrogenated series, total phosphorous, BODOD, copper, zinc, pH, series of solids, total and fecal 5, COD,
coliforms During the whole year
Forested areas BOD5, COD, OD, pH, total and fecal coliforms During the whole year Dwellings and
Machado, W. C. P. et al. 224
RESULTS AND DISCUSSION
Table 3 show the results for the parameters analyzed using water samples of the Conrado
river, including the values of the seven variables monitored during 22 campaigns downstream and upstream, as well as the respective statistics.
Table 3 - Results of water quality analyses and statistical summary the monitoring stations RC01 and RC02. Date of
sampling
BOD mg L-1 O2
COD mg L-1 O2
Total Phosphorous
mg L-1
Nitrate mg L-1 N
Nitrite mg L-1 N
Ammoniaca l Nitrogen mg L-1 N
Total Nitrogen mg L-1 N RC01 RC02 RC01 RC02 RC01 RC02 RC01 RC02 RC01 RC02 RC01 RC02 RC01 RC02
04/11/03 6 14 9 20 0.09 0.09 0.93 1.24 0.46 0.03 0.16 0.08 0.66 0.45 09/12/03 28 30 31 33 0.15 0.125 1.08 0.93 0.11 0.23 0.42 0.59 0.63 0.77 05/01/04 4 4 7 9 0.526 0.11 1.08 2.17 0.062 0.23 0.34 0.38 0.52 0.87 11/02/04 4 2 5 3 0.09 0.09 1.06 1.04 0.012 0.011 0.16 0.07 1.16 1.23 25/02/04 7 4 12 9 0.16 0.09 0.1 0.24 0.039 0.01 0.04 0.08 0.234 0.07 23/03/04 4 3 12 12 0.09 0.09 0.67 0.003 0.005 0.02 0.005 0.005 0.014 0.329 27/04/04 2 1 3 2 0.09 0.09 0.74 0.311 0.17 0.02 0.17 0.17 0.973 0.0 26/05/04 4 3 11 7 0.18 0.11 0.71 0.82 0.01 0.01 0.16 0.11 0.52 0.35 01/06/04 2 6 5 10 0.03 0.03 0.023 0.019 0.001 0.001 0.03 0.027 0.16 0.068 30/06/04 7 2 21 18 0.09 0.047 0.79 0.98 0.021 0.005 0.06 0.03 0.31 0.19 27/07/04 6 2 10 9 0.16 0.046 0.76 0.96 0.015 0.007 0.04 0.02 0.17 0.23 24/08/04 2 2 5 14 0.27 0.005 0.73 0.53 0.036 0.004 0.33 0.07 0.54 0.19 05/10/04 2 2 13 13 0.14 0.044 0.91 0.96 0.053 0.003 0.08 0.043 0.32 0.32 28/10/04 2 2 12 12 0.07 0.091 0.61 0.94 0.011 0.005 0.39 0.032 0.32 0.23 01/12/04 2 4 14 16 0.12 0.16 0.62 0.59 0.006 0.034 0.041 0.047 0.2 0.54 14/12/04 19 2 20 15 0.14 0.064 0.28 0.28 0.021 0.0042 0.24 0.049 0.52 0.2 01/02/05 2 2 14 13 0.05 0.016 0.31 0.55 0.016 0.002 0.07 0.046 0.32 0.24 21/02/05 5 2 21 12 0.13 0.07 0.48 0.91 0.073 0.0036 0.54 0.034 1.13 0.22 29/03/05 2 3 8 3.5 0.2 0.073 1.1 1.1 0.066 0.0029 0.21 0.023 0.58 0.23 03/05/05 2 3 6 10 0.061 0.03 0.54 0.76 0.003 0.003 0.02 0.02 0.66 0.19 30/05/05 1 1 2 3 0.041 0.046 0.64 1.03 0.013 0.004 0.033 0.02 0.16 0.18 27/07/05 1 1 2 2 0.08 0.013 0.6 0.84 0.172 0.005 0.038 0.02 0.58 0.14 ---
Statistics
--- Minimum 1 1 2 2 0.03 0.005 0.02 0.003 0.001 0.001 0.005 0.005 0.01 0 Maximum 28 30 31 33 0.526 0.16 1.1 2.17 0.46 0.23 0.54 0.59 1.16 1.23
Average 5.2 4.31 11.04 11.2 0.13 0.07 0.67 0.78 0.06 0.029 0.16 0.09 0.48 0.33 Median 2 2 10.5 11 0.10 0.07 0.71 0.87 0.02 0.005 0.07 0.04 0.52 0.23 Standard
deviation 6.4 6.3 7.22 7.07 0.104 0.039 0.31 0.47 0.10 0.06 0.16 0.14 0.31 0.29 Variation
coefficient
(%)
123 146 65.4 63 80 55.7 46.1 60.1 166 229.6 99 156.4 63.6 90.8 Skewness 2.85 3.61 1.08 1.25 2.72 0.26 -0.49 0.76 3.10 2.9 1.0 2.92 0.78 1.85 Kurtosis 8.44 13.9 1.3 3.19 9.41 -0.23 -0.25 2.60 10.98 7.26 -0.13 8.61 0.23 3.36
Variables that characterize organic matter
Biochemical oxygen demand (BOD)
BOD indicates the quantity of oxygen necessary to oxidize organic matter by means of aerobic biochemical processes for an incubation period of five days at 20°C, necessary to stabilize the inorganic forms. This determination is known as
BOD5 and indirectly measures whether the water bodies have good oxygenation conditions and whether inflow of organic matter is taking place in the water bodies.
27.7% for station RC01 samples and 13.7% for station RC02. However, the average BOD5 was 5.2 mg L-1 O
2 for station RC01 and 4.31 mg L-1 O2 for station RC02, respectively close to the limit values of a 2 class river, (SEMA ,1996).
According to Sperling (1997), for natural environments where no inflow of organic matter takes place, BOD5 concentration values fall in the 1-10 mg L-1 O2 interval. Considering this interval, only 9.1% of the values for both stations could be characterized as originated from polluted waters. Mcneely et al., (1979) and Perez (1992) reported that superficial waters with BOD5 levels less than
4 mg L-1 O
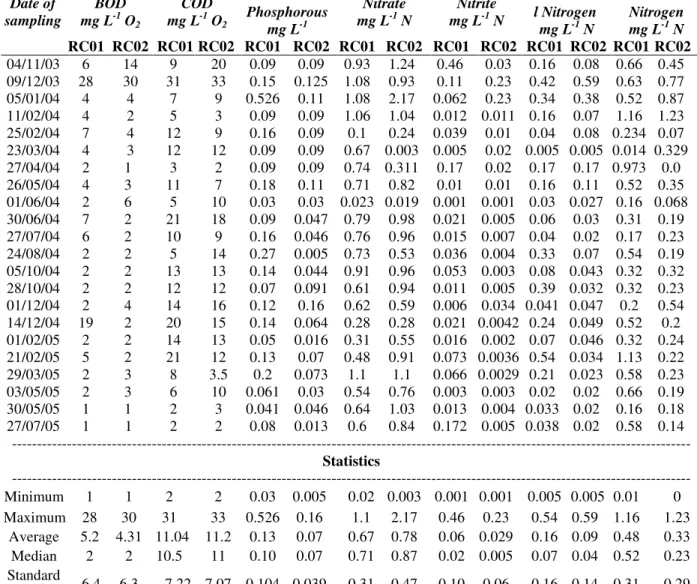
2 were reasonably clean and those with levels more than 10 mg/L O2 were classified as polluted as a function of inflow of degradable organic matter. According to these definitions, 72.75% of the values obtained for monitoring station RC01 and 86.4% for monitoring station RC02 could be characterized as clean waters. According to Tables 3, the variation coefficient was higher for monitoring station RC02 (146%) than for station RC01 (123%). According to Figure 2, the data followed a positive skewness distribution for both the stations.
0 2 4 6 8 10 12 14 16 18 20 22 24 26 28
BOD (mg L-1 O2) - Upstream
0 4 8 12 16
N
u
m
b
e
r
o
f
s
a
m
p
le
s
15
5
1 1
0 4 8 12 16 20 24 28 32
BOD (mg L-1 O2) - Downstream
0 4 8 12 16 20
N
u
m
b
e
r
o
f
s
a
m
p
le
s
19
1 1 1
Figure 2 - BOD histograms for monitoring stations RC01 and RC02.
The main factor for such behavior of BOD values at both monitoring stations could be related to the existence of two industries upstream station RC01, one for milk products and the other for poultry raising for slaughter, as well as intensive cattle raising in areas of higher declivity close to the hydrographic basin watershed and the use of permanent preservation areas as pastur
e.
Chemical oxygen demand (COD)
C
OD expresses the existing oxygen content in water bodies. The oxidation of organic matter takes place when an extremely strong chemical agent oxidizes both organic and inorganic matter. Therefore, COD will be always higher than BOD5. According to Chapman and Kimstach (1996), COD concentrations in superficial waters can reach up to 20 mg L-1 O2. Up to this limit, the waters are considered less polluted; values up to 200 mg L-1 O2 correspond to waters receiving effluents.Resolution n. 357/05 (CONAMA, 2005) does not refer to limits for this variable and consequently no evaluations could be made on violations to this resolution. The limits established by Chapman and Kimstach (1996) of 20 mg L-1 O2 were adopted, though such value could be due to effluents. During the campaign of 9th December 2003, the waters of both stations were classified as polluted according to Chapman and Kimstach (1996), yielding respectively 28 and 30 mg L-1 O
Machado, W. C. P. et al. 226
0 4 8 12 16 20 24 28 32
COD (mg L-1 O2) - Upstream
0 2 4 6
N
u
m
b
e
r
o
f
s
a
m
p
le
s
3
6 6
3
1 2
1
0 4 8 12 16 20 24 28 32 36
COD (mg L-1 O2) - Downstream
0 2 4 6 8
N
u
m
b
e
r
o
f
s
a
m
p
le
s
5
1 8
5
2
1
Figure 3 - COD histograms for monitoring stations RC01 and RC02.
Analyzing the data of variables that represented the organic matter (BOD5 and COD), the higher dispersion occurred for BOD5 (Table 3). The amplitude of differences was more significant for BOD5, as the average and median values for COD were quite close. Therefore, could be infered that the inorganic balance was more equilibrated than the organic balance, taking into account the conditions of the present study, or that the larger oscillations in the quality of superficial waters took place due to the inflow of organic matter. The higher BOD5 variations were observed in the monitoring stations downstream, whereas average values were higher for upstream stations.
Variables that characterize eutrophication process
Total phosphorous
The inflow of total phosphorous in the liquid medium can be of natural origin due to mineral dissolution, in particular of apatite, soil transport by erosion, decomposition of organic matter; of anthropogenic origin, by the use of chemical fertilizers, agrotoxic products and effluents, either of industrial origin as milk products, livestock slaughter and sewage, or as superphosphate detergents and fecal material. In general, phosphorous is found in either soluble (dissolved
soluble organic matter) or particulate
(microorganism biomass) organic forms. It can also be in soluble (phosphorous salts) and particulate (mineral compounds) inorganic forms. Among these forms, the most significant is the
soluble inorganic H2PO4-(aq.) (10%) and HPO4-(aq.) (90%) (FATMA, 1999).
Table 3 showed that the major phosphorous inflows occurred on December 9, 2003 and January 5 2004. Considering that the samples were collected within a three-day interval of no rain and that phosphorous had low mobility, the most plausible explanation was the high discharge of industrial effluents and the application of swine excretions to soil as manure. When high concentrations of phosphorous are found in the liquid medium, depending on the characteristics of the receptor, an eutrophication process can start. In natural waters, phosphorous concentrations fall in the range 0.01-0.05 mg L-1 (Esteves, 1998). According to Table 3, the average values for
phosphorous were 0.13 and 0.07 mg L-1,
respectively. DVWK (1999) reported that for low-energy rivers, the critical phosphorous contents to start eutrophication fell in the 0.1 to 0.2 mg L-1 range; for high-energy rivers they could be higher than 0.3 mg L-1.
time of the dissolved fraction. In general, phosphates quickly form complexes, such as soluble complexes, chelates and salts, with cations available in the water body, the main being iron, aluminum and calcium. The main factors that command the combination and dissolution of such compounds are: pH, phosphate concentration in the water body, redox potential and biota activities. These factors remove phosphate from the water column and reduce the concentration of certain metals as a function of precipitation of the metal-phosphoric compounds (CCME, 1999). Resolution n. 375/05 (CONAMA, 2005) establishes that for class 2 rivers, the limit value for the lotic environment is 0.1 mg L-1 P. Fifty per cent of the station RC01 samples presented values above the limit. Such violations were distributed along the sample collection periods. However, for intermediate environments, considering water
bodies that flew to reservoirs in lentic environment with residence time of 2 and 40 days, the limit was 0.05 mg L-1 P. A total of 90.9% of station RC01 data and 72.7% of RC02 showed the violation level. As the trend of water quality was being evaluated, it was possible that the Conrado river had a potential to develop eutrophication processes in the situation previously mentioned. Thus, a comparison with both values should be adopted for the analysis, but prevailing in the future the limit value of 0.05 mg L-1 P. It is worth stressing that monitoring station RC01 presented the highest values and alterations. A factor responsible for the increase of total phosphorous concentration could have been the use of fertilizers and agrotoxic products.
The data were more dispersed upstream, with variation coefficient of 80%, comparatively to 55.7% for the data downstream (Fig. 4).
0 0.05 0.1 0.15 0.2 0.25 0.3 0.35 0.4 0.45 0.5 0.55 0.6 0.65
Total phosphorous (mg L-1) - Upstream
0 2 4 6 8
N
u
m
b
e
r
o
f
s
a
m
p
le
s
3 8
5
4
1 1
0 0.02 0.04 0.06 0.08 0.1 0.12 0.14 0.16
Total phosphorus (mg L-1) - Downstream
0 2 4 6
N
u
m
b
e
r
o
f
s
a
m
p
le
s
3
2 4
3 6
2
1 1
Figure 4 - Total phosphorous histograms for monitoring stations RC01 and RC02.
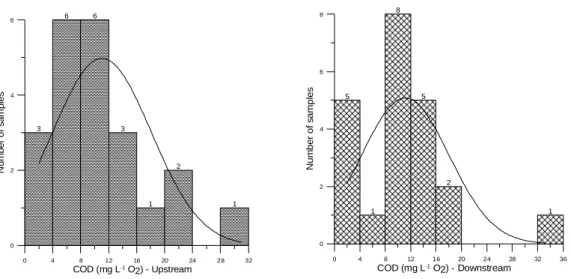
Nitrogenated compounds
Regarding the behavior of nitrogenated
compounds, their inflow can, in general, be by precipitation, as organic and inorganic matter of allochthonous origin and also be fixed in the atmosphere close to the liquid medium. Such compounds may take several chemical forms, as the oxidized, such as nitrate (NO3 (aq.)) and nitrite (NO2 (aq.)). These two forms are known as total oxidized nitrogen. They can also be in reduced forms, such as ammonia (NH3(g)) and the ion ammonium (NH4+(aq.)), ammoniacal nitrogen. Ammoniacal nitrogen plus organic nitrogen is
named Total Kjeldahl-Nitrogen (TKN).
Additionally, nitrous oxide (N2O) and molecular nitrogen (N2(g)), leaving to the atmosphere dissolved the organic nitrogen and particulate organic nitrogen. British Columbia (1998) and Mcneely (1979) reported that in terms of water bodies, nitrate and ammonium were of major importance, bearing in mind that they represented the main nitrogen sources for the primary producers. When these compounds lack, inorganic compounds are firstly used and lacking the latter, the forms of dissolved organic nitrogen.
Machado, W. C. P. et al. 228
0.06 and 0.029 mg L-1 N, respectively for stations RC01 and RC02 (Table 3). These values were below those established by Resolution n. 357/005 (CONAMA, 2005) of 1.0 mg L-1 N. None of the 22 campaigns yielded values equal or above the
limit established by Conama. Variation
coefficients were 166% for station RC01 and 229.6% for station RC02, influenced mainly by the data corresponding to December 9, 2003 and January 5, 2004. For station RC01, the highest values were obtained in the 11 and 12/03; 04/04; 02 and 03/05, and 07/05. The highest values for
72.7% of the results for both stations corresponded to RC01. It could be inferred that probably a nitrification process was taking place there, because this compound usually appeared in water in an intermediate natural phase of the nitrogen cycle, in the microbial oxidation of nitrate. Once nitrite is formed, it is immediately oxidized to nitrate (nitrification) or reduced to gaseous nitrogen (denitrification). The data distribution (Fig. 5) was positive skewness,both upstream and downstream.
0 0.04 0.08 0.12 0.16 0.2 0.24 0.28 0.32 0.36 0.4 0.44 0.48 0.52
Nitrite (mg L-1 N) - Upstream
0 4 8 12 16
N
u
m
b
e
r
o
f
s
a
m
p
le
s
14
4
1 2
1
0 0.002 0.004 0.006 0.008 0.01 0.012 0.014 0.016 0.018 0.02 0.022 0.024
Nitrite (mg L-1 N) - Downstream 0
2 4 6 8
N
u
m
b
e
r
o
f
s
a
m
p
le
s
8
5
3
2
Figure 5 - Histograms for the variable nitrite for monitoring stations RC01 and RC02.
The average nitrate contents were 0.67 mg L-1 N (upstream) and 0.78 mg L-1 N (downstream), which did not reach the limit set by Resolution n. 357/005 (CONAMA, 2005) of 10 mg L-1 N. The variability upstream was 46.1%, whereas it was 60.1% downstream (Table 3). For 59% of the samples, the nitrate values were higher at monitoring station RC02; 31.8% were higher at station RC01. As nitrate is usually present in moderate concentrations in water bodies as a natural metabolite of the nitrification process (conversion of ammonia or nitrite to nitrate), high values can lead to mass proliferation of phytoplankton and macrophytes in low-energy waters. British Columbia (1998) and Mcneely et al., (1979) explained that the major sources of nitrate inflow in the water bodies were manures used in soil fertilization, domestic and industrial effluents, as well as animal excretions, not ruling out atmospheric fixation of nitrogen. Nitrate values in RC01 obtained for November 4, 2003, December 9, 2003, January 5, 2004, and May 30, 2005, were slightly higher than the others,
influencing the average value and consequently the standard deviation. The data distribution (Fig. 6) was negative asymmetric. On December 9, 2003; January 5, 2004; February 11, 2004 and March 29, 2005, the values were above the majority for RC02, generating a positive skewness curve.
natura” feces or de sewage in primary treatment
phase. As the study was based on rural hydrographic basin, there was probably a
cause-effect relationship with the application of swine excretions in the soil and pastures or the punctual launch in the water body.
0 0.1 0.2 0.3 0.4 0.5 0.6 0.7 0.8 0.9 1 1.1 1.2 1.3
Nitrate (mg L-1 N) - Upstream 0
2 4 6 8 10
N
u
m
b
e
r
o
f
s
a
m
p
le
s
2 2
3 9
2 4
0 0.2 0.4 0.6 0.8 1 1.2 1.4 1.6 1.8 2 2.2 2.4 2.6
Nitrate (mg L-1 N) - Downstream
0 4 8 12
N
u
m
b
e
r
o
f
s
a
m
p
le
s
5 4
11
1 1
Figure 6 - Histograms of the variable nitrate for monitoring stations RC01 and RC02.
0 0.05 0.1 0.15 0.2 0.25 0.3 0.35 0.4 0.45 0.5 0.55 0.6 0.65
Ammoniacal nitrogen (mg L-1) - Upstream
0 4 8 12
N
u
m
b
e
r
o
f
s
a
m
p
le
s
11
4
2 3
1 1
0 Ammoniacal nitrogen (mg L0.05 0.1 0.15 0.2 0.25 0.3 0.35-1 N) - Downstream0.4 0.45 0.5 0.55 0.6 0.65
0 4 8 12 16 20
N
u
m
b
e
r
o
f
s
a
m
p
le
s
18
2
1 1
Figure 7 - Histograms of the variable ammoniacal nitrogen for monitoring stations RC01 and
RC02.
The average values for the variable Total Kjeldahl Nitrogen (TKN) were 0.48 and 0.33 mg L-1 N, respectively for monitoring stations RC01 and RC02. Resolution n. 375/05 (CONAMA, 2005) establishes a limit for TKN of 3.7 mg L-1 N. Station RC01 presented data variability of the order of 63.6%, whereas station RC02 of 90.8% (Fig. 8). During February 2004, April 2004, June 2004, December 2004, February 2005 and May
20005, TKN values were higher than those for nitrate in station RC01.
Machado, W. C. P. et al. 230
0 0.1 0.2 0.3 0.4 0.5 0.6 0.7 0.8 0.9 1 1.1 1.2 1.3
Total nitrogen (mg L-1 N) - Upstream
0 2 4 6
N
u
m
b
e
r
o
f
s
a
m
p
le
s
5 5
6
3
1 2
-0.2 Total nitrogen (mg L0 0.2 0.4 0.6-1 N) - Downstream0.8 1 1.2 1.4
0 2 4 6 8
N
u
m
b
e
r
o
f
s
a
m
p
le
s
1
8 8
2
1 1 1
Figure 8 - Histograms for the variable Total Kjeldahl Nitrogen for monitoring stations RC01 e RC02.
Table 4 - Averages followed by different letters in the line are statistically different by Student’s t.
Variables Upstream Downstream
BOD5 5.19 4.32
COD 11.04 11.16
Total phosphorous 0.13 a 0.07 b
Nitrate 0.67 0.78
Nitrite 0.06 0.029
Ammoniacal nitrogen 0.16 0.089
Nitrogen Kjeldahl 0.48 0.33
Table 5. Ratios between the variables at both monitoring stations.
Ratio Domestic sewage (*) RC01 RC02
BOD5 : COD 0.6 a 0.8 0.47 0.38
BOD5 : TKN 17 : 1 10.83 13.06
COD : TKN - 23.0 33.94
BOD5 : PTOTAL 90 : 1 40.0 61.57
COD : PTOTAL - 84.92 160
TKN : PTOTAL 6 : 1 3.69 4.71
Source: (*) Branco (1991).
Another type of analysis is expressed in Table 5. The behavior of a water body regarding the variables that characterize organic matter can be depicted through the BOD:COD ratio. When this ratio is close to 0.5 (Branco, 1991), the inflow of organic matter coming from several sources such as domestic, commercial and industrial and that potentially contribute with both biodegradable and organic compounds, which are difficult to biologically degrade. According to Branco (1991), for ratios of the order of 0.8, a fraction
The ratio TKN:P was also below sewage values, being the higher value once more for RC02. In agriculture practices, such as culture rotation, the incorporation of nitrogen and phosphorous occurs from oxidized forms (nitrate and phosphate), nitrate not contributing to TKN concentration. It was then inferred that the contribution to TKN increase was from ammoniacal nitrogen, being phosphorous characteristic of animal excretions. This would explain the fact that BOD5 ratio was less at station RC01, as the major activity in the watershed was livestock raising in steep areas, favoring the direct transport of sediments to the water body.
CONCLUSIONS
The Conrado river waters presented nutrient concentrations in quantities enough to promote growth of photosynthesizing algae.
Monitoring station RC01 was characterized by higher nutrient concentrations due to the livestock raising activity.
Monitoring station RC02 was characterized by a higher inflow of oxidized nitrogen.
The variables that characterized the nitrogenated compounds did not represent violations on the basis of the limit established by CONAMA Resolution n. 375/05, whereas total phosphorous represented a 40% violation in relation to the limit of 0.01 mg L-1 P.
The variable COD behaved identically at both monitoring stations, which indicated that there could be no difference in the oxidation process of the oxidizable organic and inorganic forms for the condition of sample collection without the interference of diffused loads.
All the variables analyzed presented variation coefficient higher than 40%, indicating a high heterogeneity of the data set.
RESUMO
A bacia hidrográfica do rio Pato Branco manancial de abastecimento público da cidade de Pato Branco localizada no Sudoeste do Estado do Paraná com uma população de 70.000 habitantes, foi monitorada pelo período de dois ciclos hidrológicos, totalizando 22 campanhas em duas estações de monitoramento: a estação Conrado
montante (RC01) e a Conrado jusante (RC02) localizadas no rio Conrado. As principais características da bacia estudada foram: área de 29,69 km2, comprimento 9.300 metros, desnível 170 metros, declividade 18,62 m km-1 e tempo de concentração 102 minutos. Analisou-se variáveis físico-químicas, cujas amostras foram coletadas respeitando um período mínimo de três dias sem chuvas. O conjunto de dados referente as sete variáveis para as estações de monitoramento RC01 e RC02 apresentaram respectivamente, as seguintes médias: variáveis que caracterizam a matéria orgânica: DBO5 (5,2 – 4,31 mg L-1 O2) e DQO (11,04 – 11,2 mg L-1 O
2) e as que caracterizam os processos de eutrofização: N amoniacal (0,16 – 0,09 mg L-1 N); nitrato (0,67 – 0,78 mg L-1 N); nitrito (0,06 – 0,029 mg L-1 N); N total (0,48 – 0,33 mg L-1 N) e fósforo total (0,13 – 0,07 mg L-1). Os menores e maiores coeficientes de variação dos dados a montante e a jusante, foram observados nas variáveis: nitrato e nitrito (46,1 e 166%); fósforo e nitrito (56,8 e 229,6%).
REFERENCES
Agostinho, A. A and Gomes, L.C. (1997), Reservatório de Segredo: bases ecológicas para o manejo. Eduem,
Maringá.
Becegato, V. A; Ferreira, F. J. F; Cabral, J. B. P and Neto, S. L. R. (2008), Gamma-ray Spectrometry Sensor and Geochemical Prospecting in an Area of Sugar Cane Plantation. Brazilian Archives of Biology and Technology., 51, (1), 1-10.
Branco, S. M. et al. (1991), Geoquímica Ambiental. Rubem Laina Porto – São Paulo, Editora da Universidade de São Paulo, Associação Brasileira de Recursos Hídricos, 1991.
British Columbia. Guidelines for Interpreting Water Quality Data : Versão 1.0, (1998), Disponível em: <http://srmwww.gov.bc.ca/risc/pubs/aquatic/interp/in terp-01.htm> Acesso em 01 out. 2005.
Chapman, D. and Kimstach, V. (1996), Selection of water quality variables. In: CHAPMAN, D. Water quality assessments: a guide to the use of biota, sediments and water in environmental monitoring. 2 ed., Cambridge: UNESCO/WHO/UNEP.
CCME - Canadian Council of Ministers of the Environment. (1999), Canadian water quality guidelines for the protection aquatic life:
Introduction. In: Canadian Environmental Quality Guidelines. Winnipeg, p.159.
Machado, W. C. P. et al. 232
<http://www.mma.gov.br/port/conama> Acesso em 15 set.
COPEL. Companhia Paranaense de Energia Elétrica do Paraná (2001), Estudos do Impacto Ambiental da Usina Hidroelétrica São João. Curitiba.
DVWK - Deutscher Verband Für Wasserwirtschaft und Kulturbaun. (1999), Relevância de parâmetros de qualidade das águas aplicados a águas correntes. Esteves, F. de A. (1998), Fundamentos de Limnologia.
2 ed. Rio de Janeiro: Interciência.
FATMA - Fundação do Meio Ambiente de Santa Catarina. (1999), Relevância de parâmetros de qualidade das águas aplicados a águas correntes. Parte I: Características gerais, nutrientes, elementos-traço e substâncias nocivas inorgânicas, características biológicas. Florianópolis: FATMA/GTZ, p.108.
Marques, P. H. C.; Oliveira, H. T. and Machado, E. C. (2003), Limnological Study of Piraquara River (Upper Iguaçu Basin): Spatiotemporal Variation of Physical and Chemical Variables and Watershed Zoning. Brazilian Archives of Biology and Technology., 46(3), 383-394.
Mcnnely. R. N., Neimanis, V. P. and Dwyer. L. Water Quality Sourcebook (1979), A Guide to Water Quality Parameters. Ottawa: Environment Canadá, 90 p.
SEMA – Secretaria de Estado do Meio Ambiente. (1996), Coletânea de legislação ambiental. Curitiba. Governo do Estado do Paraná.
Perez, G. R. (1992), Fundamentos de limnologia neotropical. Editora da Universidade de Antioquia, Medellín.
Primavesi, O.; Freitas, A. R. de.; Primavesi A.C.; Oliveira, H. T. de. (2002), Water quality of the Canchim’s Creek Watershed in São Carlos, SP, Brazil, Occupied by Beef and Dairy Cattle Activities., Brazilian Archives of Biology and Technology., 45, (2), 209-217.
Sperling, M. (1995), Introdução a qualidade de água e tratamento de esgotos. DESA/EFMG.
Sperling, E. (1997), Introdução a qualidade de água. ABEAS/UFV, Viçosa – MG.
Teixeira, W., Toledo, M. C. M., Fairchild, T. R and Taioli, F. (2000), Decifrando a terra. Ed. USP.
Thornton, K. W. (1990), Perspectives on reservoir limnology. In: THORNTON, K. W.; KIMMEL, B. L.; PAYNE, F. E. (Eds.). Reservoir Limnology: Ecological Perspectives. New York : John Wiley and Sons.
Wetzel, R. G. (1983), Limnology. Phyladelphia: W. B. Saunders.