Students and Teachers: A DEA Approach to the Relative
Efficiency of Portuguese Public Universities
*António Afonso
$and Mariana Santos
#$ ISEG/UTL - Technical University of Lisbon, Department of Economics, and CISEP – Research Centre on the Portuguese Economy, R. Miguel Lúpi 20, 1249-078 Lisbon, Portugal
(email: aafonso@iseg.utl.pt)
# Economic Research and Forecasting Department, Ministry of Finance, R. da Alfândega, 5, 2º, 1100-016 Lisbon, Portugal
(email: marianaroque@dgep.pt)
June 2005
Abstract. We employ a non-parametric methodology, Data Envelopment Analysis, to estimate efficiency scores for Portuguese public universities, using data mainly for 2003. The input measures are constructed from the number of teachers and from universities’ spending while the outputs measures are based on the undergraduate success rate and on the number of doctoral dissertations. Using frontier analysis we are able to separate universities that might qualify, as “performing well” from those were some improvement might be possible in terms of efficiency. This could imply a better allocation by the universities of the usually scarce public financial resources available to tertiary education.
Key words: tertiary education, efficiency, production possibility frontier, DEA
JEL Classification: C14, H52, I21
* The opinions expressed herein are those of the authors and do not necessarily reflect those of the
1. Introduction
As Blanchard (2004) points out, good performance in higher education is expected to produce positive growth effects, and tertiary education in many European countries still lags behind the level achieved in other developed economies. On the other end, there is the overall idea, alleged by some academic work and held in reports from international organisations, that the public sector remains inefficient in most European countries.1 Moreover, and according to the OECD (2004), the average share of public spending in total spending for tertiary education in the OECD and in Portugal was respectively 79.3 percent and 92.3 percent in 2001. These factors seem sufficient motivation to address the issue of the efficiency of public tertiary expenditure in Portugal.
The proper measurement of public sector performance, particularly when it concerns services provision, is a delicate empirical issue and the related literature, principally when it comes to aggregate data, is still limited. This measurement issue is here considered in terms of efficiency measures comparing public resources – total expenditure, dimension of staff – used by Portuguese public universities, and indicators of the universities’ output/outcome, such as the success rate of undergraduate students or the number of doctoral dissertations.
This paper contributes to the literature by analysing the efficiency of resources used by Portuguese public universities to provide their services. With the use of frontier analysis we focus on how close public universities are to operating on the efficiency frontier. We study the efficiency of Portuguese public universities in 2003 by applying a non-parametric methodology, Data Envelopment Analysis (DEA), to a set of 52 public universities/faculties/institutes and also to a smaller sub-set of faculties/institutes.
The remainder of the paper is organised as follows. In section two we present some stylised facts concerning the tertiary education sector in Portugal, particularly regarding students and teachers. Section three reviews some of the related existing
1For instance, Afonso, Schuknecht and Tanzi (2003) reported the existence of relative public spending
literature on education efficiency analysis. Section four briefly addresses the DEA methodology. Section five explains the data, and discusses the results of our efficiency analysis. Section six contains our concluding remarks.
2. A brief overview of public tertiary education in Portugal
2.1. Students
The tertiary education sector in Portugal has traditionally been a public one. Only in the last decade privately run universities started to provide a more consistent alternative thereby increasing the offer of available places for students in the tertiary education level. Nevertheless, and since data regarding private tertiary education institutions, for instance, concerning total expenditures, are not easy to come across from a unified source, we will only address the public segment (by far the larger) of the tertiary education sector. Additionally, there are also tertiary education courses provided by military institutions. Given the particularities of such institutions, data availability, and also in order to keep the sample as homogeneous as possible, those institutions are not included in the sample.
Portuguese tertiary public sector includes both universities and the so-called polytechnic institutes (Politécnicos). While the polytechnics have been in the past more oriented to 3-year courses, universities offer 4, 5 or 6-year graduate courses, and they are also entitled to give Masters and PhD courses.2 In our analysis, only universities will be used.
The number of places available in tertiary education is determined every year by the institutions and approved by the government. All courses have a numerus clausus
2 The academic degrees confered by Portuguese Universities are the following: graduation or first
fixed by each institution according to its capacity. Additionally, faculties and institutes have to specify a minimum entrance requirement for their various courses.3
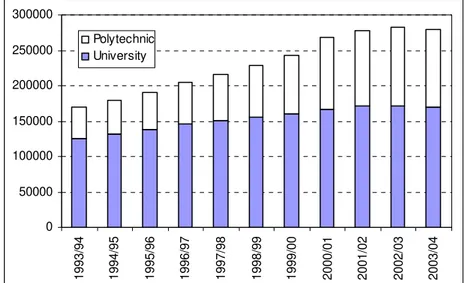
Between 1993/94 and 2003/04, the overall number of public sector undergraduate students in the tertiary education level increased 64.7 per cent (see Figure 1), roughly 3.0 per cent per year. This implies overall increases during that period of 34.5 per cent in the public universities and of 152.4 per cent in the public Polytechnics.
[Insert Figure 1 here]
In terms of comparison within the European Union, the proportion of students enrolled in tertiary education in Portugal, as a percentage of all pupils and students was 17 per cent in 1999/2000, slightly above the EU average of 15 per cent. Indeed, and accompanying the overall trend in the EU, the number of students in tertiary education more than doubled over the last 25 years. More precisely in Portugal, over four times as many students were enrolled in 1999/2000 as in 1975/76 (considering now both public and private tertiary education), making it the country with the greatest growth in the EU. However, Portugal is still below average in terms of tertiary education in the EU. Indeed, and if one considers, for instance, the percentage of population between 30 and 34 years that held a tertiary education qualification in 2000, this percentage was only 11.3 per cent in Portugal, well below the 24.6 per cent average in the EU-15 (cfr. Eurostat (2002)).
2.2. Teachers
During the period 1993/94-2003/04, the overall number of teachers in public tertiary institutions in Portugal increased around 48.1 per cent. The more significant raise occurred in the “polytechnic” sector, 158.9 per cent, in line with the strong development in the number of students. On the other hand, public tertiary universities’ teachers increased by 16.9 per cent between 1993 and 2003.
3 There are national competitive examinations for the canditates with satifactory school and exam
Regarding public Universities, a relevant indicator, to be used ahead as an input measure in our efficiency analysis, is the ratio of teachers-to-students. Interestingly, the number of teachers per 100 students decreased from 9.6 in 1993 to 8.3 in 2003, as a result of the already mentioned higher growth rates in students than in teachers throughout the period.
Another interesting point to make concerning the structure of public universities’ teachers is the fact there seems to be some skewing towards the assistant professors category during the period 1993-2003. In other words, it looks as if there are too few full professors in relative terms (see Figure 2).
[Insert Figure 2 here]
This feature of public tertiary education in Portugal is also pointed out by Athans (2002), who, when comparing two engineering departments in the US (MIT) and in Portugal (IST-UTL), mentions that in typical US research universities the “academic pyramid” is inverted. Indeed, and even if between 1990 and 2003, there was, in the Portuguese public university system, a decrease at the teaching assistants level, and a clear increase at the assistant professor level, the top three categories still clearly reproduced a pyramid shaped structure in 2003.
3. Some existing non-parametric applications to education
We report in Table 1 a summary of the main variables used by some of the studies that directly address tertiary education efficiency, particularly in what concerns the selection of input and output measures. Some of the input measures used in the existing literature include, for instance, staff numbers, non-staff numbers, percentage faculty with a PhD, total expenditure, expenditure with academic staff, and other expenditures. In terms of output measures, it is possible to mention, as an example of the most commonly used variables, the graduation rate, freshmen retention rate, student numbers, both graduate and undergraduate, total number of certificates conferred, and research publications and citations.
[Insert Table 1 here]
On related cross-country efficiency studies, Clements (2002) uses FDH analysis to measure the efficiency of education spending in the European Union. St. Aubyn (2003) reports results of FDH analysis applied to education spending in OECD countries while Afonso and St. Aubyn (2004) use both FDH and DEA for a cross-country analysis of efficiency in education and health.
4. Analytical framework
We use the non-parametric method DEA, which was originally developed and applied to firms that convert inputs into outputs. Coelli, Rao and Battese (1998) and Sengupta (2000) introduce the reader to this literature and describe several applications.4 The term “firm”, sometimes replaced by the more encompassing Decision Making Unit (henceforth DMUs), the term coined by Charnes et al. (1978), may include non-profit or public organisations, such as hospitals, universities or local authorities.
Data Envelopment Analysis, originating from Farrell’s (1957) seminal work and popularised by Charnes, Cooper and Rhodes (1978), assumes the existence of a convex production frontier, a hypothesis that is not required for instance in the FDH approach. The production frontier in the DEA approach is constructed using linear
4 A possible alternative non-parametric method would be Free Disposable Hull analysis (FDH).
programming methods. The terminology “envelopment” stems out from the fact that the production frontier envelops the set of observations.5
The general relationship that we expect to test, regarding efficiency in tertiary education, can be given by the following function for university i:
) ( i
i f X
Y = , i=1,…,n (1)
where we have Yi – indicators reflecting education output; Xi – spending or number of
teachers in university i, either per student or in some other measure. IfYi < f(xi), it is
said that university i exhibits inefficiency. For the observed input level, the actual output is smaller than the best attainable one and inefficiency can then be measured by computing the distance to the theoretical efficiency frontier.
The purpose of an input-oriented example is to study by how much input quantities can be proportionally reduced without changing the output quantities produced. Alternatively, and by computing output-oriented measures, one could also try to assess how much output quantities can be proportionally increased without changing the input quantities used. The two measures provide the same results under constant returns to scale but give different values under variable returns to scale. Nevertheless, and since the computation uses linear programming, not subject to statistical problems such as simultaneous equation bias and specification errors, both output and input-oriented models will identify the same set of efficient/inefficient producers or DMUs.6
The analytical description of the linear programming problem to be solved, in the variable-returns to scale hypothesis, is sketched below for an input-oriented specification. Suppose there are k inputs and m outputs for n DMUs. For the i-th
5 Technical efficiency is one of the two components of total economic efficiency, also referred to as
X-efficiency. The second component is allocative efficiency and they are put together in the overall efficiency relation: economic efficiency = technical efficiency × allocative efficiency. A DMU is technically efficient if it is able to obtain maximum output from a set of given inputs (output-oriented) or is capable to minimise inputs to produce the same level of output (input-oriented). On the other hand, allocative efficiency reflects the DMUs ability to use the inputs in optimal proportions. Coelli et al. (1998) and Thanassoulis (2001) offer introductions to DEA, while Simar and Wilson (2003) and Murillo-Zamorano (2004) are good references for an overview of frontier techniques.
6 In fact, and as mentioned namely by Coelli et al. (1998), the choice between input and output
DMU, yi is the column vector of the inputs and xi is the column vector of the outputs.
We can also define X as the (k×n) input matrix and Y as the (m×n) output matrix. The DEA model is then specified with the following mathematical programming problem, for a given i-th DMU: 7
0 1 ' 1 0 0 to s. min , ≥ = ≥ − ≥ + − λ λ λ θ λ θ λ θ n X x Y y i i
. (2)
In problem (2), θ is a scalar (that satisfies θ≤1), more specifically it is the efficiency score that measures technical efficiency. It measures the distance between a university and the efficiency frontier, defined as a linear combination of best practice observations. With θ<1, the university is inside the frontier (i.e. it is inefficient), while
θ=1 implies that the university is on the frontier (i.e. it is efficient).
The vector λ is a (n×1) vector of constants that measures the weights used to compute the location of an inefficient DMU if it were to become efficient. The inefficient DMU would be projected on the production frontier as a linear combination of those weights, related to the peers of the inefficient DMU. The peers are other DMUs that are more efficient and therefore are used as references for the inefficient DMU. n1 is a n-dimensional vector of ones. The restriction n1'λ =1 imposes convexity of the
frontier, accounting for variable returns to scale. Dropping this restriction would amount to admit that returns to scale were constant. Notice that problem (1) has to be solved for each of the n DMUs in order to obtain the n efficiency scores.
5. Efficiency analysis of tertiary education spending in Portugal
5.1. Data and measurement issues
In our study we assess the efficiency of a set of Portuguese public universities in 2003. More precisely, we use data for 52 universities/faculties/institutes and just for
7 We simply present here the equivalent envelopment form, derived by Charnes et al. (1978), using the
the subset of faculties/institutes, depending on data availability. For 8 DMUs (universities) only aggregated data was available and not by faculty.8 All these DMUs are listed in the Appendix alongside with a short code name, which identifies each faculty in terms of the results reported ahead in the paper.
The way we choose our DMUs stems from the fact that most public universities in Portugal aggregate several faculties or institutes, depending on the organisational framework adopted. For instance, the Technical University of Lisbon is organised with Institutes while the University of Porto is organised with faculties. Still other universities do not have a fully-fledged segmentation either in terms of institutes or in terms of faculties. Data limitations prevented us from using either course or department specific information.
Having said this, our DMUs are both primarily faculties and institutes, but some Universities are also considered as an aggregate institution. This segregation of DMUs can also be found in the Annual State General Account (Conta Geral do Estado), published by the Ministry of Finance, taking into account the relative autonomy of the several the autonomous bodies of the Central Government. At the time of writing, 2003 is the last year when the Annual State General Account is available, and therefore, the last year for which information on total spending is easy to get to from a homogeneous source.
Concerning the selection of outputs and inputs, as a general rule of thumb there should be at least three DMUs for each input and output variable used in the model since with less than three DMUs per input and output there is the risk that too many DMUs will turn out to be efficient This allows having sufficient degrees of freedom when implementing the DEA methodology. Therefore, and since we have at least 33 DMUs, considering only faculties and institutes, we could have used a total number of say 4 or 5 inputs and outputs. Additionally we need relatively homogeneous DMUs, with the same inputs and outputs in positive amounts. A missing value for either
8 In the subsequent empirical analisys we also consider ISCTE in the Universities group even if it is not
inputs or outputs consequently implies dropping the respective DMU from the data set.
Output data
Performance measurement in higher education generally proves to be a difficult task. Indeed, it is not easy to assess the performance of a university using as an output such market mechanisms as profits. Moreover, homogeneous performance indicators are not easily available for the Portuguese public tertiary education sector. For instance, Afonso and Santos (2004) only used student enrolment numbers as an output indicator due to the lack of alternative suitable measures within a less rich data set.
For our first output measure we used the success rate in the year 2002/03 of the undergraduate students enrolled for the first time, on a faculty or institute basis.9 This measure ranges from 37.1 percent (UNL-FCT) to 95.9 percent (UP-FMD), as can be seen in the Appendix. The success rate, as it is obtained, has a downside for some courses, where the computed success rate can actually exceed 100 percent. This is due to the fact that the calculation does not take into account the students that change course in the meantime, and end up graduating in a different subject, which naturally distorts the success rate of that particular course (see OCES (2004a)). This question was relevant for three medical faculties and also for a sports faculty, where the success rate was above 100 percent, which we then excluded from our sample.
As a second output measure, and in order to try to capture somehow another side of the universities’ performance outcome, we used the number of PhD certificates conferred by each DMU. We only take into account the doctoral dissertations actually obtained in Portugal, and not consider the equivalences attributed to certificates obtained abroad, in order to better assess the use of financial and physical resources involved in such postgraduate degrees. Another useful output, research publications and citations, is unfortunately not available on a homogeneous basis for all the DMUs.
9 This is the OECD survival rate concept, as mentioned in OCES (2004): “Survival rate at the tertiary
Operationally we use the cumulative number of PhD certificates conferred in the years 2002-2003 per 100 teachers in each DMU. This is intended both to smooth some possible peak in one year and also to avoid the too many universities/faculties that conferred no PhD certificates in a given year. The number of PhD certificates conferred ranged from nil certificates per 100 teachers (UL-FBA) to 27.7 certificates per 100 teachers (UTL-ISA).
Input data
Additionally, one has to bear in mind that the success rates we use, computed by the OCES – Observatório da Ciência e do Ensino Superior, are for courses whose standard duration varies between 4 and 5 years, while for the medical faculties courses take usually 6 years. This is somehow aligned with the fact that we take 4 years averages of total spending as well. Hence, one of our selected inputs will be the average total spending per student for the years 2000, 2001, 2002 and 2003. Total spending is taken from the Annual State General Account. This average measure of financial input ranged from 2021 euros (UL-FD) to 12015 euros (UTL-ISA).
We selected a second input, measured in physical terms, which is the teachers-to-students ratio in public universities in the year 2003/04. More precisely, and since higher performance is supposedly directly linked with higher input levels, we used the variable “Teachers per 100 Students”. This physical input ranged from 3.5 teachers per 100 students (UNL-FD) to 27.8 teachers per 100 students (UNL-FCM).
Additional alternative input measures would be the breakdown of total spending into academic and non-academic staff related. However, these data are not publicly available, in and homogeneous way, from a unique source.
5.2. DEA results of efficiency analysis
When performing DEA analysis an option has to be made between constant returns and variable returns to scale. Under constant returns to scale one assumes that there is no significant relationship between the scale of operations and efficiency. In other words, big universities are not more efficient than smaller ones in transforming their inputs to outputs. On the other hand, under variable returns to scale an increase in inputs is expected to result in a disproportionate increase in the outputs delivered by the DMUs, for instance, due to decreasing marginal returns.10 For all our specifications we report in the paper both set of results but we will centre our analysis on the variable returns to scale efficiency scores.
We performed the DEA analysis both in a one-input one-output and also in a two-input one-output framework. As a first specification we use our first selected output, the students’ success rate in 2003, and the teachers-to-students FTE ratio for 2003 as our quantitatively measured input. In Table 2 we present the DEA variable-returns-to-scale technical efficiency results using this one-input and one-output framework (Model M1). Additionally, and as a measure of comparison, we also present the constant returns to scale results.
[Insert Table 2 here]
The results show that input efficiency scores start at 0.273 (UP-ICBAS) and output efficiency scores at 0.410 (UNL-FCT). The theoretical efficient frontier is defined by five DMUs: UC-FF, UL-FD, UNL-FD, UP-FD, and UP-FMD. Those universities are located in the efficient frontier, which is illustrated in Figure 3, because they all have
10 Technically, the constant returns to scale efficiency scores, identical in both the input and the output
above average success rates and all but one DMU (UP-FMD) exhibit below average teacher-student FTE ratios. This last faculty, in spite of above average teachers-to-students FTE ratio is nevertheless the DMU with the highest success rate in the sample.
[Insert Figure 3 here]
Still from Table 4 we can observe that overall input efficiency is around 0.553, theoretically implying that on average the faculties/institutes/universities in our sample might be able to achieve the same level of performance (i.e. have the same success rate) using about 44.7 percent less resources. On the other hand, the average output efficient score equals 0.728, which indicates that with the same inputs, the average DMU seems to be obtaining a performance about 27.2 percent less than it should if it were to be located on the theoretical production possibility frontier. Alternative calculations using the simple teachers-to-students ratio, instead of the teachers-to-students FTE ratio, did not provide much different results and therefore are not reported (but are available from the authors on request).
Taking advantage of the available information on the universities’ spending, we performed the DEA analysis using two inputs, the teacher-student FTE ratio and expenditure per student, together with the aforementioned output measure (Model M2). A caveat relates to the fact that some degree of correlation cannot be avoided among the inputs used. Due to the lack of available data on spending for 11 universities, the sample is now reduced to 41 DMUs. Table 3 reports the results of this two-input one-output analysis.
[Insert Table 3 here]
The use of the FTE ratio instead of the simple teachers-to-students ratio is relevant in terms producing significant changes in the input-oriented rankings of two universities: UNL-FCM and UNL-ISEGI. Indeed, we also performed a similar analysis by using the teachers-to-students ratio. However, when using the more reasonable measure FTE, those two DMUs improved their input efficiency ranking positions by 13 and 20 places respectively. This was to be expected since those DMUs depict a significant adjustment between the simple teachers-to-students ratio and the FTE ratio (see data set in the Appendix). No relevant changes in the ranking occurred in terms of the output-oriented analysis.
As already mentioned, we should have DMUs as homogeneous as possible. So far we have been using aggregate data for some Universities in some cases and we also data on a Faculty/Institute basis. Therefore, in a second step, we excluded eight DMUs from our data sample, the ones were only aggregated data is available, leaving us now with 33 units. Using as inputs the teachers-to-students FTE ratio and spending per student, we report the results for this smaller and more homogeneous data set in Table 4.
[Insert Table 4 here]
The ranking of the faculties/institutes remains rather stable and the efficiency frontier still includes the same previously mentioned four faculties. Indeed, dropping the aforementioned set of eight universities from the sample does not affect much the relative positions of the remaining sample since those DMUs were not positioned among the more efficient of the sample .
Without going into very specific details, we can see how the results can be used as a rough guideline for efficiency improvements. For example, and taking the case of UTL-FA, from the input-oriented results in Table 4 we see that this DMU is not located in theoretical production frontier, since it has an efficiency score of 0.551. According to the additional information (not presented in the text) obtained from solving the respective programming problem, it was possible to see that UTL-FA’s peers are UL-FD and UP-FD. Therefore, in order for UTL-FA to move closer to the efficiency frontier, by keeping the same level of output (success rate), a reduction in both inputs (FTE ratio and spending per student) would be required, towards the level of the inputs of both peers.
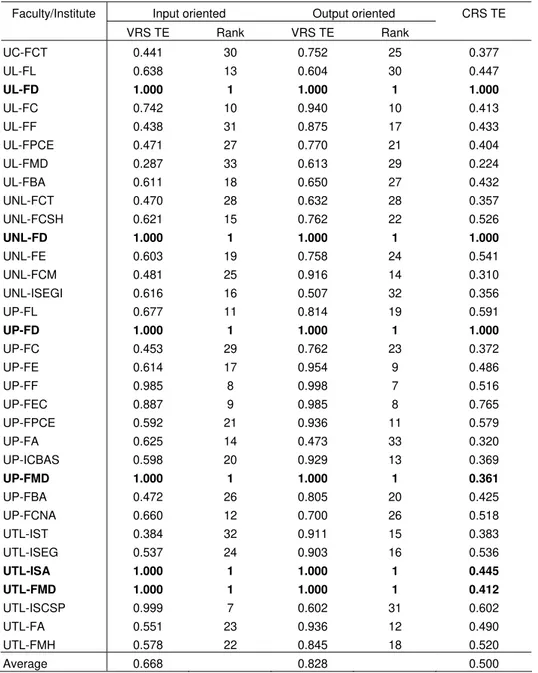
We further broadened the analysis in order to consider also our second output measure, the number of PhD certificates conferred per 100 teachers. Therefore, taking models M2 and M3 we add this second output indicator, building models M21 and M31, and the results are reported respectively in Table 5 and in Table 6.
[Insert Table 5 here]
[Insert Table 6 here]
By comparing this new set of results, with two output indicators, with the previous ones with just one output, we can see that two more DMUs are now located on the theoretical production possibility frontier: UTL-ISA and UTL-FMD. The DMUs that were already on the frontier also keep their positions. There is also an overall increase in the average output efficiency scores, while the average input efficiency score rises for the subset with both universities and faculties as DMUs.
positions in terms of the output efficiency scores occur for UL-FC and, to a less extent, for UTL-ISA.
Nevertheless, one has to be careful when assessing these results since we are measuring efficiency by using a limited number of inputs and outputs. Additional useful output measures would be the research output of each faculty, or the number of students enrolled as a ratio to the faculty staff. Unfortunately these data were not available from unified sources or from the universities themselves for that matter.
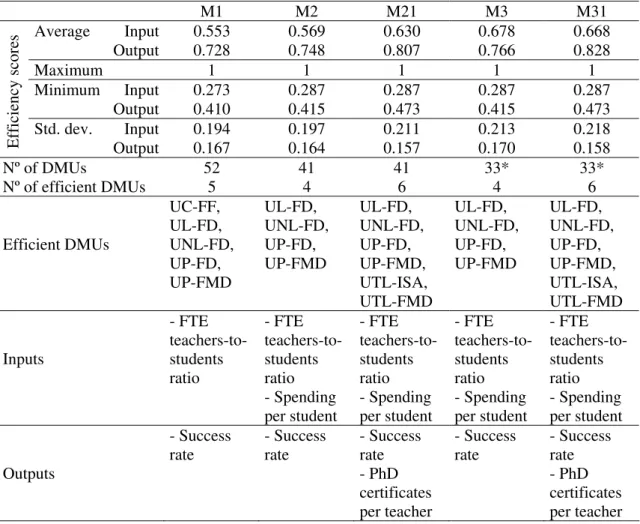
We summarise in Table 7 the main findings of our non-parametric analysis, performed for the various sub-samples of universities/faculties/institutes, by reporting data for the descriptive statistics of efficiency scores as well as the respective model specifications.
[Insert Table 7 here]
6. Conclusion
In this paper we employed a non-parametric methodology, Data Envelopment Analysis, to assess the relative efficiency of Portuguese public universities (rather than departments) with data reported to 2003. Our input measures were based on information for the full-time equivalent teachers-to-students ratios and on the universities spending per student. We used as output measures, the success rate of undergraduate students and the number of doctoral dissertations per 100 teachers. The results from our empirical analysis in evaluating efficiency in Portuguese public tertiary education allowed us to compute efficiency scores for each faculty/institute, including estimates of efficiency losses, and to construct rankings of the faculties/institutes, including therefore the identification of some less efficient cases.
output efficiency, the average overall efficiency scores range from 0.728 to 0.828, which would mean that with the same inputs, the average university seems to be obtaining a performance about between 27.2 and 17.2 percent less than it should if it were located on the theoretical production possibility frontier. Dropping from our sample the universities were we only have aggregate data (and no detailed information by faculty/institute) increases the efficiency scores.
Our results must be seen as a first step towards assessing the efficiency of public tertiary education expenditure in Portugal, and the conclusions drawn upon the reported evidence must be read with care. Overall, and as a matter of common sense, one should be aware that simply putting more money into a promising activity, i.e. tertiary education, does not necessarily improve output quality proportionally, and this hypothesis is not denied by our results. Indeed, we were able to separate universities that might qualify, as “performing well” from those were some improvement might be possible in terms of efficiency. As a relevant policy implication this could imply a better allocation, by the universities, of the scarce public financial resources available to public tertiary education.
On the other hand, there is no similar measure of success for graduate students (including particularly Masters’ students) as the one we used for undergraduate students, and this seems to an area where available information seems to be lacking. Naturally, some universities have a relatively higher number of graduate students than others, for instance due to different orientation and/or positioning in the tertiary education market, and one would like to control for that factor as well.
consistently in that position over time. Here, a time frame analysis would be necessary but the relevant data are mostly not available.
Finally, and as a next step, inefficiencies could be explained using non-discretionary inputs, not included in the DEA calculations, through the estimation of Tobit models.11 For instance, one could envisage as possible useful candidate variables the share of academic staff with doctoral degrees, but this has to be left for further research.
Appendix – Data and sources
Table A1 - List of Universities, Faculties and Institutes
CODE FACULTY / INSTITUTE /UNIVERSITY
UA UNIVERSIDADE DOS AÇORES
UAL-FCHS UNIVERSIDADE DO ALGARVE-FACULDADE DE CIÊNCIAS HUMANAS E SOCIAIS UAL-FCMA UNIVERSIDADE DO ALGARVE-FACULDADE DE CIÊNCIAS DO MAR E DO AMBIENTE UAL-FCT UNIVERSIDADE DO ALGARVE-FACULDADE DE CIÊNCIAS E TECNOLOGIA
UAL-FE UNIVERSIDADE DO ALGARVE-FACULDADE DE ECONOMIA
UAL-FERN UNIVERSIDADE DO ALGARVE-FACULDADE DE ENGENHARIA A RECURSOS NATURAIS
UAV UNIVERSIDADE DE AVEIRO
UBI UNIVERSIDADE DA BEIRA INTERIOR
UC-FCT UNIVERSIDADE DE COIMBRA - FACULDADE DE CIÊNCIAS E TECNOLOGIA UC-FD UNIVERSIDADE DE COIMBRA - FACULDADE DE DIREITO
UC-FE UNIVERSIDADE DE COIMBRA - FACULDADE DE ECONOMIA UC-FF UNIVERSIDADE DE COIMBRA - FACULDADE DE FARMÁCIA UC-FL UNIVERSIDADE DE COIMBRA - FACULDADE DE LETRAS
UC-FPCE UNIVERSIDADE DE COIMBRA - FACULDADE DE PSICOLOGIA E DE CIÊNCIAS DA EDUCAÇÃO UC-FCDEF UNIVERSIDADE DE COIMBRA - FACULDADE DE CIÊNCIAS DO DESPORTO E DA EDUCAÇÃO FÍSICA
UE UNIVERSIDADE DE ÉVORA
UL-FL UNIVERSIDADE DE LISBOA - FACULDADE DE LETRAS UL-FD UNIVERSIDADE DE LISBOA - FACULDADE DE DIREITO UL-FC UNIVERSIDADE DE LISBOA - FACULDADE DE CIÊNCIAS UL-FF UNIVERSIDADE DE LISBOA - FACULDADE DE FARMÁCIA
UL-FPCE UNIVERSIDADE DE LISBOA - FACULDADE DE PSICOLOGIA E CIÊNCIAS DA EDUCAÇÃO UL-FMD UNIVERSIDADE DE LISBOA - FACULDADE DE MEDICINA DENTÁRIA
UL-FBA UNIVERSIDADE DE LISBOA - FACULDADE DE BELAS ARTES
UM UNIVERSIDADE DA MADEIRA
UMI UNIVERSIDADE DO MINHO
UNL-FCT UNIVERSIDADE NOVA DE LISBOA - FACULDADE DE CIÊNCIAS E TECNOLOGIA UNL-FCSH UNIVERSIDADE NOVA DE LISBOA - FACULDADE DE CIÊNCIAS SOCIAIS E HUMANAS UNL-FD UNIVERSIDADE NOVA DE LISBOA - FACULDADE DE DIREITO
UNL-FE UNIVERSIDADE NOVA DE LISBOA - FACULDADE DE ECONOMIA
UNL-FCM UNIVERSIDADE NOVA DE LISBOA - FACULDADE DE CIENCIAS MÉDICAS
UNL-ISEGI UNIVERSIDADE NOVA LISBOA - INST. SUPERIOR ESTATÍSTICA E GESTÃO DA INFORMACÃO UP-FL UNIVERSIDADE DO PORTO - FACULDADE DE LETRAS
UP-FD UNIVERSIDADE DO PORTO - FACULDADE DE DIREITO UP-FC UNIVERSIDADE DO PORTO - FACULDADE DE CIÊNCIAS UP-FE UNIVERSIDADE DO PORTO - FACULDADE DE ENGENHARIA UP-FF UNIVERSIDADE DO PORTO - FACULDADE DE FARMÁCIA UP-FEC UNIVERSIDADE DO PORTO - FACULDADE DE ECONOMIA
UP-FPCE UNIVERSIDADE DO PORTO - FACULDADE DE PSICOLOGIA E CIÊNCIAS DA EDUCAÇÃO UP-FA UNIVERSIDADE DO PORTO - FACULDADE DE ARQUITECTURA
UP-ICBAS UNIVERSIDADE DO PORTO - INSTITUTO DE CIÊNCIAS BIOMÉDICAS DE ABEL SALAZAR UP-FMD UNIVERSIDADE DO PORTO - FACULDADE DE MEDICINA DENTÁRIA
UP-FBA UNIVERSIDADE DO PORTO - FACULDADE DE BELAS ARTES
UP-FCNA UNIV. DO PORTO - FACULDADE DE CIÊNCIAS DA NUTRIÇÃO E ALIMENTAÇÃO UTL-IST UNIV. TÉCNICA DE LISBOA - INSTITUTO SUPERIOR TÉCNICO
UTL-ISEG UNIV. TÉCNICA DE LISBOA - INSTITUTO SUPERIOR DE ECONOMIA E GESTÃO UTL-ISA UNIV. TÉCNICA DE LISBOA - INSTITUTO SUPERIOR DE AGRONOMIA
UTL-FMD UNIV. TÉCNICA DE LISBOA - FACULDADE DE MEDICINA VETERINÁRIA UTL-ISCSP UNIV. TÉCNICA LISBOA - INST.SUPERIOR CIÊNCIAS SOCIAIS POLÍTICA UTL-FA UNIV. TÉCNICA DE LISBOA - FACULDADE DE ARQUITECTURA
UTL-FMH UNIV. TÉCNICA DE LISBOA - FACULDADE DE MOTRICIDADE HUMANA
UTAD UNIVERSIDADE DE TRÁS-OS-MONTES E ALTO DOURO
ISCTE INSTITUTO SUPERIOR DE CIÊNCIAS DO TRABALHO E DA EMPRESA
Table A2 - Data set University/
Faculty/ Institute
Success rate (%), 2003
1/
PhD certificates in 2002-03, per 100 teachers
2/
Teachers per 100 students, 2003
3/
FTE teachers per 100 students, 2003 4/ Average spending per student, 2000-03, euros 5/
UA 50.35 6.2 8.8 8.5 8002.01
UAL-FCHS 59.70 na 7.1 7.1 na
UAL-FCMA 60.42 na 7.8 7.3 na
UAL-FCT 59.76 na 9.0 8.8 na
UAL-FE 51.01 na 7.5 6.6 na
UAL-FERN 39.72 na 8.5 7.6 na
UAV 71.37 11.0 8.6 8.2 7055.98
UBI 45.31 8.1 8.8 7.8 5053.00
UC-FCT 57.44 15.6 9.0 8.1 6030.17
UC-FD 73.09 3.2 3.9 3.6 na UC-FE 37.78 3.1 5.2 5.0 na
UC-FF 89.73 16.4 6.5 6.8 na
UC-FL 61.12 9.4 6.8 6.6 na UC-FPCE 58.73 15.5 6.0 5.6 na
UC-FCDEF 62.60 10.0 7.5 6.1 na
UE 53.20 9.2 7.8 7.4 5324.44
UL-FL 46.77 9.7 6.5 6.3 3664.48
UL-FD 86.48 4.0 5.7 5.4 2021.06
UL-FC 52.82 23.2 9.8 9.6 7863.32
UL-FF 75.69 8.4 9.9 8.3 5612.38
UL-FPCE 63.96 9.3 8.8 8.3 4912.89
UL-FMD 58.67 1.9 19.2 12.5 9189.16
UL-FBA 57.67 0.0 7.4 7.2 3529.18
UM 57.72 3.1 8.1 7.3 5358.09
UMI 72.95 12.2 7.8 7.2 5119.39
UNL-FCT 37.10 14.6 8.0 7.6 5718.46
UNL-FCSH 56.90 15.0 8.7 8.2 4221.16
UNL-FD 71.43 21.1 3.5 3.5 2952.62
UNL-FE 65.98 2.3 7.7 5.8 4692.58
UNL-FCM 87.90 2.5 27.8 13.5 8540.99
UNL-ISEGI 41.89 5.2 8.9 5.6 5780.15
UP-FL 65.17 10.6 6.2 6.0 3523.51
UP-FD 78.30 8.0 3.8 3.7 2247.73
UP-FC 60.53 13.3 8.1 7.9 5918.26
UP-FE 78.47 14.1 8.5 7.8 6062.43
UP-FF 87.31 8.3 8.3 8.1 6165.95
UP-FEC 85.84 3.5 6.3 6.0 3004.30
UP-FPCE 71.15 17.8 7.9 7.6 4682.70
UP-FA 39.89 4.1 6.4 6.4 3535.70
UP-ICBAS 71.34 22.7 21.3 12.7 8610.59
UP-FMD 95.92 4.2 13.0 12.7 8531.54
UP-FBA 72.67 0.0 9.1 9.0 4606.82
UP-FCNA 60.00 3.8 8.1 5.5 3761.98
UTL-IST 71.19 20.7 9.8 9.0 8413.37
UTL-ISEG 77.63 7.5 7.9 6.9 4746.46
UTL-ISA 78.83 27.7 10.8 10.2 12015.06
UTL-FMD 83.93 18.3 10.0 9.8 10217.92
UTL-ISCSP 50.44 2.2 6.5 4.9 2098.18
UTL-FA 84.53 1.7 9.8 9.1 4639.35
UTL-FMH 71.31 7.7 8.8 7.8 3851.32
UTAD 65.75 8.7 8.4 8.1 5977.51
ISCTE 65.14 9.6 7.4 6.6 4135.02
Average 65.01 9.9 8.7 7.6 5546.03
Maximum 95.92 27.7 27.8 13.5 12015.06
Minimum 37.10 0.0 3.5 3.5 2021.06
na – not available
1/ OCES (2004a). [http://www.oces.mcies.pt/]
2/ Series constructed with data from OCES: http://www.oces.mcies.pt/.
3/ 4/ Includes overall number of teachers in the following categories: full Prof. (catedrático), associate Prof.
(associado), assistant Prof. (auxiliar), teaching assistant (assistente), trainee teaching assistant (assistente
estagiário), and others (leitor, monitor). OCES (2004b)
References
Afonso, A.; Schuknecht, L. and Tanzi, V. (2003). “Public Sector Efficiency: An International Comparison,” European Central Bank Working Paper Nº 242, July, forthcoming in Public Choice.
Afonso, A. and Santos, M. (2004). “Public Tertiary Education Expenditure in Portugal: a Non-Parametric Efficiency Analysis,” ISEG/UTL–Technical University of Lisbon, Department of Economics, Working Paper Nº 5/2004/DE/CISEP.
Afonso, A. and St. Aubyn, M. (2004). “Non-parametric Approaches to Public Education and Health Expenditure Efficiency in OECD countries.” ISEG/UTL– Technical University of Lisbon, Department of Economics, Working Paper Nº 1/2004/DE/CISEP/UECE, forthcoming in the Journal of Applied Economics.
Afonso, A. and St. Aubyn, M. (2005). “Cross-country Efficiency of Secondary Education Provision: a Semi-parametric Analysis with Non-discretionary Inputs,” with Miguel St. Aubyn. European Central Bank Working Paper Nº 494, June. ISEG/UTL–Technical University of Lisbon, Department of Economics, Working Paper Nº 5/2005/DE/CISEP/UECE.
Avkiran, N. (2001). “Investigating technical and scale efficiencies of Australian Universities through data envelopment analysis,” Socio-Economic Planning Sciences, 35, 57-80.
Athans, M. (2002). “Portuguese Research Universities: why not the Best?” Economia Global e Gestão, 7 (1), 121-139.
Blanchard, O. (2004). “The Economic Future of Europe.” NBER Working Paper 10310, February.
Breu, T. and Raab, R. (1994). “Efficiency and perceived quality of the nation's top 25 national universities and national liberal arts colleges: an application of data envelopment analysis to higher education,” Socio-Economic Planning Sciences, 28 (1), 33-45.
Calhoun, J. (2003). “Data Envelopment Analysis of Relative Efficiencies of Institutions of Higher Learning,” mimeo, University of Goeorgia.
Charnes, A.; Cooper, W. and Rhodes, E. (1978). “Measuring the efficiency of decision making units,” European Journal of Operational Research, 2 (6), 429–444.
Cherchye, L. and Abeele, P. (2005). “On research efficiency: A micro-analysis of Dutch university research in Economics and Business Management,” Research Policy 34 (4), 495-516.
Coelli, T. (1996). “Assessing the Performance of Australian Universities using Data Envelopment Analysis,” Centre for efficiency and productivity analysis, University of New England, NSW.
Coelli, T.; Rao, P. and Battese, G. (1998). An Introduction to Efficiency and Productivity Analysis, Kluwer, Boston.
Deprins, D.; Simar, L., and Tulkens, H. (1984). “Measuring labor-efficiency in post offices,” in: Marchand, M.; Pestieau, P. and Tulkens, H. (Eds.), The performance of public enterprises: concepts and measurement. Amsterdam: North-Holland.
Eurostat (2002). “Key Data on Education in Europe 2002”, European Commission.
Farrell, M. (1957). “The Measurement of Productive Efficiency,” Journal of the Royal Statistical Society, Series A, 120, Part 3, 253-290.
Førsund, F. and Kalhagen, K. (1999). “Efficiency and roductivity of Norwegian Colleges,” University of Oslo, Department of Economics WP 11/99.
Johnes, G. (1999). “The Management of Universities,” Scottish Journal of Political Economy, 46 (5), 505-522.
Joumady, O. and Ris, C. (2004). “Performance in European higher education: A non parametric production frontier approach,” University of New Caledonia, mimeo.
McMillan, M. and Datta, D. (1998). “The Relative Efficiencies of Canadian Universities: A DEA Perspective,” Canadian Public Policy, 24 (4), 485-511.
Murillo-Zamorano, L. (2004). “Economic Efficiency and Frontier Techniques,” Journal of Economic Surveys, 18 (1), 33-77.
OECD (2004). Education at a Glance – OECD Indicators 2004, OECD, Paris.
OCES (2004a). “Índice de Sucesso Escolar no Ensino Superior Público: Diplomados em 2002-2003,” Observatório da Ciência e do Ensino Superior, Ministério da Ciência e do Ensino Superior, 25-05-2004.
OCES (2004b). “Ensino Superior Público, Pessoal Docente e Rácio Aluno Docente/ETI em 31-12-2003,” Observatório da Ciência e do Ensino Superior, Ministério da Ciência e do Ensino Superior, 6-08-2004.
Simar, L. and Wilson, P. (2003). Efficiency analysis: the statistical approach, lecture notes, July.
St. Aubyn, M. (2003). “Evaluating Efficiency in the Portuguese Education Sector”, Economia, 26, 25-51.
Tulkens, H. (1993). “On FDH analysis: some methodological issues and applications to retail banking, courts and urban transit,” Journal of Productivity Analysis, 4, 183- 210.
Figure 1 - Undergraduate students in Portuguese public tertiary education sector (1993/94-2003/04)
0 50000 100000 150000 200000 250000 300000
1993/94 1994/95 1995/96 1996/97 1997/98 1998/99 1999/00 2000/01 2001/02 2002/03 2003/04
Polytechnic University
Source: OCES – Observatório da Ciência e do Ensino Superior.
Figure 2 - Structure of teachers’ categories in public universities: 1990-2003
0 2500 5000 7500
Teaching assistants
Assistant prof.
Associate prof. Full prof.
1990 2003
Source: OCES – Observatório da Ciência e do Ensino Superior and Direcção-Geral do Ensino Superior.
Figure 3 - DEA frontier: 1 input (FTE teachers per 100 students ratio, 2003), 1 output (success rate, 2003)
UL-FC
UNL-FCT
UP -ICB A S UNL-FD
UP -FD UL-FD
UC-FF
UP -FM D
UNL-FCM
20 30 40 50 60 70 80 90 100
0 2 4 6 8 10 12 14 16
FTE teachers per 100 students
S
u
cce
ss r
a
te
(
%
Table 1 – DEA analysis of tertiary education
Authors Sample Inputs Outputs Breu and
Raab (1994)
USA, 25 top
universities - SAT/ACT average or midpoint - Percentage faculty with doctorates - Faculty to student ratio
- Educational and general expenditures per student
- Graduation rate - Freshman retention rate
Coelli
(1996) Australia, 35 universities University model: - Total staff numbers - Non-staff expenses Academic model: - Academic staff numbers - Others expenses Administration model: - Administration staff
- Other administration expenses
- Student numbers - Publication index - Total staff numbers
McMillan and Datta (1998)
Canada, 45
universities -Total number of full-time faculty in the three professorial ranks -Number of full-time faculty eligible for grants
-Total expenditure less faculty salaries and benefits
-Total operating expenditure and sponsored research expenditure
-total fte (full time equivalent) undergraduate student enrolment -fte graduate enrolment in master’s level programs
-fte graduate enrolment in doctoral stream programs
-total sponsored research expenditure -number of active SSHRC and Canada Council grants as % of eligible faculty -number of active MRC and NSERC grants as a % of eligible faculty
Førsund and Kalhagen (1999) Norway, 99 colleges
departments for 3 years
- Number of academic staff in full time equivalents
- Number of non-academic staff in full time equivalents
- Current expenses other than salaries
- Building size in square metres
- Final exams–short studies - Final exams-long studies - Research publications
Calhoun
(2003) USA, 1323 institutions: 222 doctoral, 507 master’s and 594 bachelor’s granting institutions
- Academic support expenditures - Institutional support expenditures - Number of undergraduate and graduate students
- Tuition and fee revenues - Federal, state, and local appropriations
- Public and private grants and contracts
- Public service expenditures - Number of bachelors, master and doctoral degrees
- Number of first-professional degrees
- Number of certificates Warning
(2004) Germany, 73 publicly funded universities
- Expenditure on personnel
- Other expenditures - Citations index for publications - Graduates
Joumady and Ris (2004) 209 higher education institutions from Austria, Finland, France, Germany, Italy, the Netherlands, Spain, and UK
- Students entry grade - Teaching characteristics - Equipment and stocking of - Supply of teaching material - Technical equipment (PC, ...) - Course content of major
- Practical emphasis of teaching and learning
Table 2 – (M1) DEA results: 1 input (FTE teacher ratio, 2003), 1 output (success rate, 2003)
Input oriented Output oriented University/
Faculty/Institute VRS TE Rank VRS TE Rank
CRS TE
UA 0.409 45 0.550 45 0.283
UAL-FCHS 0.488 26 0.663 34 0.401 UAL-FCMA 0.474 29 0.669 32 0.394
UAL-FCT 0.391 46 0.650 35 0.322
UAL-FE 0.526 21 0.571 43 0.369
UAL-FERN 0.453 33 0.438 51 0.248
UAV 0.422 42 0.782 20 0.415
UBI 0.446 35 0.499 47 0.279
UC-FCT 0.426 41 0.630 38 0.337
UC-FD 0.979 6 0.975 7 0.967
UC-FE 0.688 10 0.446 50 0.358
UC-FF 1.000 1 1.000 1 0.632
UC-FL 0.526 22 0.684 30 0.442
UC-FPCE 0.619 12 0.676 31 0.500
UC-FCDEF 0.564 16 0.710 27 0.486
UE 0.467 31 0.588 42 0.342
UL-FL 0.550 18 0.528 46 0.354
UL-FD 1.000 1 1.000 1 0.761
UL-FC 0.360 50 0.570 44 0.262
UL-FF 0.435 39 0.828 15 0.433
UL-FPCE 0.415 44 0.700 28 0.366
UL-FMD 0.277 51 0.613 40 0.224
UL-FBA 0.481 28 0.639 36 0.382
UM 0.474 30 0.639 37 0.377
UMI 0.490 25 0.809 16 0.483
UNL-FCT 0.456 32 0.410 52 0.233
UNL-FCSH 0.422 43 0.624 39 0.331
UNL-FD 1.000 1 1.000 1 0.983
UNL-FE 0.596 14 0.755 22 0.541
UNL-FCM 0.444 36 0.916 10 0.310
UNL-ISEGI 0.616 13 0.482 48 0.355
UP-FL 0.578 15 0.742 24 0.518
UP-FD 1.000 1 1.000 1 1.000
UP-FC 0.440 38 0.666 33 0.366
UP-FE 0.486 27 0.865 12 0.482
UP-FF 0.714 8 0.958 8 0.516
UP-FEC 0.887 7 0.978 6 0.687
UP-FPCE 0.453 34 0.785 18 0.444
UP-FA 0.540 19 0.449 49 0.296
UP-ICBAS 0.273 52 0.744 23 0.268
UP-FMD 1.000 1 1.000 1 0.361
UP-FBA 0.389 47 0.789 17 0.384
UP-FCNA 0.627 11 0.692 29 0.518
UTL-IST 0.384 48 0.773 21 0.376
UTL-ISEG 0.537 20 0.864 13 0.536
UTL-ISA 0.376 49 0.845 14 0.368
UTL-FMD 0.499 24 0.903 11 0.408
UTL-ISCSP 0.713 9 0.602 41 0.495
UTL-FA 0.551 17 0.917 9 0.443
UTL-FMH 0.443 37 0.785 19 0.435
UTAD 0.429 40 0.722 26 0.389
ISCTE 0.523 23 0.729 25 0.469
Average 0.553 0.728 0.441
Table 3 – (M2) DEA results: 2 inputs (FTE teacher ratio, 2003; spending per student) and 1 output (success rate, 2003)
Input oriented Output oriented University/
Faculty/Institute VRS TE Rank VRS TE Rank
CRS TE
UA 0.409 36 0.557 36 0.283
UAV 0.422 35 0.792 18 0.415
UBI 0.474 27 0.506 38 0.279
UC-FCT 0.440 33 0.638 30 0.337
UE 0.486 24 0.597 34 0.342
UL-FL 0.610 13 0.534 37 0.362
UL-FD 1.000 1 1.000 1 1.000
UL-FC 0.363 39 0.574 35 0.262
UL-FF 0.438 34 0.838 13 0.433
UL-FPCE 0.456 30 0.708 25 0.371
UL-FMD 0.287 41 0.613 32 0.224
UL-FBA 0.611 12 0.650 28 0.432
UM 0.491 22 0.649 29 0.377
UMI 0.502 20 0.822 14 0.483
UNL-FCT 0.470 29 0.415 41 0.233
UNL-FCSH 0.516 19 0.635 31 0.364
UNL-FD 1.000 1 1.000 1 0.983
UNL-FE 0.603 14 0.758 20 0.541
UNL-FCM 0.481 26 0.916 8 0.310
UNL-ISEGI 0.616 11 0.483 39 0.355
UP-FL 0.635 9 0.747 21 0.526
UP-FD 1.000 1 1.000 1 1.000
UP-FC 0.453 31 0.675 27 0.366
UP-FE 0.486 25 0.876 11 0.482
UP-FF 0.750 7 0.971 6 0.516
UP-FEC 0.887 6 0.985 5 0.765
UP-FPCE 0.487 23 0.796 17 0.444
UP-FA 0.625 10 0.454 40 0.313
UP-ICBAS 0.288 40 0.744 22 0.268
UP-FMD 1.000 1 1.000 1 0.361
UP-FBA 0.472 28 0.805 15 0.425
UP-FCNA 0.660 8 0.693 26 0.518
UTL-IST 0.384 37 0.781 19 0.376
UTL-ISEG 0.537 18 0.878 10 0.536
UTL-ISA 0.376 38 0.850 12 0.368
UTL-FMD 0.499 21 0.910 9 0.408
UTL-ISCSP 0.999 5 0.602 33 0.602
UTL-FA 0.551 17 0.936 7 0.490
UTL-FMH 0.561 15 0.800 16 0.491
UTAD 0.444 32 0.731 24 0.389
ISCTE 0.560 16 0.740 23 0.469
Average 0.569 0.748 0.451
Table 4 – (M3) DEA results: 2 inputs (FTE teacher ratio, 2003; spending per student) and 1 output (success rate, 2003): only faculties and institutes
Input oriented Output oriented Faculty/Institute
VRS TE Rank VRS TE Rank
CRS TE
UC-FCT 0.440 27 0.638 25 0.337
UL-FL 0.610 13 0.534 30 0.362
UL-FD 1.000 1 1.000 1 1.000
UL-FC 0.363 31 0.574 29 0.262
UL-FF 0.438 28 0.838 13 0.433
UL-FPCE 0.456 25 0.708 21 0.371
UL-FMD 0.287 33 0.613 27 0.224
UL-FBA 0.611 12 0.650 24 0.432
UNL-FCT 0.470 24 0.415 33 0.233
UNL-FCSH 0.516 18 0.635 26 0.364
UNL-FD 1.000 1 1.000 1 0.983
UNL-FE 0.603 14 0.758 18 0.541
UNL-FCM 0.481 22 0.916 8 0.310
UNL-ISEGI 0.616 11 0.483 31 0.355
UP-FL 0.635 9 0.747 19 0.526
UP-FD 1.000 1 1.000 1 1.000
UP-FC 0.453 26 0.675 23 0.366
UP-FE 0.486 21 0.876 11 0.482
UP-FF 0.750 7 0.971 6 0.516
UP-FEC 0.887 6 0.985 5 0.765
UP-FPCE 0.487 20 0.796 16 0.444
UP-FA 0.625 10 0.454 32 0.313
UP-ICBAS 0.288 32 0.744 20 0.268
UP-FMD 1.000 1 1.000 1 0.361
UP-FBA 0.472 23 0.805 14 0.425
UP-FCNA 0.660 8 0.693 22 0.518
UTL-IST 0.384 29 0.781 17 0.376
UTL-ISEG 0.537 17 0.878 10 0.536
UTL-ISA 0.376 30 0.850 12 0.368
UTL-FMD 0.499 19 0.910 9 0.408
UTL-ISCSP 0.999 5 0.602 28 0.602
UTL-FA 0.551 16 0.936 7 0.490
UTL-FMH 0.561 15 0.800 15 0.491
Average 0.678 0.766 0.451
Table 5 – (M21) DEA results: 2 inputs (FTE teacher ratio, 2003; spending per student) and 2 outputs (success rate, 2003; PhD certificates per 100 teachers)
Input oriented Output oriented University/
Faculty/Institute VRS TE Rank VRS TE Rank
CRS TE
UA 0.409 39 0.581 38 0.284
UAV 0.422 38 0.841 20 0.416
UBI 0.474 30 0.559 39 0.299
UC-FCT 0.441 36 0.752 29 0.377
UE 0.486 28 0.651 32 0.344
UL-FL 0.638 13 0.604 36 0.447
UL-FD 1.000 1 1.000 1 1.000
UL-FC 0.742 10 0.940 10 0.413
UL-FF 0.438 37 0.875 18 0.433
UL-FPCE 0.471 32 0.770 24 0.404
UL-FMD 0.287 41 0.613 35 0.224
UL-FBA 0.611 18 0.650 33 0.432
UM 0.491 27 0.652 31 0.377
UMI 0.502 26 0.891 17 0.486
UNL-FCT 0.470 33 0.632 34 0.357
UNL-FCSH 0.621 15 0.762 26 0.526
UNL-FD 1.000 1 1.000 1 1.000
UNL-FE 0.603 19 0.758 28 0.541
UNL-FCM 0.481 29 0.916 14 0.310
UNL-ISEGI 0.616 16 0.507 40 0.356
UP-FL 0.677 11 0.814 21 0.591
UP-FD 1.000 1 1.000 1 1.000
UP-FC 0.453 34 0.762 27 0.372
UP-FE 0.614 17 0.954 9 0.486
UP-FF 0.985 8 0.998 7 0.516
UP-FEC 0.887 9 0.985 8 0.765
UP-FPCE 0.592 21 0.936 11 0.579
UP-FA 0.625 14 0.473 41 0.320
UP-ICBAS 0.598 20 0.929 13 0.369
UP-FMD 1.000 1 1.000 1 0.361
UP-FBA 0.472 31 0.805 22 0.425
UP-FCNA 0.660 12 0.700 30 0.518
UTL-IST 0.384 40 0.911 15 0.383
UTL-ISEG 0.537 25 0.903 16 0.536
UTL-ISA 1.000 1 1.000 1 0.445
UTL-FMD 1.000 1 1.000 1 0.412
UTL-ISCSP 0.999 7 0.602 37 0.602
UTL-FA 0.551 24 0.936 12 0.490
UTL-FMH 0.578 22 0.845 19 0.520
UTAD 0.444 35 0.770 25 0.390
ISCTE 0.564 23 0.795 23 0.495
Average 0.630 0.807 0.478
Table 6 – (M31) DEA results: 2 inputs (FTE teacher ratio, 2003; spending per student) and 2 outputs (success rate, 2003; PhD certificates per 100 teachers): only faculties and institutes
Input oriented Output oriented Faculty/Institute
VRS TE Rank VRS TE Rank
CRS TE
UC-FCT 0.441 30 0.752 25 0.377
UL-FL 0.638 13 0.604 30 0.447
UL-FD 1.000 1 1.000 1 1.000
UL-FC 0.742 10 0.940 10 0.413
UL-FF 0.438 31 0.875 17 0.433
UL-FPCE 0.471 27 0.770 21 0.404
UL-FMD 0.287 33 0.613 29 0.224
UL-FBA 0.611 18 0.650 27 0.432
UNL-FCT 0.470 28 0.632 28 0.357
UNL-FCSH 0.621 15 0.762 22 0.526
UNL-FD 1.000 1 1.000 1 1.000
UNL-FE 0.603 19 0.758 24 0.541
UNL-FCM 0.481 25 0.916 14 0.310
UNL-ISEGI 0.616 16 0.507 32 0.356
UP-FL 0.677 11 0.814 19 0.591
UP-FD 1.000 1 1.000 1 1.000
UP-FC 0.453 29 0.762 23 0.372
UP-FE 0.614 17 0.954 9 0.486
UP-FF 0.985 8 0.998 7 0.516
UP-FEC 0.887 9 0.985 8 0.765
UP-FPCE 0.592 21 0.936 11 0.579
UP-FA 0.625 14 0.473 33 0.320
UP-ICBAS 0.598 20 0.929 13 0.369
UP-FMD 1.000 1 1.000 1 0.361
UP-FBA 0.472 26 0.805 20 0.425
UP-FCNA 0.660 12 0.700 26 0.518
UTL-IST 0.384 32 0.911 15 0.383
UTL-ISEG 0.537 24 0.903 16 0.536
UTL-ISA 1.000 1 1.000 1 0.445
UTL-FMD 1.000 1 1.000 1 0.412
UTL-ISCSP 0.999 7 0.602 31 0.602
UTL-FA 0.551 23 0.936 12 0.490
UTL-FMH 0.578 22 0.845 18 0.520
Average 0.668 0.828 0.500
Table 7 – Descriptive statistics of efficiency scores and model specification
M1 M2 M21 M3 M31
Average Input 0.553 0.569 0.630 0.678 0.668
Output 0.728 0.748 0.807 0.766 0.828
Maximum 1 1 1 1 1
Minimum Input 0.273 0.287 0.287 0.287 0.287
Output 0.410 0.415 0.473 0.415 0.473
Std. dev. Input 0.194 0.197 0.211 0.213 0.218
Efficiency sc
ores
Output 0.167 0.164 0.157 0.170 0.158
Nº of DMUs 52 41 41 33* 33*
Nº of efficient DMUs 5 4 6 4 6
Efficient DMUs UC-FF, UL-FD, UNL-FD, UP-FD, UP-FMD UL-FD, UNL-FD, UP-FD, UP-FMD UL-FD, UNL-FD, UP-FD, UP-FMD, UTL-ISA, UTL-FMD UL-FD, UNL-FD, UP-FD, UP-FMD UL-FD, UNL-FD, UP-FD, UP-FMD, UTL-ISA, UTL-FMD Inputs - FTE teachers-to-students ratio - FTE teachers-to-students ratio - Spending per student - FTE teachers-to-students ratio - Spending per student - FTE teachers-to-students ratio - Spending per student - FTE teachers-to-students ratio - Spending per student Outputs - Success rate - Success rate - Success rate - PhD certificates per teacher - Success rate - Success rate - PhD certificates per teacher